Reprogrammed lipid metabolism in bladder cancer with cisplatin
resistance
Min Young Lee1, Austin Yeon2, Muhammad Shahid2, Eunho Cho3, Vikram Sairam3,
Robert Figlin4, Khae-Hwan Kim5 and Jayoung Kim2,3,4,5
1Institute for Systems Biology, Seattle, WA, USA
2Department of Surgery and Biomedical Sciences, Cedars-Sinai Medical Center, Los Angeles, CA, USA 3University of California Los Angeles, Los Angeles, CA, USA
4Samuel Oschin Comprehensive Cancer Institute, Cedars-Sinai Medical Center, Los Angeles, CA, USA 5Department of Urology, Ga Cheon University College of Medicine, Incheon, South Korea
Correspondence to: Jayoung Kim, email: [email protected] Khae-Hwan Kim, email: [email protected] Keywords: lipidomics; cisplatin resistance; bladder cancer
Received: October 06, 2017 Accepted: January 06, 2018 Published: January 13, 2018
Copyright: Lee et al. This is an open-access article distributed under the terms of the Creative Commons Attribution License 3.0
(CC BY 3.0), which permits unrestricted use, distribution, and reproduction in any medium, provided the original author and source are credited.
ABSTRACT
Due to its tendency to recur and acquire chemoresistance quickly, bladder cancer (BC) remains to be an elusive and difficult disease. Patients with recurrent and chemoresistant BC have an extremely poor prognosis. One possible approach that may provide insightful and valuable information regarding resistance mechanisms is looking into the lipid metabolism of BC cells. Metabolism of lipids is essential for cancer cells and is associated with the regulation of a variety of key cellular processes and functions. This study conducted a comparative lipidomic profiling of two isogenic human T24 bladder cancer cell lines, one of which is clinically characterized as cisplatin-sensitive (T24S) and the other as cisplatin-resistant (T24R). Immunohistochemistry analysis revealed that expression of cytosolic acetyl-CoA synthetase 2 (ACSS2) is positively correlated with aggressive BC. Ultra performance liquid chromatography-mass spectrometry (UPLC-MS) analysis profiled a total of 1,864 lipids and levels of differentially expressed lipids suspected of being associated with cisplatin resistance were determined. In addition, we found that ACSS2 inhibition greatly perturbed levels of metabolites, including CE(18:1), CE(22:6), TG(49:1), and TG(53:2). This study broadens our current knowledge on the links between cisplatin resistance and lipid metabolism in aggressive BC and suggests potential biomarkers for identifying higher-risk patients.
www.impactjournals.com/oncotarget/ Oncotarget, 2018, Vol. 9, (No. 17), pp: 13231-13243
INTRODUCTION
Bladder cancer (BC) has undoubtedly impacted the lives of many, as it has become the fi fth most prevalent type of cancer, with ~76,000 new cases and ~16,300 deaths per year worldwide [1–4]. Albeit treatment varies with each patient and tumor stage when found, the standard of treatment for BC usually involves surgical resection of the tumor followed by adjuvant chemotherapy with cisplatin [5]. While effective in some forms of cancer, cisplatin often loses its effi cacy in BC patients. Resistance often
builds up quickly, leaving fewer options for treatment. The mechanisms driving this increased resistance to cisplatin over time are generally unknown.
Since cancer initiation and progression is associated with changes in metabolism, investigation into the metabolomics of cancer could prove to be useful. In particular, dysregulated lipid metabolism, which regulates diverse classes of molecules that play critical roles in cellular energy, storage, and signaling [6], has been associated with aggressive forms of different cancers [7–10]. Furthermore, given that lipid metabolism is regulated by several oncogenic Research Paper
signaling pathways and is important for the initiation and progression of tumors [11], it is widely accepted that lipid alterations may serve as potential cancer biomarkers [12]. Lipidomic analysis aims to identify and quantify all the relevant lipids along with the goal of characterizing their interactions with other cellular components and functions, such as proteins or gene expression [13, 14]. Lipid and phospholipid metabolism also plays key roles in cellular motility, cell invasion, and tumor metastasis. Previous reports have shown that metabolic perturbation of phospholipids is associated with various cancer types [5, 15, 16], indicating that the composition of phospholipids may be critical for deciding the fate of tumor cells.
In this study, we hypothesized that a perturbed phospholipid metabolism is implicated in the more aggressive variants of BC. We sought to determine the lipid alterations underlying cisplatin resistance and address the lack of knowledge between metabolite alterations and drug resistance. Through a state-of-the-art mass spectrometry approach, the experimental results identifi ed lipid metabolites specifi c to cisplatin-resistant BC cells.
RESULTS
Characterization of isogenic cisplatin sensitive- or -resistant bladder cancer cells
To start identifying the cisplatin resistance-associated lipid metabolome, we utilized a paired cell culture system consisting of two isogenic cell lines, one of which was cisplatin sensitive (T24S) and the other resistant (T24R). Both cell lines were previously characterized in our laboratory [17]. Compared to T24S, T24R consistently exhibited a lower response to cisplatin-induced apoptosis (Figure 1A). The total lipid levels in T24R cells were approximately 170% of those in T24S cells, suggested that greater lipid production may be linked to cisplatin resistance (Figure 1B).
Prior studies have demonstrated that cancer cells have altered lipid metabolism [18, 19]. As a carbon source for producing fatty acids and cholesterol, acetate can be converted into cytosolic acetyl-CoA, which plays an important role in the TCA cycle [20–22]. The cytosolic acetyl-CoA synthetase 2 (ACSS2) mediates increased incorporation of acetate into lipids this processing. Given that a signifi cant increase in the levels of ACSS2 has been found in a series of cancer types, such as melanoma, breast, ovarian, and lung cancers [21, 23–26], we speculated that ACSS2 expression may also be correlated with bladder cancer. ACSS2 expression is associated with bladder cancer aggressiveness
To determine the relationship of ACSS2 to lipid metabolism and cisplatin resistance at the molecular level, we performed immunohistochemical (IHC) staining of tumor
microarrays using a commercially available ACSS2 antibody (Figure 1C–1D). This experiment revealed elevated ACSS2 expression in bladder tumor tissue cores. Our IHC analysis further confi rmed that ACSS2 is more abundantly expressed in tumor samples of higher grades. These experimental results suggest that ACSS2 expression is signifi cantly increased in BC cells and may also positively correlate with tumor grade. Recently, high-throughput small molecule screenings of over 200,000 chemical compounds have identifi ed inhibitors of ACSS2. One of the most potent and specifi c inhibitors is 1-(2,3-di(thiophen-2-yl)quinoxalin-6-yl)-3-(2-methoxyethyl)urea [25–27]. We were curious to see if inhibition of ACSS2 would have any effect on BC cells. We treated a set of normal bladder and BC cell lines (TRT-HU1, RT4, 5367, T24, and TCCSUP) with ACSS2 inhibitor for 24 h. Using this small ACSS2-inhibitory compound (MolPort), we found that total lipid levels of BC cell lines decreased, whereas those of normal cells (TRT-HU1) were not affected (Figure 1E).
Identifi cation of the lipids associated with cisplatin resistance
In order to determine the lipidomics profi le of cisplatin-resistant BC cells, global and unbiased metabolomics analysis was performed. We identifi ed differentially expressed lipids (DELs) by comparing BC cell lines T24R and T24S cells. Ultra performance liquid chromatography-mass spectrometry (UPLC-MS) detected a total of 1,864 lipids in both the positive and negative modes. The mass-to-charge (m/z) values, retention times, and abundance of the lipids are shown in Supplementary Table 1.
We measured 1,037 and 827 unique lipid species in the positive and negative modes, respectively. In the positive mode, 127 lipid species from cholesteryl ester (CE), ceramide (Cer), cholesterol, diacylglycerol (DG), glucosylceramide (GlcCer), lysophosphatidylcholines (LPC), phosphatidylcholine (PC), phosphatidylethanolamide (PE), sphingomyelin (SM) and triglyceride (TG) were identifi ed. In the negative mode, 92 lipid species from Cer, fatty acyls (FA), GlcCer, LPC, PC, PE, phosphatidylinositols (PI), and SM were identifi ed. Of interesting note, we found that essential structural components of cell membranes were major constituents of the identifi ed lipids in both the positive (48 PC, 11 SM, and 44 TG) and negative (14 CER, 10 FA, 32 PC, and 21 PE) modes. DELs between T24S and T24R cells in the positive or negative ion mode are shown in Table 1 and Supplementary Tables 2 and 3.
Inhibition of ACSS2 altered lipidomics profi les in cisplatin responsive bladder cancer cells
We next attempted to understand the biological effect of ACSS2 inhibition. Given our data showing that T24 BC cells showed the biggest inhibitory effect on lipid levels by ACSS2 inhibition, we choose T24 cells
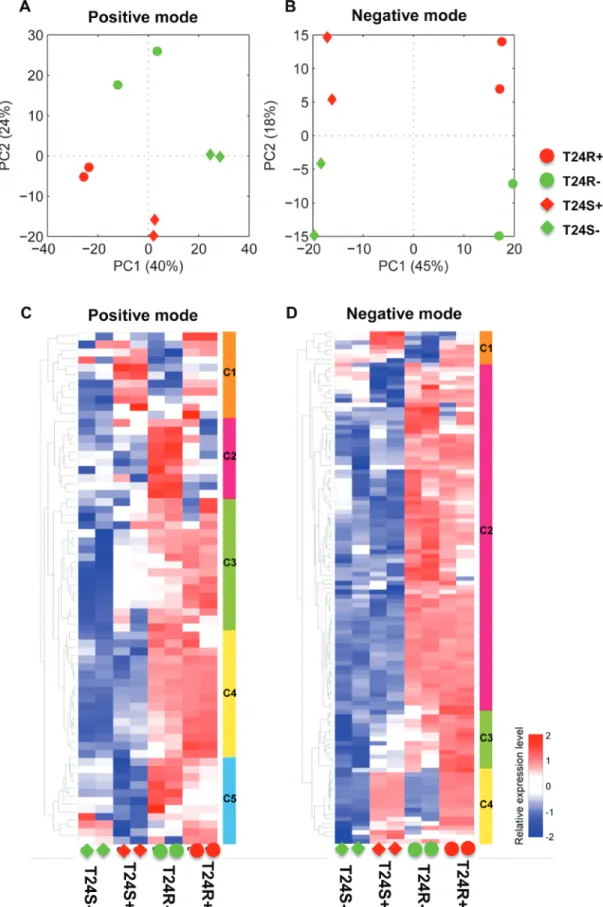
for further experiments using ACSS2 inhibitor [25–27]. The overall lipidomic profi les showed larger differences between T24S and T24R cells after treatment with ACSS2 inhibitor than treatment with vehicles in both positive (Figure 2A) and negative (Figure 2B) modes. The full list of detected lipids in both the positive and negative modes are shown in Supplementary Table 1.
The difference between T24S– (T24S not treated with ACSS2 inhibitor) and T24S+ (T24S treated with ACSS2 inhibitor) was larger compared to the difference between T24R– (T24R not treated with ACSS2 inhibitor) and T24R+ (T24R treated with ACSS2 inhibitor) in the positive mode (Supplementary Table 2). The expression patterns of DELs showed distinct abundances of various
Figure 1: Cisplatin resistance is associated with ACSS2. (A) Cisplatin resistant T24R cells showed a delayed apoptosis in response
to cisplatin treatment, compared to T24S. Cell viability was measured in the absence or presence of cisplatin media for 2 days. *p < 0.05 (Student’s t-test). (B) Total lipid levels of T24R were compared to T24S cells. **p < 0.005 (C–D) ACSS2 expression increased in bladder cancer tissues in comparison of normal bladder tissues. (C) The BC TMA was stained with anti-ACSS2 antibody (1:100) as described in the Materials and Methods section. The expression levels of ACSS2 were examined and quantifi ed based on positivity of staining as previously described. (D) Images of one representative example of staining in normal noncancerous bladder tissue (left), and one representative example of staining in the paired bladder tumor tissues from same patients (right) were shown. (E) ACSS2 inhibition decreased total lipid contents in a series of BC cells. Cells were incubated with ACSS2 inhibitor-containing media for 20 hrs, which was followed by lipid measurement as described in Methods. *p < 0.05, **p < 0.005 (Student’s t-test).
lipid species between the cell lines and treatments in both the positive (Figure 3A) and negative modes (Figure 2B) (Supplementary Table 3). DEL between T24S+ and T24S– in the negative or positive mode are shown in Supplementary Tables 4 and 5, while those for T24R+ and T24R– in the negative or positive mode are shown in Supplementary Tables 6 and 7.
In our heatmap constructed from the data obtained from lipidomics analysis in the positive mode, Cluster 1 (C1) showed higher expression levels in ACSS2 inhibitor treated cell lines, regardless of cisplatin sensitivity (Figure 2C). Cluster 2(C2) and Cluster 5(C5) showed the highest expression in T24R– compared to others (e.g., CE (22:6)). Cluster 3(C3) and Cluster 4(C4) showed higher expression in T24R regardless of ACSS inhibitor treatment (e.g., Ceramide (d42:2), PC(36:6), PC(35:4), PC(40:8), SM (d42:3), SM(d42:2), SM(d41:2), SM(d32:1), and SM(d34:0)) (Figure 2C).
In contrast, the heatmap indicating lipidomics data in the negative mode is shown in Figure 2D. The most
distinctive pattern was up-regulation in T24R, regardless of treatment with ACSS2 inhibitor. Cluster 2 (C2) included SM(d41:2), SM(d42:2), SM(d32:1), and PC(34:4). Cluster 1(C1) and Cluster 4(C4) showed up-regulation in ACSS inhibitor treated cells, regardless of cisplatin sensitivity (e.g., PC (40:6)). Cluster 3(C3) showed the lowest expression in T24S– and the highest expression in T24R+ (e.g., Ceramide(d42:2) and Ceramide(d34:0)) (Figure 2D). Distinct effects of ACSS2 inhibition on the lipid metabolome in cisplatin resistant bladder cancer cells
To further understand the metabolic consequences of ACSS2 inhibition, the lipid metabolite profi les of T24S+ and T24R+ were compared. Cisplatin-sensitive BC cell line (T24S) showed larger changes in lipid profi les compared to the resistant cell line (T24R). Among the identifi ed lipids, we found that 23 TG lipid species were down-regulated in T24S+, compared to T24S–, in the Table 1: Differentially expressed lipids (DEL) between T24S and T24R in positive or negative ion mode
Mode Identifi er Annotation InChI Key Species m/z RT P-value Q-value Log2FC
Mean normalized intensity
S-
R-Positive
10.30_719.57 CE (22:6) VOEVEGPMRIYYKC-HNJOWPRISA-N [M+Na]+ 719.5729 10.30 0.0116 0.0911 1.4461 7881.9 21476.0 4.93_768.55 PC (35:4) OROZWUJCDDCYAU-IPUAOQJZSA-N [M+H]+ 768.5528 4.93 0.0204 0.0948 0.6450 18501.8 28933.0 4.47_778.54 PC (36:6) SPWBDEZMKCRQSX-NGPPOSSDSA-N [M+H]+ 778.5385 4.47 0.0048 0.0931 0.6402 14238.8 22192.0 5.70_724.53 PE (p-36:4)/ PE (o-36:5) ADWDFBQPQIEGRZ-XBICFDGKSA-N [M+H]+ 724.5279 5.70 0.0002 0.0301 –0.6337 403765.9 260236.6 6.39_752.56 PE (p-38:4)/ PE (o-38:5) ZTZQZGHJLWFLFQ-VZBWJDOASA-N [M+H]+ 752.5591 6.39 0.0142 0.0897 –0.8247 239093.0 134988.5 6.40_778.57 PE (p-40:5)/ PE (o-40:6) HHQFKPJXVYWLLJ-ABYSKWQHSA-N [M+H]+ 778.5743 6.40 0.0185 0.0951 –0.6302 80510.8 52015.6 7.15_813.68
_7.15_835.67 SM (d42:2) DACOGJMBYLZYDH-GXJPFUDISA-N _[M+Na]+[M+H]+ _835.6658813.6848 7.15 0.0070 0.0814 1.2411 204780.6 484070.9 6.56_811.66
_6.55_833.65 SM (d42:3) TXFLWJQVQCDUDZ-BRUGZULGSA-N _[M+Na]+[M+H]+ _833.6505811.6624 6.56 0.0001 0.0558 4.3471 10492.5 213546.9 11.16_829.73 _11.17_824.77 TG (48:0) PVNIQBQSYATKKL-UHFFFAOYSA-N _[M+NH4]+[M+H]+ _824.7705829.7256 11.17 0.0060 0.0894 –1.7587 190985.2 56439.4 11.32_838.78 TG (49:0) TTWJTJMWHOYBPQ-ANFMRNGASA-N [M+NH4]+ 838.7829 11.32 0.0262 0.0989 –1.6911 15051.5 4661.4 10.96_841.73 _10.96_836.77 TG (49:1) VYYGQDOPVVYUKW-UKFBYESTSA-N _[M+NH4]+[M+H]+ _836.7709841.7263 10.96 0.0256 0.0993 –1.5552 64017.0 21784.1 11.56_857.76
_11.57_852.80 TG (50:0) MARPCPMDFOPPJX-UHFFFAOYSA-N _[M+NH4]+[M+Na]+ _852.8018857.7562 11.57 0.0177 0.0989 –2.0145 151586.5 37517.4 11.89_885.78
_11.91_880.84 TG (52:0) SDNYRTVJOFMYIW-OIVUAWODSA-N _[M+NH4]+[M+H]+ _880.8354885.784 11.90 0.0115 0.0920 –1.7912 96039.1 27748.3 10.69_898.79
_10.67_903.74 TG (54:5) OEJXMJPFOHYSIU-GRLFFVHSSA-N [M+NH4]+_[M+Na]+ _903.7415898.7855 10.68 0.0191 0.0941 –1.4113 212399.1 79854.1 Negative
4.40_733.55 SM (d32:1) KYICBZWZQPCUMO-PSALXKTOSA-N [M+Hac-H]- 733.5478 4.40 0.0001 0.0027 1.1264 18915.2 41295.4 7.15_871.69 SM (d42:2) B DACOGJMBYLZYDH-GXJPFUDISA-N [M+Hac-H]- 871.6894 7.15 0.0012 0.0212 1.2472 46562.3 110528.3 Annotated DELs with q-value less than 0.1 were shown. The full list of DELs was included in Supplementary Table 2 and 3. For each DEL, unique identifi er given as RT, m/z, annotation identifi ed by MS-Dial, InChI key, formula of the lipid, m/z, retention time (RT), p-value, q-value, log2-transformed fold-change (log2FC), and mean normalized
Figure 2: Differentially expressed lipids in T24R compared to T24S. (A–B) Principal component analyses (PCA) of lipid
profi les of T24S and T24R in the absence or presence of ACSS2 inhibitor were shown. The lipid profi les were acquired in (A) positive ion mode and (B) negative ion mode. S and R indicate cisplatin sensitive and resistant bladder cancer cell lines. The positive (+) and negative (-) symbols indicate treatment of ACSS2 inhibitor and vehicle, respectively. (C–D) Heatmaps showing differentially expressed lipids in T24R compared to T24S in the absence and the presence of ACSS2 inhibitor treatment. (C) DELs identifi ed in positive mode, and (D) in negative mode.
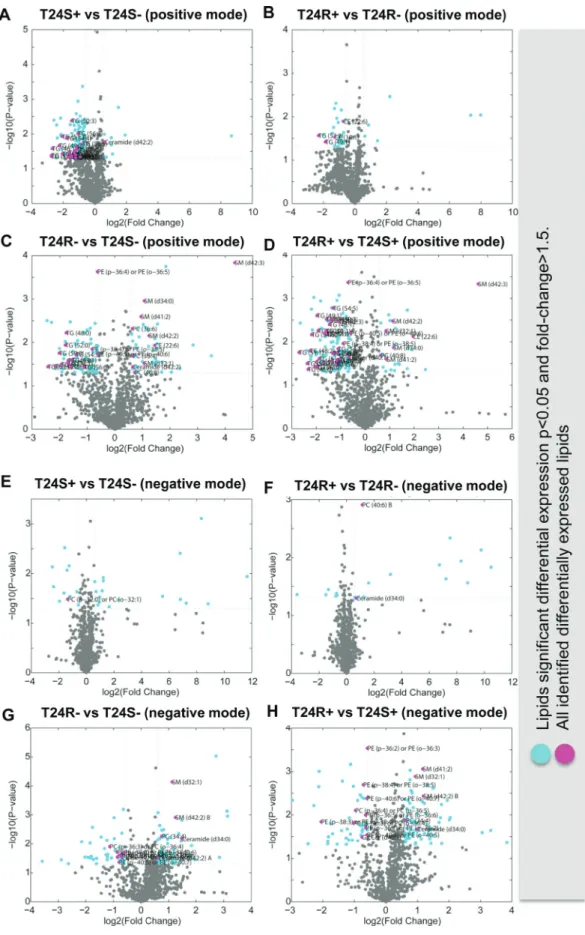
positive mode (Figure 3A). Four lipid species, 2 CE and 2 TG, were downregulated in T24R+, compared to T24R–, in the positive mode (Figure 3B).
Compared to T24S in the positive mode, T24R had 42 lipid species that were upregulated and 68 species that were downregulated. Of these lipid species, 3 PC and 5 SM lipid species were upregulated and 3 PE and 12 TG lipid species were downregulated (Figure 3C). Compared to T24S+ in the positive mode, T24R + had 5 SM lipid species that were upregulated and 3 PE and 29 TG lipid species that were downregulated (Figure 3D).
Only a few identifi ed lipid species were differentially expressed between T24S+ and T24S– (Figure 3E) and T24R+ and T24R– (Figure 3F). There were more differentially expressed lipids associated with cisplatin-resistance. Among the identifi ed lipids, 6 PE lipid species were downregulated in T24R–, compared to T24S–, in the negative mode (Figure 3G). In addition, 2 PC and 7 PE lipid species were downregulated in T24R+, compared to T24S+, in the negative mode (Figure 3H).
These results show that the levels of most lipid metabolites specifi c to T24R were not signifi cantly affected by ACSS2 inhibitor treatment (Figures 3A and 3B). Levels of metabolites, such as CE(18:1), CE(22:6), TG(49:1), and TG(53:2) were greatly perturbed by ACSS2 inhibition (Figures 4A–4D). In contrast, the expression levels of several unknown metabolites such as 11.86_1000.92, 12.22_369.35, and 8.57_711.58/8.57_735.61 decreased only in T24R cells, but not in T24S cells (Figures 4E–4G). Collectively, these fi ndings suggest that cisplatin resistance is associated with defects in acetate and lipid metabolism.
DISCUSSION
In this study, we sought to characterize the cisplatin resistant lipidome in BC. Through the integration of lipidomics and systems biology approaches, this study has broadened our understanding of the lipid biology associated with cisplatin resistance in BC. The experimental results also suggest potential lipid biomarkers and therapeutic targets.
Lipid metabolism is often disturbed in cancer cells and this is expected to result in differing lipid composition [28]. However, profi ling of disease-related lipids specifi c to cancer is still underdeveloped, compared to those of genes and proteins. Lipidomics profi ling aims to identify lipids using mass spectrometry and annotate them based on a metabolite database [12]. Other approaches that allow for analysis of lipids in cancer tissue include nuclear magnetic resonance (NMR), mass spectroscopy (MS) [12], matrix-assisted laser desorption and ionization (MALDI), and electrospray ionization (ESI) [29, 30], which allow for analysis of lipids in cancer tissue. Integration of lipidomic strategies in cancer research could generate new opportunities to gain insights into diagnosis, prognosis and prediction of therapies [14].
Experimental results from our study revealed a list of identifi ed lipids that is heterogenous and belongs to several different classes. The original goal of this study was to determine the global lipid metabolome in cisplatin resistant BC. Although this is out of scope for this particular study, there has been much speculation regarding the potential biological signifi cance of differential amounts of sphingomyelin (SM) and ceramide (CE) on membrane structure, permeability, and signaling platform formation. Several reports have suggested that strict distribution patterns of lipid species and enzymes determine cell fate through regulatory mechanisms. For instance, higher levels of SM are associated with drug resistance, possibly through alterations of membrane packing [31]. Sphingomyelinase, an enzyme that catalyzes the breakdown of SM into CE and phosphorylcholine, also induces apoptosis by altering the balance between SM and CE. Additionally, C16:0-ceramide has recently been reported as a principal mediator of obesity-related insulin resistance [32, 33]. Furthermore, in various cancer, phosphoglyercides, namely PC, PE, and PI, are upregulated [34, 35]. In particular, it is known that cholesterol and sphingolipids form specifi c planar microdomains, known as lipid rafts [36]. In cancer cells, these lipid rafts contain receptors for signaling proteins involved in oncogenic and apoptotic pathways [37]. Cholesterol is enhanced in the cell membrane of various cancer cells [38, 39]. Sphingolipids (sphingomyelin) are also involved in several cancer-related processes, such as proliferation, apoptosis and metastasis [40]. Therefore, by compiling lipidomic data, we could identify potential lipid signatures from a combination of different lipids, which could then be used to classify tumor samples from healthy controls.
Furthermore, our fi ndings identifi ed specifi c ACSS2-inhibiting lipid metabolites, such as CE(18:1), CE(22:6), TG(49:1), and TG(53:2) (Figure 4). Alterations in the levels of phospholipid metabolites, such as PC and PE, have often been considered as biochemical indicators of tumor progression or drug response [41–44]. Lipid perturbation in BC has been observed in a series of previous papers. From 40 paired bladder cancer and adjacent normal bladder tissues, Dill et al. found that levels of PI, PS, and FA were changed in BC tissues [45]. Using the DESI-IMS method, the authors found a signifi cant increase of PS(18:0/18:1), PI(18:0/20:4) and FA(18:1) in bladder tumor tissues (n = 20), compared to healthy controls (n = 20). In the dog model BC (n = 4), levels of PS(18:0/18:1), PG(18:1/18:1), PI(16:0/18:1), PI(18:0/18:1), PS(18:1/18:1), PC(34:1), and PC(36:2) increased in BC tissue compared to normal [46]. Our study demonstrates that levels of CE(22:6), TG(49:1), and TG(53:1) et al. are signifi cantly elevated in resistant BC cells compared to their cisplatin-sensitive counterparts. This conveys that these lipids may be actively involved in BC pathogenesis. Ceramide, a sphingomyelin byproduct and gangliosiode precursor, is potentially related to tumor growth and metastasis.
Figure 3: Volcano plots of cisplatin sensitive and resistant bladder cancer cell lines. (A–D) Positive ion mode. (A) T24S+
and T24S–; (B) T24R+ and T24R–; (C) T24R– and T24S–; (D) T24R+ and T24S+. Cyan dots indicate the DEL (p < 0.05 and fold-change >1.5). Magenta dots indicate the identifi ed DEL. (E–H) Negative mode. (E) T24S+ and T24S–; (F) T24R+ and T24R–; (G) T24R– and T24S–; (H) T24R+ and T24S+. Cyan dots indicate the DEL (p < 0.05 and fold-change >1.5). Magenta dots indicate the identifi ed DEL. The x-axis and y-axis show log2-tranformed fold changes and log10-transformed p-values.
Exogenous addition of a specifi c ganglioside mediated the epithelial-to-mesenchymal transition in BC cells [47], and also inhibited cell proliferation through inhibition of the EGFR signaling pathway [48, 49]. Furthermore, growth of bladder tumors was delayed by GM3 in the orthotopic bladder cancer model. N-glycolyl-GM3, which contains N-glycolylneuraminic acid instead of N-acetylneuraminic acid, was observed in colon and breast cancers and is suggested as a potential target for cancer therapy. We also found that TG species, which are composed of a glycerol molecule linked by ester bonds to three fatty acids with chain lengths of 49:1 or 53:2, were signifi cantly decreased in resistant BC cells compared to
cisplatin-sensitive control cells. TG (and diacylglycerols (DG)) plays an important role in cellular membranes and signaling pathways. TG also mediates the storage of fatty acids and energy, and provides the precursors needed for phospholipid biosynthesis.
Although these fi ndings are quite exciting, this study has several limitations. While global lipidomics offer exciting technologies, we are aware that there are still constraints with data interpretation. Despite the fact that available databases for interpreting lipidomics profi les have progressed rapidly in recent years, many lipids and lipid metabolites are still functionally uncharacterized or completely unknown. In this current study, we attempted
Figure 4: Lipid metabolites whose levels were decreased with ACSS2 inhibition. (A–D) Among 27 lipid metabolites that
signifi cantly decreased by ACSS2 inhibitor in positive mode, four lipid species (A) CE(18:1), (B) CE(22:6), (C) TG(49:1), and (D) TG(53:2) were identifi ed. (E–G) Examples of lipid metabolites specifi cally responsive to ACSS2 inhibitor treatment only in T24R cells. Three lipid species (E) 11.86_1000.92 in positive mode, (F) 12.22_369.35 in positive mode, and (G) 8.57_711.58/8.57_735.61 in negative mode showed statistically signifi cant changes (p < 0.05 and fold-change >1.5) by ACSS2 inhibitor only in T24R cells. The lipid identifi ers denote retention (RT) time and m/z.
to extract and provide as much biological information as possible on the lipid metabolites identifi ed. In addition, our study lacked further validation using independent and targeted analyses. A fi nal major outstanding defi ciency in this study was lipidomics profi ling using clinical samples, which would have signifi cantly strengthened our fi ndings.
In summary, we used an untargeted lipidomics approach to depict a comprehensive picture of BC using both cisplatin-sensitive and resistant cell lines. We have confi dently profi led a diverse lipid signature of 1,037 and 827 lipids for these cell lines. Specifi cally, differential lipid abundances were observed in molecular species that are known to have signifi cant roles in regulating cancer progression. Based on this lipidomic study, adjusting lipid metabolism purposively may represent an optimal strategy in overcoming cisplatin resistance and improving cancer therapy. This study not only facilitates the development of new drugs against cisplatin resistance, but also provides a novel method in the clinical diagnosis of cisplatin-resistant bladder cancer.
MATERIALS AND METHODS
Cell culture and transfectionRT4, 5367, TCCSUP, and T24 BC cells were obtained and cultured, according to instructions provided by ATCC. Immortalized normal human bladder epithelial cells, TRT-HU1, were maintained as described previously [14]. Media was supplemented with 10% fetal bovine serum, 2% glutamine and 1% antibiotics (Invitrogen, Carlsbad, CA). Cells were maintained under a humidifi ed atmosphere of 5% CO2 at 37° C. The TRT-HU1 cell line was constructed and extensively characterized in previously published papers. These cells lines tested negative for mycoplasma and all other infectious agents. Cell survival assay
T24S and T24R cell lines were incubated with 10 mM cisplatin for 2 days. Cell survival was determined by measuring cell viability using MTS reagents, according to the company’s protocols (Promega Corporation, Madison, WI).
Lipidomics by charged surface hybrid column (CSH)-electrospray (ESI) quadrupole time of fl ight mass spectrometer (QTOF) MS/MS
Lipidomics and data analysis were conducted at the NIH West Coast Metabolomics Center (UC Davis).
Extraction
T24 cells were extracted as indicated in the following protocols [50], which was slightly modifi ed from the earlier protocols [51]. The lipid extracts were separated using methanol and MTBE, which can separate lipids from proteins and other small polar hydrophilic molecules in a way such that the lipids were found in the top layer of a liquid-liquid separation, rather than in the bottom layer. Therefore, decanting the top layer ensured that the proteins or polar compounds did not contaminate the lipid extracts. We optimized the choice of internal standards and chromatographic conditions; e.g. by using toluene in the reconstitution solvent mixture to ensure that lipophilic components, like CE and TAGs, were transferred to the UHPLC column during the injection process.
Data acquisition
Data was acquired using the following chromatographic parameters: Column, Waters Acquity UPLC CSH C18 (100 mm length × 2.1 mm internal diameter; 1.7 μm particles); Mobile phase A, 60:40 acetonitrile:water + 10 mM ammonium formiate + 0.1% formic acid; Mobile phase B, 90:10 v/v isopropanol:acetonitrile + 10 mM ammonium formate + 0.1% formic acid; Column temperature: 65° C; Flow-rate: 0.6 mL/min; Injection volume: 3 μL; Injection temperature: 4° C; Gradient: 0 min 15% (B), 0–2 min 30% (B), 2–2.5 min 48% (B), 2.5–11 min 82% (B), 11–11.5 min 99% (B), 11.5–12 min 99% (B), 12– 12.1 min 15% (B), 12.1–15 min 15% (B).
This chromatography method yielded excellent retention and separation of lipid classes (PC, lysoPC, PE, PS, TAG, ceramides) with narrow peak widths of 8–17 s. In addition, we saw very good within-series retention time reproducibility of better than 6 s absolute deviation. We used automatic valve switching after each injection, which was shown to reduce sample carryover for highly lipophilic compounds, such as TAGs from 29% to 0.1%. The valve switching occurred at 0.10, 11.60 and 13.00 minutes. At 0.1 minutes, the sample has fl own through. Then at 11.60 minutes, the valve switching allows the mobile phase (99% B) to fl ow through the needle and fl ush out any highly lipophilic compounds. Finally, it switches at 13.00 minutes to re-equilibrate the needle to initial conditions. 100% isopropanol wash is used to wash the needle before every injection (after sample has been picked up).
The following mass spectrometry parameters were used: for positively charged lipids, such as PC, lysoPC, PE, and PS, an Agilent 6530 QTOF mass spectrometer was used with a resolution of R = 10,000; for negatively charged lipids, such as free fatty acids and phosphatidylinositols, an Agilent 6550 QTOF mass spectrometer set at R = 20,000 was used.
Identifi cation and quantifi cation of lipids
Raw data was processed through MS-DIAL [52]. First, peaks were detected and quantifi ed for each sample. A peak table including RT, m/z, and intensity was constructed for each sample. Then, peak alignment across all samples was performed in four steps: (1) a reference peak table was constructed. The reference peak table started with one of the sample tables. All peaks from other sample tables were examined if they are in the reference table. If the peaks are outside the RT and m/z tolerance of 0.1 min and 0.025 D, they were inserted to the reference peak table. (2) All peak information including alignment ID, average RT, average m/z and intensities of all samples were associated to the reference peak table to generate a complete aligned peak table. (3) The aligned peaks with missing intensity information in all samples were fi ltered out. (4) In order to impute missing intensity values, MS-Dial searched a feature with a local maximum intensity with the same RT and m/z tolerance in step (1). When no feature was found to align in a sample, MS-Dial fi lls zero to indicate that the abundance of the peak was not measured.
Normalization and identifi cation of differentially expressed lipids
The normalization procedure was based on the sum of all peak heights for all identifi ed lipids in each sample that were defi ned as mTIC. The normalization factor for a sample was calculated by dividing the average mTIC by the mTIC of the sample being assessed. The intensities of all the lipid species were then multiplied by the calculated normalization factor. Differentially expressed lipids (DEL) were identifi ed based on a signifi cance test of P < 0.05 from a two-sample t-test and if there was a fold change greater than 1.5. The Q-value, an FDR adjusted p-value, was computed for each p-value using the procedure introduced by Storey, 2002 [53]. Principal component analysis (PCA) was applied to summarize variations in the lipid profi les of different cell lines and the effect of treatment with ACSS1 inhibitor. The normalized intensities were transformed to a log scale with a base of 2. The missing values in a lipid species were estimated as the minimum value of the quantifi ed values before PCA was applied. To cluster lipids that shared similar intensity profi les across conditions, hierarchical clustering was applied with Ward linkage and Euclidean distance as a similarity measure.
IHC analysis using TMA
The tissue microarrays (TMA) were obtained from a commercial resource (Biomax, BL802). They contain 80 cases in 80 cores. Sixty cores were bladder cancer tissues, 10 cores were normal bladder tissues, and 10 cores were normal adjacent to tumors. The antibody specifi c to ACSS2 (D19C6) was purchased from Cell Signaling Technology (Beverly, MA, United States). For the antigen
retrieval, we used a high pH method. For counterstaining, an Ultraview DAB Detection Kit (Ventana Medical Systems) was used.
Slide annotation and digitalized IHC analysis The slides were annotated and characterized using Leica Tissue IA 2.0 software (Copyright 2012 by SlidePath Ltd.). For quality control measures, hematoxylin and eosin (H&E) stained slides were used during the annotation. The ACSS2 slide was viewed with its corresponding H&E slide to ensure the annotation was done on the bladder tumor epithelium only. Stromal and structural tissues were cut off from annotation. A minimum number of cells measured per slide were set up as 100,000 cells/core.
Following annotations, analysis was done using the Leica Tissue IA 2.0 software. The Measure Stained Cells Algorithm was selected. Color defi nition preferences were defi ned, and algorithm input parameters were optimized by using several stained images of slides. The optimized algorithm was used for the analysis of all slides. Haematoxylin was set as the nuclear counter stain, and 3,3’Diaminobenzidine (DAB) was set as the nuclear, cytoplasmic, and membrane marker.
Parameters in the software are based on a grayscale. Zero is the minimum intensity (black), and 255 is the maximum intensity (white). We set the threshold range at 170 and 80 for positive and negative staining, respectively. The max nuclear window size radius was set to default and the nuclear area threshold was set to 0–500 mm2 (any nuclei or cells out of these range were
cut off). The minimum percentage of stained area in order to be considered positive in the nucleus was set to 20%. The threshold for cytoplasmic staining was set at a higher range (160–22) because of the background contrast of the cytoplasmic counterstain and the antibody staining. In order for positive cytoplasmic staining to be detected, the threshold had to be set higher since the blue cytoplasmic staining was only slightly lighter than the antibody staining. The minimum percentage of stained area was set to 75%. After the annotation analysis, data of the nuclear h-score, % of positive nuclei, % of positive nuclear area, the cellular cytoplasmic h-score, and % of positive cytoplasmic staining were collected and visualized into box plots. Each annotated core had a minimum threshold of 100,000 cells to be analyzed. Three individual measurements were performed in a blinded manner without any information of clinical data. After computerized data analysis, positivity was collected from data for the % of positive nuclei in tissue, which was used for comparative graphing.
Measurement of lipid levels in cells
Cells (1.2 × 10⁶/experimental group) were fi nely
harvested in phosphate buffered saline (PBS) on ice, and total lipid levels were determined after lipid extraction
using the Infi nity Cholesterol Liquid Stable Reagent (Thermo Electron Corp., Waltham, MA).
Statistical analysis
The mean of more than three replicates was used as the average. The p-values were calculated using a standard unpaired Student’s t-test for simple comparisons and
p > 0.05 was considered statistically signifi cant.
ACKNOWLEDGMENTS
The authors thank NIH West Coast Metabolomics Center for their skillful technical assistance.
CONFLICTS OF INTEREST
The authors declare that there is no confl ict of interest that it could be perceived as prejudicing the impartiality of this review.
FUNDING
The authors acknowledge support by the National Institutes of Health grants (1U01DK103260), Department of Defense grants (W81XWH-15-1-0415), Centers for Disease Controls and Prevention (1U01DP006079), the Steven Spielberg Discovery Fund in Prostate Cancer Research Career Development Award, and the U.S. - Egypt Science and Technology (S&T) Joint Fund, funded by the National Academies of Sciences, Engineering, and Medicine and USAID. Any opinions, fi ndings, conclusions, or recommendations expressed in this article are those of the authors alone, and do not necessarily refl ect the views of any of the previously mentioned sponsors.
REFERENCES
1. Siegel RL, Miller KD, Jemal A. Cancer statistics, 2016. CA Cancer J Clin. 2016; 66:7–30. https://doi.org/10.3322/ caac.21332.
2. Nielsen ME, Smith AB, Meyer AM, Kuo TM, Tyree S, Kim WY, Milowsky MI, Pruthi RS, Millikan RC. Trends in stage-specifi c incidence rates for urothelial carcinoma of the bladder in the United States: 1988 to 2006. Cancer. 2014; 120:86–95. https://doi.org/10.1002/cncr.28397.
3. Prout GR Jr, Barton BA, Griffi n PP, Friedell GH. Treated history of noninvasive grade 1 transitional cell carcinoma. The National Bladder Cancer Group. J Urol. 1992; 148:1413–9. 4. Babjuk M, Burger M, Zigeuner R, Shariat SF, van
Rhijn BW, Comperat E, Sylvester RJ, Kaasinen E, Bohle A, Palou Redorta J, Roupret M, European Association of U. EAU guidelines on non-muscle-invasive urothelial carcinoma of the bladder: update 2013. Eur Urol. 2013; 64:639–53. https://doi.org/10.1016/j.eururo.2013.06.003.
5. Inazu M. Choline transporter-like proteins CTLs/SLC44 family as a novel molecular target for cancer therapy. Biopharm Drug Dispos. 2014; 35:431–49. https://doi. org/10.1002/bdd.1892.
6. Wenk MR. The emerging fi eld of lipidomics. Nat Rev Drug Discov. 2005; 4:594–610. https://doi.org/10.1038/nrd1776. 7. Rinaldi L, Avgustinova A, Martin M, Datta D, Solanas G,
Prats N, Benitah SA. Loss of Dnmt3a and Dnmt3b does not affect epidermal homeostasis but promotes squamous transformation through PPAR-gamma. Elife. 2017; 6. https://doi.org/10.7554/eLife.21697.
8. Dany M. Sphingosine metabolism as a therapeutic target in cutaneous melanoma. Transl Res. 2017; 185:1–12. https:// doi.org/10.1016/j.trsl.2017.04.005.
9. Lin L, Ding Y, Wang Y, Wang Z, Yin X, Yan G, Zhang L, Yang P, Shen H. Functional lipidomics: Palmitic acid impairs hepatocellular carcinoma development by modulating membrane fl uidity and glucose metabolism. Hepatology. 2017. https://doi.org/10.1002/hep.29033. 10. Gholkar AA, Cheung K, Williams KJ, Lo YC, Hamideh SA,
Nnebe C, Khuu C, Bensinger SJ, Torres JZ. Fatostatin Inhibits Cancer Cell Proliferation by Affecting Mitotic Microtubule Spindle Assembly and Cell Division. J Biol Chem. 2016; 291:17001–8. https://doi.org/10.1074/jbc. C116.737346.
11. Adibhatla RM, Hatcher JF, Dempsey RJ. Lipids and lipidomics in brain injury and diseases. AAPS J. 2006; 8:E314–21. https://doi.org/10.1208/aapsj080236.
12. Zhao YY, Miao H, Cheng XL, Wei F. Lipidomics: Novel insight into the biochemical mechanism of lipid metabolism and dysregulation-associated disease. Chem Biol Interact. 2015; 240:220–38. https://doi.org/10.1016/j. cbi.2015.09.005.
13. Lagarde M, Geloen A, Record M, Vance D, Spener F. Lipidomics is emerging. Biochim Biophys Acta. 2003; 1634:61.
14. Lee GK, Lee HS, Park YS, Lee JH, Lee SC, Lee JH, Lee SJ, Shanta SR, Park HM, Kim HR, Kim IH, Kim YH, Zo JI, et al. Lipid MALDI profi le classifi es non-small cell lung cancers according to the histologic type. Lung Cancer. 2012; 76:197–203. https://doi.org/10.1016/j.lungcan.2011.10.016. 15. Smith EL, Schuchman EH. The unexpected role of acid
sphingomyelinase in cell death and the pathophysiology of common diseases. FASEB J. 2008; 22:3419–31. https://doi. org/10.1096/fj.08-108043.
16. Cummings BS. Phospholipase A2 as targets for anti-cancer drugs. Biochem Pharmacol. 2007; 74:949–59. https://doi. org/10.1016/j.bcp.2007.04.021.
17. Kim WT, Kim J, Yan C, Jeong P, Choi SY, Lee OJ, Chae YB, Yun SJ, Lee SC, Kim WJ. S100A9 and EGFR gene signatures predict disease progression in muscle invasive bladder cancer patients after chemotherapy. Ann Oncol. 2014; 25:974–9. https://doi.org/10.1093/annonc/mdu037.
18. Nielsen J. Systems Biology of Metabolism: A Driver for Developing Personalized and Precision Medicine. Cell Metab. 2017; 25:572–9. https://doi.org/10.1016/j. cmet.2017.02.002.
19. Vander Heiden MG, DeBerardinis RJ. Understanding the Intersections between Metabolism and Cancer Biology. Cell. 2017; 168:657–69. https://doi.org/10.1016/j. cell.2016.12.039.
20. Gao X, Lin SH, Ren F, Li JT, Chen JJ, Yao CB, Yang HB, Jiang SX, Yan GQ, Wang D, Wang Y, Liu Y, Cai Z, et al. Acetate functions as an epigenetic metabolite to promote lipid synthesis under hypoxia. Nat Commun. 2016; 7:11960. https://doi.org/10.1038/ncomms11960.
21. Schug ZT, Peck B, Jones DT, Zhang Q, Grosskurth S, Alam IS, Goodwin LM, Smethurst E, Mason S, Blyth K, McGarry L, James D, Shanks E, et al. Acetyl-CoA synthetase 2 promotes acetate utilization and maintains cancer cell growth under metabolic stress. Cancer Cell. 2015; 27:57–71. https://doi.org/10.1016/j.ccell.2014.12.002. 22. Zhao S, Torres A, Henry RA, Trefely S, Wallace M, Lee JV,
Carrer A, Sengupta A, Campbell SL, Kuo YM, Frey AJ, Meurs N, Viola JM, et al. ATP-Citrate Lyase Controls a Glucose-to-Acetate Metabolic Switch. Cell Rep. 2016; 17:1037–52. https://doi.org/10.1016/j.celrep.2016.09.069. 23. Lakhter AJ, Hamilton J, Konger RL, Brustovetsky N,
Broxmeyer HE, Naidu SR. Glucose-independent Acetate Metabolism Promotes Melanoma Cell Survival and Tumor Growth. J Biol Chem. 2016; 291:21869–79. https://doi. org/10.1074/jbc.M115.712166.
24. Sabari BR, Tang Z, Huang H, Yong-Gonzalez V, Molina H, Kong HE, Dai L, Shimada M, Cross JR, Zhao Y, Roeder RG, Allis CD. Intracellular crotonyl-CoA stimulates transcription through p300-catalyzed histone crotonylation. Mol Cell. 2015; 58:203–15. https://doi.org/10.1016/j. molcel.2015.02.029.
25. Mashimo T, Pichumani K, Vemireddy V, Hatanpaa KJ, Singh DK, Sirasanagandla S, Nannepaga S, Piccirillo SG, Kovacs Z, Foong C, Huang Z, Barnett S, Mickey BE, et al. Acetate is a bioenergetic substrate for human glioblastoma and brain metastases. Cell. 2014; 159:1603–14. https://doi. org/10.1016/j.cell.2014.11.025.
26. Comerford SA, Huang Z, Du X, Wang Y, Cai L, Witkiewicz AK, Walters H, Tantawy MN, Fu A, Manning HC, Horton JD, Hammer RE, McKnight SL, et al. Acetate dependence of tumors. Cell. 2014; 159:1591–602. https://doi.org/10.1016/j.cell.2014.11.020.
27. Pietrocola F, Galluzzi L, Bravo-San Pedro JM, Madeo F, Kroemer G. Acetyl coenzyme A: a central metabolite and second messenger. Cell Metab. 2015; 21:805–21. https:// doi.org/10.1016/j.cmet.2015.05.014.
28. Fernandis AZ, Wenk MR. Lipid-based biomarkers for cancer. J Chromatogr B Analyt Technol Biomed Life Sci. 2009; 877:2830–5. https://doi.org/10.1016/j. jchromb.2009.06.015.
29. Del Boccio P, Raimondo F, Pieragostino D, Morosi L, Cozzi G, Sacchetta P, Magni F, Pitto M, Urbani A. A hyphenated microLC-Q-TOF-MS platform for exosomal lipidomics investigations: application to RCC urinary exosomes. Electrophoresis. 2012; 33:689–96. https://doi. org/10.1002/elps.201100375.
30. Wang C, Wang M, Han X. Applications of mass spectrometry for cellular lipid analysis. Mol Biosyst. 2015; 11:698–713. https://doi.org/10.1039/c4mb00586d. 31. Kunjachan S, Rychlik B, Storm G, Kiessling F, Lammers T.
Multidrug resistance: Physiological principles and nanomedical solutions. Adv Drug Deliv Rev. 2013; 65:1852–65. https://doi.org/10.1016/j.addr.2013.09.018. 32. Bestard-Escalas J, Garate J, Maimo-Barcelo A,
Fernandez R, Lopez DH, Lage S, Reigada R, Khorrami S, Ginard D, Reyes J, Amengual I, Fernandez JA, Barcelo-Coblijn G. Lipid fi ngerprint image accurately conveys human colon cell pathophysiologic state: A solid candidate as biomarker. Biochim Biophys Acta. 2016; 1861:1942–50. https://doi.org/10.1016/j.bbalip.2016.09.013.
33. Perrotti F, Rosa C, Cicalini I, Sacchetta P, Del Boccio P, Genovesi D, Pieragostino D. Advances in Lipidomics for Cancer Biomarkers Discovery. Int J Mol Sci. 2016; 17. https://doi.org/10.3390/ijms17121992.
34. Zhou X, Mao J, Ai J, Deng Y, Roth MR, Pound C, Henegar J, Welti R, Bigler SA. Identifi cation of plasma lipid biomarkers for prostate cancer by lipidomics and bioinformatics. PLoS One. 2012; 7:e48889. https://doi. org/10.1371/journal.pone.0048889.
35. Sterin M, Cohen JS, Ringel I. Hormone sensitivity is refl ected in the phospholipid profi les of breast cancer cell lines. Breast Cancer Res Treat. 2004; 87:1–11. https://doi. org/10.1023/B:BREA.0000041572.07837.ec.
36. Lingwood D, Simons K. Lipid rafts as a membrane-organizing principle. Science. 2010; 327:46–50. https://doi. org/10.1126/science.1174621.
37. Mollinedo F, Gajate C. Lipid rafts as major platforms for signaling regulation in cancer. Adv Biol Regul. 2015; 57:130–46. https://doi.org/10.1016/j.jbior.2014.10.003. 38. Montero J, Morales A, Llacuna L, Lluis JM, Terrones O,
Basanez G, Antonsson B, Prieto J, Garcia-Ruiz C, Colell A, Fernandez-Checa JC. Mitochondrial cholesterol contributes to chemotherapy resistance in hepatocellular carcinoma. Cancer Res. 2008; 68:5246–56. https://doi. org/10.1158/0008-5472.CAN-07-6161.
39. Lucken-Ardjomande S, Montessuit S, Martinou JC. Bax activation and stress-induced apoptosis delayed by the accumulation of cholesterol in mitochondrial membranes. Cell Death Differ. 2008; 15:484–93. https://doi.org/10.1038/ sj.cdd.4402280.
40. Ogretmen B, Hannun YA. Biologically active sphingolipids in cancer pathogenesis and treatment. Nat Rev Cancer. 2004; 4:604–16. https://doi.org/10.1038/nrc1411.
41. Volinsky R, Kinnunen PK. Oxidized phosphatidylcholines in membrane-level cellular signaling: from biophysics
to physiology and molecular pathology. FEBS J. 2013; 280:2806–16. https://doi.org/10.1111/febs.12247.
42. Monteiro-Cardoso VF, Silva AM, Oliveira MM, Peixoto F, Videira RA. Membrane lipid profi le alterations are associated with the metabolic adaptation of the Caco-2 cells to aglycemic nutritional condition. J Bioenerg Biomembr. 2014; 46:45–57. https://doi.org/10.1007/ s10863-013-9531-y.
43. Jones DR, Divecha N. Linking lipids to chromatin. Curr Opin Genet Dev. 2004; 14:196–202. https://doi. org/10.1016/j.gde.2004.02.003.
44. Doria ML, Cotrim Z, Macedo B, Simoes C, Domingues P, Helguero L, Domingues MR. Lipidomic approach to identify patterns in phospholipid profi les and defi ne class differences in mammary epithelial and breast cancer cells. Breast Cancer Res Treat. 2012; 133:635–48. https://doi. org/10.1007/s10549-011-1823-5.
45. Dill AL, Ifa DR, Manicke NE, Costa AB, Ramos-Vara JA, Knapp DW, Cooks RG. Lipid profi les of canine invasive transitional cell carcinoma of the urinary bladder and adjacent normal tissue by desorption electrospray ionization imaging mass spectrometry. Anal Chem. 2009; 81:8758–64. https://doi.org/10.1021/ac901028b.
46. Ruiz-Canela M, Bes-Rastrollo M, Martinez-Gonzalez MA. The Role of Dietary Infl ammatory Index in Cardiovascular Disease, Metabolic Syndrome and Mortality. Int J Mol Sci. 2016; 17. https://doi.org/10.3390/ijms17081265.
47. Guan F, Handa K, Hakomori SI. Specifi c glycosphingolipids mediate epithelial-to-mesenchymal transition of human and mouse epithelial cell lines. Proc Natl Acad Sci U S A. 2009; 106:7461–6. https://doi.org/10.1073/pnas.0902368106. 48. Wang H, Isaji T, Satoh M, Li D, Arai Y, Gu J. Antitumor
effects of exogenous ganglioside GM3 on bladder cancer in an orthotopic cancer model. Urology. 2013; 81:210 e11-5. https://doi.org/10.1016/j.urology.2012.08.015.
49. Hakomori SI, Handa K. GM3 and cancer. Glycoconj J. 2015; 32:1–8. https://doi.org/10.1007/s10719-014-9572-4. 50. Matyash V, Liebisch G, Kurzchalia TV, Shevchenko A,
Schwudke D. Lipid extraction by methyl-tert-butyl ether for high-throughput lipidomics. J Lipid Res. 2008; 49:1137–46. https://doi.org/10.1194/jlr.D700041-JLR200.
51. Lee DY, Kind T, Yoon YR, Fiehn O, Liu KH. Comparative evaluation of extraction methods for simultaneous mass-spectrometric analysis of complex lipids and primary metabolites from human blood plasma. Anal Bioanal Chem. 2014; 406:7275–86. https://doi.org/10.1007/s00216-014-8124-x.
52. Tsugawa H, Cajka T, Kind T, Ma Y, Higgins B, Ikeda K, Kanazawa M, VanderGheynst J, Fiehn O, Arita M. MS-DIAL: data-independent MS/MS deconvolution for comprehensive metabolome analysis. Nat Methods. 2015; 12:523–6. https://doi.org/10.1038/nmeth.3393.
53. Storey JD. A direct approach to false discovery rates. Journal of the Royal Statistical Society. 2002; 64:479–98.