Network Intrusion Analysis using Clementine
Muhammad Iqbal
SIST, Southwest Jiaotong University, Chengdu, 610031,
PR China
ABSTRACT
Data mining is an extensive branch of computer science which garnered enormous interest from both academic and industry circles in the last decade. In this work, I would like to present our understanding of data mining under CRISP-DM framework and the use of data mining tool called Clementine, which is widely used in the industry. This paper is basically focuses on using Clementine software to detect anomalies such as odd access time of the machines inside the network from the external machines used in the DARPA simulation by analyzing the tcpdump list file.
General Terms
Data Mining, Detection Systems
Keywords
Clementine, CRISP-DM framework
1.
INTRODUCTION
Technological development lead to the creation of enormous data which lies stored in different storage media. This enormous amount of data is basically of no use unless one can derive meaningful information which is relevant to the user. Data mining is a branch of sciences that is basically created for the purpose of analyzing data and provides a meaningful insight into the data which can help the user to make an informed decision. But due to variations of individual needs and knowhow the development of data mining is more of an ad-hoc nature than a standardized one. The three “veterans” of the data mining market DaimlerChrysler, SPSS and NCR in late 1996 conceived the idea of creating a standard process model which is free and non-proprietary and can lead practitioners all over the world to a standardized form[1].This lead to the creation of Cross-Industry Standard Process for Data Mining(CRISP-DM).
Data mining is universally accepted concept and it’s exploited by many organizations to gain competitive advantage. Many of the predictive tools are available and used by many companies and Governments to understand the nature of the problem and better address them. Data mining tools automate the exhaustive search on very large databases or data warehouses and can accurately model complex relationships and/or interactions and then based on these models they can make more robust predictions of future[3].
Data mining is not about connecting the dots it’s about predicting the trends or patterns of the market/people/community[3]. A proactive strategy can help people or companies or Governments to better handle a situation then a reactive one. This is possible because of the predictive analytical ability of the data mining tools. For instance however volatile a market such as a share market is, still it has a hidden pattern which data mining can effectively find and model them so that it can be used to predict the
behavior of similar markets in the future, thus enabling us to be more proactive rather than reactive in our strategy. The above example can be used not only in markets but also in every aspect of interactions.
Clementine, data mining software created by SPSS Inc in 1994 supports CRISP-DM with clearly outlined steps from business understanding to the deployment. It is widely used in the industry for data mining tasks as it leverages the technological development at SPSS from 1994 way ahead of the creation of CRISP-DM[1].The rest of the paper is structured around the CRISP-DM model and how to perform data mining on network intrusion detection using Clementine software.
2.
BUSINESS UNDERSTANDING
For any business today the most important element is data and in order to prevent its access from unauthorized people the researchers have developed two types of techniques which are known as cryptographic techniques (CT) and Intrusion Detection Systems (IDS) [16]. Data mining is widely applied in network intrusion detections to prevent unauthorized access of confidential data/resources. Most of the vital information is stored on computers and any kind of intrusion can be quite expensive in terms of loss of intellectual property or compromise of privacy.
Figure 1: Classification of detection Systems
Network intrusion detection systems are basically classified as signature based (also known as misuse detection) and anomaly based. A signature based detector examines the network traffic for known attacks based on rules written by security experts. IDIOT [17], STAT [18] and SNORT [4], is a typical example of signature based detector. The main drawback of signature based detection systems is that they can’t detect new attacks. Every time a new attack is identified experts need to write new rules and distribute them. Anomaly based detections systems such as IDES[19], ADAM[5],NETAD[6] model normal traffic based on IP addresses and ports. Any deviation from this normal distribution is regarded as an anomaly but can also lead to more false positives as normal user behavior may deviate from the normal distribution.
Detection
Systems
Signature
Based
The DARPA Intrusion Detection Evaluation was created by the Information Systems Technology Group (IST) of MIT Lincoln Laboratory, under the Defense Advanced Research Projects Agency (DARPA ITO) and Air Force Research Laboratory (AFRL/ SNHS) sponsorship. The main aim of study is to find the strength and weaknesses of the existing approaches at that time and lead to large performance improvements i.e., less false alarms and valid assessments of intrusion detection systems.
Lincoln Laboratory generated sniffing and audit data offline and test systems on a large variety of normal traffic and attacks. Rome Laboratory evaluates in real time and can test the portability and latency characteristics of the intrusion detection systems.
The approach used in corpus generation was to synthesize normal and attack traffic on a private network so that no private information is released. The private network is divided into inside and outside components separated by a router [Figure 2]. The inside component includes machines of the victims and a gateway to many other inside workstations. The outside component consists of two workstation stimulates gateways to a virtual outside internet. One gateway leads to roughly 100 workstations and the other leads to 1000 websites whose content is updated daily.Data is collected from the inside victim running Solaris and from an outside sniffer.
Figure 2- Inside and Outside Component of DARPA evaluation[7]
The training data consists of twenty attack types including denial of service attacks, remote to local, local to remote, and surveillance or probing attacks. Many more attack types are present in the test data. The attacks in the test data are made stealthy in many ways so that the test data is more realistic. The main purpose of DARPA evaluation is to decrease the rate of false positives and increase the detection rates significantly and create advanced technologies incorporating these ideas. It focuses on the evaluation of current systems and enhancement of their detection rates significantly. The data set is prepared adequately to accommodate 128 attack types and privacy of users is taken in to consideration.
The data mining goals for this evaluation is to increase the detection rate of known attacks as well us novel attacks and known attacks with stealth nature. The participants may decide which groups or groups of threats their model focus on. The success of any model depends on its ability to detect a
3.
DATA UNDERSTANDING
DARPA dataset consists of data collected over a period of 9 weeks and the data contains over 300 attacks. All the 300 attacks are drawn from a pool of 32 different attack types and 7 different attack scenarios[11].
Data in DARPA evaluation is collected in three possible ways[11]. Firstly the network traffic was sniffed using a machine running tcpdump[8]. Secondly a system level audit details collected at operating system level but this data is often limited due to failed logging or system crashes. So the no of records in the TCP dump file is sometimes way above the records founds in the audit data. Audit data is collected by using Basic Security Module (BSM) [10] from a victim running a Solaris system. Thirdly, data about the file system state is collected daily for each machine used in the simulation. Any abnormal usage of any file can often be regarded as an attack. The three kinds of data is written to a CD and distributed to all the participants of the evaluation in 1998.
For this paper we used the tcp dump list of the second weeks data downloaded from the MIT DARPA website[15]as our training dataset.
This data is collected by a tcpdump packet sniffer and it contains the contents of every packet transmitted between computers inside and outside a simulated military base. The “listfile”, an ASCII file with white spaces separating the fields, of the tcpdump data contains the fields as described in the following table[Table 1]. The data available in the listfile gives a basic idea about the tcp packet data but may not be sufficient for identifying the attack. But for our research this data set is sufficient as it contains the information such as “start time” which is essential for finding the abnormal access of the system at odd times.
The data available in the “listfile”for each day is enormous i.e., approximately around 2k thousand records or more, thus enabling Clementine to make better predictions. But the downside of this is it takes considerable amount of processing time. From the first look of the dataset the data set looks pretty good as it does not have any missing values or inconsistent data values.
As the data is available in a text file we can import the data in to Clementine by using the “var” node and specify the location of the file. Through one day effort we have collected 133781 records while each record consists of 11 fields.
Table 1: Contents of the “listfile”, an ASCII file with white spaces separating the fields
Field Name Description
Session ID A positive integer Start Date Format: MM/DD/YYYY Start Time Format: HH:MM:SS Session Duration Format: HH:MM:SS
Service Identifier A string representing the service type(TCP,UDP, ICMP). If the service ends with /u it’s UDP, /i its ICMP otherwise it’s TCP.
Source Port A positive Integer Destination Port A positive Integer
Attack Score 0/1 : 0 indicates no attack and 1 indicates an attack
Attack Name A string (e.g. “anomaly”, “portsweep”…etc) or
“-“indicating no attack.
The quality of the data available is quite good enough but found several problems. Clementine is not able to capture the data after few thousand records. The rate of “$null$” values increased enormously which indicates that we need to perform the entry of the records manually which is time consuming as the record size is enormous. This is going to restrict us from performing a good analysis on the data. As we are interested in finding anomaly in access time it may not significantly affect our analysis as the first five fields are not affected. But this may create some problem for advanced intrusion detection as every field is important and one needs to deal with the null values. Clementine provides novel ways to handle missing values or null values.
Procedure 1: Procedure in Clementine.
1. Create a new Stream by selecting “File – New Stream”
2. From the Source nodes palette insert a Var. File node by double clicking the “Var. File “icon.
3. Double Click on the “Var. File” node to enter into edit mode. This opens a dialog box.
4. In the File specify the location of the file by clicking on the ellipses button at the end and select the file.
5. Deselect the option “Read Field Names from File”, as the file does not contain the field names.
6. In the “Delimiters” section select “Space”, “Newline” and “Allow Multiple blank delimiters. Deselect the
“
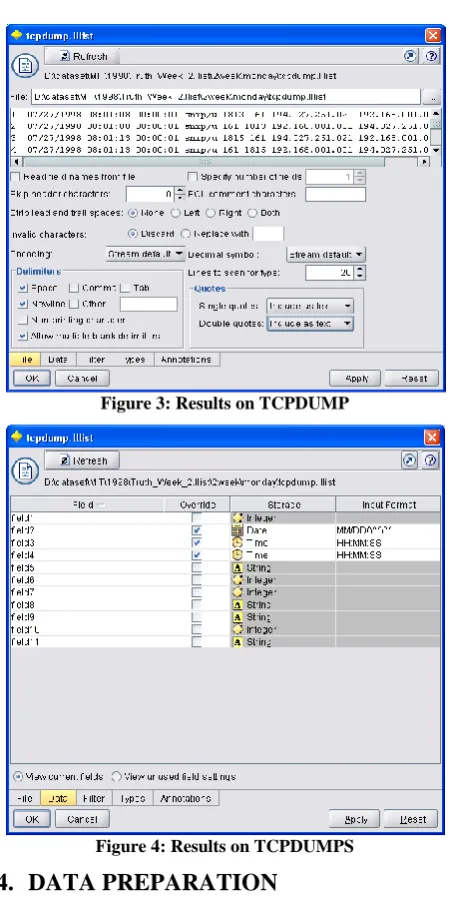
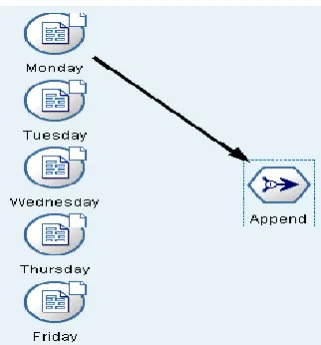
Comma” option. This allows proper interpretation of the values by Clementine.7. Click on the “data” tab to override certain fields for proper capture of data. Override the “field 2” and change the storage to “Date” and Input format to “MM/DD/YYYY”. For “field3” and “field4” change the Storage to “Time” and Input Format to “HH:MM:SS”
8. Click “OK” to close the edit button.
9. To check if the above process is successful select the “var. file” node which is now named as “tcpdump.list” and insert a “Table” Node from the Output palette by double clicking the “Table” icon.
Note: Delete the table node after understanding the data and repeat the step 1 to 8 for remaining days of the second week. This may consume significant processing time and delay in generating the results in future data mining tasks.
10. Right-click on the “Var. file” node and enable the “Cache” option. This could enhance the performance of Clementine in the analysis stage.
Figure 3: Results on TCPDUMP
Figure 4: Results on TCPDUMPS
4.
DATA PREPARATION
The most time consuming process in data mining is the data preparation part. On an average it consumes 70% of the project time and effort. The outcome of this stage depends on the correctness of the business understanding and the data understanding.
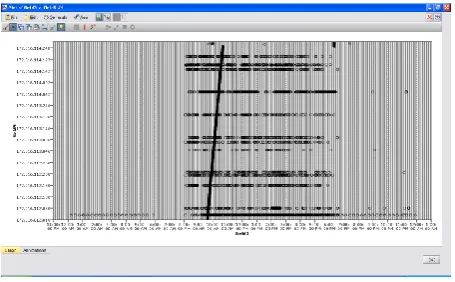
Figure 5: Multiple sources append stream screen shot
From the Monday’s tcp list we need to select only those records which correspond to the incoming traffic rather than outgoing traffic because our analysis focus on knowing the odd time access of your internal systems from the external network. To perform this job we need to use the “Select” node available in the “Records Ops” palette. Once the select node is inserted into the stream we can double-click to enter the criteria for the
selection of records i.e.,
isstartstring("172.016",field9)=1[Figure 6]. The above selection criteria selects only those records that start with an IP address of 172.016.*.* in the destination IP field (i.e., field9) from the list of all available records. As we are interested in knowing who accessed the inside systems at odd times we don’t need the records pertaining to the external access from the systems inside the network. This method significantly reduces the record number thus enabling us to perform the analysis faster. On Monday data alone the reduction of records is 81%, indicating that only 19% of records are left for processing future. (Before: 133781 records. After: 25353 records)
Procedure 2: Procedure in Clementine.
1. Select the “Monday” node on the stream canvas and double-click on the
“
Append” node in the “Record Ops” palette.2. Select the “Append” node on the stream canvas and double-click on the “Select” node in the “Record Ops” palette.
3. Double click the “Select” node on the stream canvas and enter the following text “isstartstring("172.016",field9)=1” without quotes as shown in the below figure.
Figure 6 Screen shot of the select node to select only the records with Destination IP (i.e., Field 9) starting with
“172.016”
Once the records are selected the next step in data preparation is the selection of attributes for the data mining process.The attributes required for our research are Start Time (i.e., field3 having out direction), Session duration (i.e., field4 having in direction) and Destination IP (i.e., field9 having in direction). This can be done in Clementine using the “type” node in “Field Ops” palette. [Procedure 3]
Procedure 3: Procedure in Clementine.
1. Select the “select” node on the stream canvas and double-click on the “Type” node in the “Field Ops” palette.
2. Double-click on the “Type” node and set the settings as described above. [Figure 7]
3. Select the “Type” node and double-click the “Filter” node in the “Field Ops” palette.
4. Double-click on the “Filter” node on the stream canvas and select only Field 3, Field 4 and Field 9. [Figure 8] and click ok.
Figure 8: Screen Shot to Filter the Attributes Required for Analysis
Once the attributes are selected the next step in data preparation is to clean the data. Clementine allows us to do this by using the Record and Field operation nodes. The cleaning can be done for missing data, data errors, coding inconsistencies, missing or bad Meta data. But some of them can be done in Clementine but others need manual examination. In our research we need not perform any cleaning as our fields are ok.
Before we continue to modeling we can perform an audit on our data set to get a comprehensive idea of our data. This is often termed as exploration and can help one to find outliers or extreme values or missing values and also enables us to treat those problems.
Procedure 4: Procedure in Clementine.
1. Select the “Filter” Node in the stream canvas and double click the “Data Audit” Node in the “Output” palette.
2. For further customization you can change the settings by editing the “Data Audit” icon. In our case it’s having a name “3 fields” as we are using only 3 fields for our research. In our research we prefer to use the standard settings so we don’t change anything.
3. Select the “3 fields” node on the canvas and execute it by clicking the execute button. A result window shows the result of our data exploration. [Figure 9]
4. Double click on the first sample graph to get a clear picture of our data. [Figure 10]
5. Select the “3 fields” node on the canvas and double-click on the “Plot” node on the “Graphs” palette. This inserts a graph on the stream canvas.
6. Double-click on the “Plot” icon and in the plot tab select “Field3” as X field and “Field 9” as Y Field. And Click the execute button.
Figure 9: Screen shot of data exploration in Clementine
Figure 10: Screen shot of Sample graph of field3
From our data exploration we can see that a few of the connections to the systems inside the network are accessed at odd time. From the plot we can also observe that some performed a scan on the systems which is evident from the vertical line on the graph. But as we have excluded the Source IP address in our research we can’t tell for sure if it is having any malicious intent or not.[Figure 11]
5.
MODELING
From our data exploration we can see that a few of the internal systems were accessed at odd times and this actually is sufficient to say that we are quite successful in identifying them. But creating a model to prove our claim is not successful due to lack of domain knowledge and time constraints
6.
EVALUATION
We performed the above procedure mentioned on different day’s tcpdump and pretty much found similar results. But this research does not really create any credible model for network intrusion detection.
7.
CONCLUSION
For the last two decades the attacks made on computer networks have risen significantly. The major reason behind this is the vast usage of internet and its exponential growth. Networks interruptions could be caused intentionally due to multiple reason s through inside and outside attacks.
Here it is important to note, this is an ad-hoc research work and can’t be applied in real time applications but this work will help researchers to use Clementine for advanced data mining. Network Intrusion detection is a vast and resource sensitive research area which changes in real time. As a result of our work, the network intrusion analysis can be done through clementine so that the systems can be configured such that attacks can be thwarted more easily.
8.
ACKNOWLEDGMENTS
I am using this opportunity to express my gratitude to my professor Dr.Zhu Yan , who supported me throughout the research. I am thankful for her aspiring guidance, invaluably constructive criticism and friendly advice during the this work.
9.
REFERENCES
[1] Pete Chapman, Julian Clinton, Randy Kerber, Thomas Khabaza, Thomas Reinartz, Colin Shearer, and Rudiger Wirth. CRISP-DM 1.0 -- Step-by-step data mining guide. The CRISPDM Consortium / SPSS Inc., available on http: //www.crisp-dm.org, 2000
[2] Clementine 12.0, SPSS Inc, 233 South Wacker Drive, 11th Floor, Chicago, IL 60606-6307, USA http://www.spss.com
[3] Data Mining and Predictive Analytics:Battlespace Awareness for the War on Terrorism, Colleen McCue, Ph.D.
[4] Roesch, Martin, "Snort - Lightweight Intrusion Detection for Networks", Proc. USENIX Lisa '99, Seattle: Nov. 7-12,1999.
[5] Sekar, R., M. Bendre, D. Dhurjati, P. Bollineni, "A FastAutomaton-based Method for Detecting Anomalous ProgramBehaviors".Proceedings of the 2001 IEEE Symposium onSecurity and Privacy.
[6] Matthew V. Mahoney, “Network Traffic Anomaly Detection Based on Packet Bytes" SAC 2003, Melbourne, Florida, USA,© 2003 ACM 1-58113-624-2/03/03...$5.00
[7] Lincoln Laboratory,MIT, "Introduction to evaluation," http://www.ll.mit.edu/mission/communications/ist/files/L Lab-1-Intro.ppt ,1998.
[8] Ko, C., M. Ruschitzka, and K. Levitt. “Execution Monitoring of Security-Critical Programs in aDistributed System: A Specifications-Based Approach,” In Proceedings 1997 IEEE Symposium on Security and Privacy, pp. 134-144, Oakland, CA: IEEE Computer Society Press.
[9] Anderson, "Homogeneous models," in Proceedings of the USENIX Security Conference, Oct. 1999.
[10]Sun Microsystems Security Bulletin: #00140. http://sunsolve.Sun.com/pub-cgi/us/sec2html?secbull/140. 14 May, 1997.
[11]Kristopher Kendall,”A Database of Computer Attacks for the Evaluation ofIntrusion Detection Systems”. PHD Thesis, Massachusetts Institute of Technology, June. 2000.
[12]Honghua Dai, "A Case Study of Classification Reliability," in Proceedings of the International Conference of Data Mining Workshops, 2008.
[13] Eric, Alan D, William, Clement, Lisa and Jonathan Tivel, “Data Mining for Network Instrusion Detection: How to Get Started” The MITRE Corporation
[14]German Florez, Susan M. Bridges and Rayford B. Vaughn, “ An Improved Algorithm for Fuzzy Data Mining for Intrusion Detection”, 2002
[15]MIT,
http://www.ll.mit.edu/mission/communications/ist/corpora /ideval/data/1998data.html
[16] Hichem Sedjelmaci#, Sidi Mohammed Senouci*, Mohammed Feham, 2012 International Conference on Systems and Informatics (ICSAI 2012), 978-1-4673-2713 ©2012 IEEE pp 857-861
[17]S.Kumar, E.H.Spafford, ”A Software architecture to support misuse intrusion detection”, roceedings of the 18th National Information Security Conference, pp.194-204, 1995.
[18]K.Ilgun, R.A.Kemmerer, P.A.Porras, ”State transition analysis:A rule-based intrusion detection approach”, IEEE Transactions on Software Engineering, vol.21, no.3, pp.181-199, 1995.
![Figure 2- Inside and Outside Component of DARPA evaluation[7]](https://thumb-us.123doks.com/thumbv2/123dok_us/1313540.1639049/2.595.306.549.603.766/figure-inside-outside-component-darpa-evaluation.webp)