IJSRSET1841024 | Received : 06 Sep 2018 | Accepted : 21Sep 2018 | September-October-2018 [ 4 (10) : 66-76]
Themed Section : Engineering and Technology
66
Job Performance and Job Satisfaction of Female Faculties in Technical
Educational Institution Based on Job Profile and Employer Commitment with
Special Reference to Dakshina Kananda District
Veena Santhosh Rai
Research Scholar & Assistant Professor, Department of MBA, Srinivas Institute of technology, Valachil, Mangalore, Karnataka, India
ABSTRACT
The current study aims to “Job Performance and Job Satisfaction of Female Faculties in Technical Educational Institution Based on Job Profile and Employer Commitment with Special Reference to Dakshina Kananda District.The sample consisted of 615 females from 11 engineering colleges affiliated to Visvesvaraya Technological University (VTU)from five Taluks of Dakshina Kannada District. Descriptive statistics such as Mean, and SD was used to understand the Organizational role, Job performance, Employer Commitment and job satisfaction for which female faculty in engineering colleges have the highest and lowest scores. Percentage distribution of respondents According to Organizational role, Job performance, Employer Commitment and job satisfaction. Kruskal Wallis test on job profile and demographical variables and job performance was done. Mann Whitney U test fro Demographical variables and job performance. Regression Coefficients was done for employer commitment. Results indicate that Majority of the respondents were actively involved in their role in the organization, their job performance meets the expectation and employers are committed towards their employees. Majority of them were highly satisfied with their job. The study reveals that the difference in the job performance of respondents with different education qualification. and Designation was significant. There was highly significant difference in Job performance of respondents with different Salary scale (χ2 =26.785, p=.000). Whereas no significant difference was observed in job performance for other job profile variables. The current study gives us an insight into the challenges faced by faculty in engineering colleges and can further be used as a frame work to develop strategies to improve the quality of engineering education.
Keywords : Employer Commitment, Job Satisfaction, Job Performance, Job profile Technical Education, Female Faculties, Job Profile, Demographical Variables
I.
INTRODUCTIONTechnical Education is a skilful, artful and a constructive education. It plays a vital role in human resource development of the country by creating skilled manpower, enhancing Industrial productivity and improving the quality of life. Faculties of Technical Educational Institution play an important role in shaping the behaviour of students and to develop their intelligence and attitude to deal with the unseen complexities of life and quality education
teaching. Organizational structural & procedural characteristics are supported by many researches as a considerable source of stress (Hardie 1996 Ramage 2001),
Workplace stress differs from person to person. It can depend on personality type and how individual respond to pressure. Many researches were conducted on the sources of stress in teaching professions also found that workload contributes a significant part in producing stress (Dewe, 1986; Manthei and Solman, 1988). Teacher stress is a specific type of occupational stress. It is “the experience by a teacher of unpleasant emotions such as tension, frustration, anger and depression resulting from aspects of his or her work as a teacher” (Kyriacou, 1987).An attempt is here by made to see the impact of Job Profile and employer commitment on job performance leading to job satisfaction female faculties in technical educational institution.
II.
Review of LiteratureStudies indicate that job satisfaction and job performance among teachers is dependent on several factors including the Job profile working environment in the institution, employer commitment to make employee happy ,the policies of the organisation, pay and fringe benefits available for the teachers, advancement opportunities, the relationship of the faculty with the administrative staff, co-workers, students and their parents, and the feedback the faculty get from their seniors, co-workers and students. However, studies on impact of employer commitment on job satisfaction and job performance is limited stress and coping strategies employed by engineering faculty are limited.
Hyman and Jeff (2003) in their study found that organisational pressures, combined with lack of work centrality, result in work intruding into non-work areas of employee lives, through intrusions manifest themselves in different ways according to type of
work, levels of worker autonomy and organisational support.
Nolan, M. (2009) in his study, Top Ten Sources of Workplace Stress and How to Fight Them.Data was collected by 80 employees the source of stress among employees was due to lack of appreciation. If efforts are underappreciated, their level of dissatisfaction and stress raises. Another factor that contributes to stress is when individuals feel like they lack control over their role within the organization or the result of their efforts in the workplace.
Sallie Gardner (2010) identified that stress has the adverse impact on the individuals, the profession and the education system. He concludes that a holistic approach and preventive stress management programs provided within tertiary education is needed to the teachers to address the stress related issue.
Hyman and Jeff (2003) in their study found that organisational pressures, combined with lack of work centrality, result in work intruding into non-work areas of employee lives, through intrusions manifest themselves in different ways according to type of work, levels of worker autonomy and organisational support.
III.
Objective1. To analyse the difference in the job performance of respondents across various job profile
2. To determine the relationship between employer’s commitment and job satisfaction and job performance
3. Research Design
The current study is exploratory in nature. Survey research method has been adapted to conduct the study. Specific questionnaire has been designed for collection of data from female faculties having e more than three years of experience in teaching in technical educational institutions established for more than ten years, affiliated to Visvesvaraya Technological University.
4. Sampling
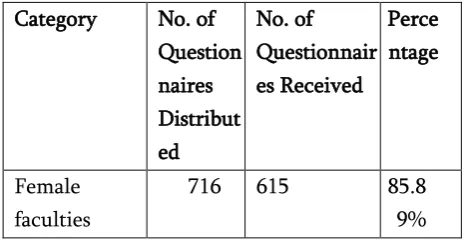
Purposive sampling technique was used to select Engineering colleges. A total of 716 female faculties were selected 11 engineering colleges of 5 different Taluks under Dakshina Kannada has been considered for the study. The table below shows the sample distribution :
5. Inclusion Criteria
Table 1. Distribution of the questionnaire
Category No. of Question naires Distribut ed
No. of Questionnair es Received
Perce ntage
Female faculties
716 615 85.8 9%
Female faculties who have completed three years of teaching experience in technical educational Institution in Dakshian kananda district
Colleges affiliated with Visvesvaraya Technological University (VTU) with inDakshina kannada District will be included.
All colleges had been established for more than 10 years. Faculties who voluntarily participated in the study will be included.
Women, who were both married and unmarried, are considered for the study.6. Exclusion Criteria
Male faculties working in technical educational institution were not included in the study.
Non-teaching female faculties in technical educational institution were not included for the study
Female faculties with less than three years of teaching experience were not selected for the study7. Variables Independent variables
Independent variables of the present study are the demographical variables, (age, marital status spouse employment, family type), Job profile variable (education qualification, Specilization, year of work experience, Salary, Mode of transport), Organizational role and employer commitment
Dependent Variable
The dependent variables of the present study are Job performance, job satisfaction, and other job-related issues.
8. Assessment techniques
instructed very clearly about the pattern of answering the questionnaire. They were given enough time to answer all the statements
Table 2. Percentage distribution of Respondents According to Organization role, Job Performance,
Employer Commitment and Job Satisfaction
Components Number of Respondents
Percentage
Organizationa l Role
0-3 103 16.75
4-6 512 83.25
Job
performance
7-16 40 6.5
17-25 323 52.52
26-35 252 40.98
Employer Commitment
7-16 30 4.88
17-25 203 33.01
26-35 382 62.11
Job
Satisfaction
10-23 37 6.01
24-36 262 42.60
37-50 316 51.38
N=615
In the above table the total score obtained in organizational role was divided into two equal categories 0-3 and 4-6. Majority of the respondents (83.25%) were actively involved in their role in the organization. Score obtained in job performance was categorized into three equal parts,7-16,17-25 and 26-35. Highest percentage (52.52%) obtained a score between 17 to 25 and have the opinion that their job performance meets the expectation. In employer commitment scale the scores were categorized into three equal parts,7-16,17-25 and 26-35. Highest percentage (62.11%) obtained a score between 26 to 35 and have the opinion that their employers are committed towards their employees. Job satisfaction scores were divided into three equal categories,10-23,24-36 and 37-50. Half of the respondents (51.38%) obtained a score between 37 to 50 were highly satisfied with their job.
Table 3. Descriptive Statistics for Organizational Role, Job Performance, Employer Commitment and Job Satisfaction
Factors MaxiScore Mean S D Mean%
Organization Role 6 4.852 1.276 80.87
Job Performance 35 24.382 5.451 69.67
Employer Commitment 35 26.197 5.207 74.84
In Table No 4.44, the mean score for organizational role is 4.852 with standard deviation 1.276, which is 80.887%of the maximum score, whereas the mean score in job performance is 24.382 with standard deviation 5.451, and mean percentage 69.67%. Mean score in employer commitment is 26.197with standard deviation 5.207, which is 74.84%of the maximum score. The mean score for Job Satisfaction is 36.145 with standard deviation 7.230, with mean percentage 80.32%.
H10: There is no significant difference in the job performance of respondents across the job profile such as Education qualification, Designation, Area of
Specialization, Total years of experience, Length of service in the present institution. Salary and Mode of transport and work load per week.
H11: There is significant difference in the job performance of respondents across the job profile such as Education qualification, Designation, Area of Specialization, Total years of experience, Length of service in the present institution. Salary and Mode of transport and work load per week.
The above hypothesis was tested using Kruskal – Wallis test
Table 4. Kruskal –Wallis test on Job Profile and Job performance
Job Profile Chi-square df p-Value Significance
Edu Qualification 15.138 2 .001 S
Designation 5.009 1 .025 S
Area of Specialization 7.119 3 .068 NS
Total service in Years 3.622 3 .305 NS
Length of Service in the present Institution 3.389 3 .335 NS
Salary 26.785 3 .000 HS
Mode of Transport 4.848 3 .183
Work Load Per Week 1.601 3 .659 NS
Table no 4 reveals that the difference in the job performance of respondents with different education qualification ((χ2 =15.138, p=.001). and Designation (χ2 =5.009,p=.025)was significant .There was highly significant difference in Job performance of respondents with different Salary scale(χ2 =26.785,p=.000).Whereas no significant difference was observed in job performance for other job profile variables .
H20: There is no significant difference in the job performance of respondents according to age group and spouse employment.
H21: There is significant difference in the job performance of respondents according to age group and spouse employment
Table 5. Kruskal –Wallis test on Demographical Variable and Job Performance
Demographical Variable
Chi-square df p-Value Significance
Age Group 2.584 3 .460 NS
Spouse employment
4.546 3 .208 NS
Table No .5 show that there was no significant difference in job performance with respect to age group and spouse employment.
H30: There is no significant difference in the job performance of respondents according to Marital status and family type.
H31: There is significant difference in the job performance of respondents according to Marital status and family type.
The Above hypothesis was tested using Mann Whitney-U test (This test was done since there were only two categories in marital status and family type
Table 6. Mann Whitney –U Test for Demographic variable and Job Performance
Demographical variables
Mann Whitney – U
Z p-Value Significance
Marital Status 34429.5 0.560 0.575 NS
Family type 42059 0.177 0.860 NS
Table No.6 show that there was no significant difference in job performance with respect to marital status and family type
Relationship between Job performance, Employer commitment and Job Satisfaction
H40: There is no significant relationship between employer commitment and Job Satisfaction, employer commitment and Job performance, Job Satisfaction and Job performance.
H41: There is significant relationship between employer commitment and Job Satisfaction, employer commitment and Job performance, Job Satisfaction and Job performance.
Variables Correlation p , Significance
Employer Commitment v/s Job Satisfaction
Employer Commitment v/s Job Performance
0.297 0.000 HS
Job Satisfaction v/s Job performance
0.199 0.000 HS
The relationship between organization role and Qualities of job performance was found using Spearman’s Rank correlation, which was found to be significant. (r = 0.139, p=0.001). Karl Pearson coefficient was used to assess the relationship between employer commitment with the job satisfaction and the job performance. A significant correlation was found between employer commitment and job satisfaction (r=0.545, p=.000), employer commitment and job performance (r=0.297, p=.000).Also a significant correlation of (r=.199,p=.000) was observed between job satisfaction and job performance.
Regression Analysis of Employer Commitment and Job Satisfaction
H0 : Employer Commitment has no significant effect on Job satisfaction. H1 : Employer Commitment has significant effect on Job satisfaction.
The above hypothesis was tested using Regression analysis by taking employer commitment as the independent variable and Job satisfaction as the dependent variable.
Regression Coefficients
Model
Unstandardized Coefficients
Standardize d
Coefficient s
t Sig. B Std. Error Beta
1 (Constant) 16.308 1.255
.545
12.990 .000
Employer Commitment
.757 .047 16.109 .000
Model Summary
Mode l
R R Square
Adjusted R Square Std. Error of the Estimate
ANOVAb
Model Sum of Squares df Mean Square F Sig.
Regression Coefficients
Model
Unstandardized
Coefficients
Standardiz
ed
Coefficien
ts
t
Sig.
B
Std. Error
Beta
1
(Constant)
16.308
1.255
.545
12.990 .000
Employer
Commitment
.75
7
.047
16.109 .000
1
Regression
9545.05
4
1
9545.054
259.507
.000
aResidual
22547.0
66
613
36.782
Total
32092.1
20
614
a. Predictors: (Constant), Employer Commitment b. Dependent Variable: Job Satisfaction
The regression coefficient of Job satisfaction on Employer commitment is , Beta = 0.757, p < .001 with constant = 16.308, p < .001 . The R2 value is 0.297, which means that 29.7 percent of the variance in the dependent variable Job satisfaction is explained by the independent variable Employer commitment. The ANOVA table reveals that the model is a good fit.( F=259.507, p<0.001). This reveals that Employer commitment has a significant role on Job satisfaction.
IV. Findings
Majority of the respondents (83.25%) were actively involved in their role in the organization.
Highest percentage (52.52%) obtained a score between 17 to 25 and have the opinion that their job performance meets the expectation.
Highest percentage (62.11%) obtained a score between 26 to 35 and have the opinion that their employers are committed towards their employees.
Half of the respondents (51.38%) obtained a score between 37 to 50 were highly satisfied with their job.
The relationship between organization role and Qualities of job performance was found to be significant. (r = 0.139, p=0.001). A significant correlation was found between employer commitment and job satisfaction (r=0.545, p=.000), employer commitment and job performance (r=0.297, p=.000).
Also a significant correlation of (r=.199,p=.000) was observed between job satisfaction and job performance .
V.
Implications of the Study
The current study has provided an insight into the challenges faced by female faculty in technical educational institution in dakshina kannada district. Using this study other interesting factors that influence the performance of female faculty in engineneering collwgeds can be identifies.
For instance, the impact of low job satisfaction and high stress levels on the performance of female faculties can be studied
Studies conducted on engineering female faculty in India are limited. Therefore, similar studies can be conducted using a larger sample size.
Conducting a study using a larger sample size would enhance the reliability of the data, which can further be used by the All India Council of Technical Education to enhance the quality of engineering education in India. If sample size is large, the results can also be generalized.
The current study is an attempt to understand the Job performance and job satisfaction based on job profile and employer commitment. The data obtained from the study can be used to develop training, counselling and coaching model for faculty working in engineering colleges.
Training the faculty to develop appropriate strategies to deal with stress and job
dissatisfaction would help enhance the quality of teaching.
The study would help to give suggestion to institution and to enhance the employer commitment leading to significant improvement of job performance satisfaction among leading to effective teaching.
Results provided in the current study can be used to conduct a comparative study. Job satisfaction, employer commitment and job performance employed by female faculties in engineering faculty can be compared with faculty belonging to other disciplines. This would help understand the challenges exclusively faced by female engineering faculty. A comparative study will also help us know whether the factors effecting job satisfaction, employer commitment and job performance employed by female faculty vary with regard to the demographical variable.
The current study takes into consideration colleges affiliated to Visvesvaraya Technological University (VTU). In Dakshina Kannada district. Studies can be conducted on the challenges faced by female faculty working in private engineering colleges. A comparative study on the challenges faced by faculty working in colleges affiliated to Visvesvaraya Technological University (VTU) and faculty working in private engineering colleges can also be conducted.
VI. Limitations of the Study
The current study is a purely quantitative study. Although as a part of the pilot study, the researcher attempted to understand the issues and challenges faced by female faculty in engineering colleges. This helped the researcher to stream line the research design. An in-depth interview of selected participants, after the data collection, would have helped immensely in better understanding of the context.
The current study is exploratory. One of the main prerequisites of an exploratory study is having a large sample size. However, the current study consists of a comparatively small sample size (N=615). Lack of time and busy schedules of teachers made it difficult to have a larger sample size. Using a larger sample size would help gain an in depth understanding of the problem faced by engineering faculty.
One of the objectives of the current study is to understand impact of employer commitment job satisfaction, and job performance on female faculties in engineering collage with regard to selected demographic variables. However senior faculty members were unwilling to participate in the study. This made it difficult to compare the challenges faced by faculty regarding their age and experience level.
The questionnaires used in the study were too long. Several faculty members complied about the length of the questionnaire. This was one of the reasons as to why senior faculty were unwilling to participate in the study. Long questionnaires made the participants hesitant in answering them. The responses could be given out of boredom or in rush; hence they would have lower levels of accuracy.
VII.
CONCLUSIONThis study aims at finding out the job performance and job satisfaction of female faculties based on their
job profile and the employer commitment in technical educational institution in Dakshina Kannada district. There are very few study on the job performance of female faculties that too in Dakshina Kannda district ,Job performance and Job satisfaction of female faculties vary more compared to men as they have to balance their work life .This study infers on how the performance of job and job satisfaction varies depending on their job profile and the commitment of their employers .It also infers on how there is a significant relationship between various components .There are very few study on stress faced by faculties in engineering collage and the stress face by female faculties are more compared to men as they have to balance their work life .This study will infer on how the stress can be balance if an employer is commitment and the impact of the same on job performance and job satisfaction of the employees in relation to their job profile .It also infers on how stress is perceived by academicians in technical educational institution .As working in private engineering colleges has more pressure , profit-oriented and highly dependent to fees as source of funding. The study of contribution stress factor in terms of academician’s job responsibility is also a new topic yet to be discovered by any previous scholars; therefore, this study is prominent contribution to the knowledge in academic world nationally and internationally. Also, it is hope that this study has the value of replicability in near future; for adaptation and further exploration purposes in order to provide broader perspective on job performance and job satisfaction leading to more productive work and makes the faculties more effective and efficient in their work.
VIII.
REFERENCES[2]. Alan, H.S., Chan, Chen, K., Elaine, &Chong, Y.L. (2010). Work stress of teachers from primary secondary schools in Hong Kong, Proceedings of International Multiconference of Engineering and Computer Scientists
[3]. Allen, Douglas (1982), Occupational stress and perceived organizational effectiveness in formal group: An examination of stress level and stress type, Personnel psychology, Vol.35(2),PP.359-370.
[4]. AljonaShchuka (2010). Stress at work and stress management, bachelor’s thesis submitted to HAAGAHELA University of Applied Science [5]. Atif,A.,Rehman1,K.,Rehman,I., Khan,M. &
Humayoun,A.(2011)Impact of organizational commitment on job satisfaction and employee retention in pharmaceutical industry African Journal of Business Management, Vol. 5(17), 7316- 7324.
[6]. Bickford, M. (2005). Stress in the Workplace: A General Overview of the Causes, the Effects, and the Solutions. Canadian Mental Health Association Newfoundland and Labrador Division, 1-3.
[7]. Briner, R., Harris, C. & Daniels, K. (2004). How do work stress and coping work? Toward a fundamental theoretical reappraisal. British Journal of Guidance & Counselling, 32(2), 223-234.
[8]. Blau, G. & Boal, K. (1987).Using job involvement and organizational commitment interactively to predict turnover. Journal of Management, 15(1),115-127.
[9]. Bolon, D.S. (1997).Organizational Citizenship Behaviour Among Hospital Employees: A Multidimensional Analysis Involving job Satisfaction and Organizational Commitment. Hospital & Health Services Administration, 42(2), 221-241.
[10]. Buchanan, B. (1974). Building Organizational Commitment: The Socialization of Managers in Work Organizations. Administrative Science Quarterly, 19(4), 533-546.
[11]. Cohen, A., & Kirchmeyer, C. (1995). A multidimensional approach to the relation between organizational commitment and nonworking participation. Journal of Vocational Behaviour, 46(2), 189–202.
[12]. Cooper, C. L. &Dewe, P. J. (2004). Stress: A Brief Story Oxford: Blackwell
[13]. Faleel, S. F., Tam, C. L., Lee, T. H., Har, W. M. & Foo, W. C. (2012). Stress, Perceived Social Support, Coping Capabilities and Depression: A Study of Local and Foreign Students in Malaysia Context. World Academy of Science, Engineering and Technology, 61(13), 75
[14]. Gardner, Sallie, ( Dec 2010). Australian Journal of Teacher Education, vol 35, no.8, pp -18-28. [15]. Hyman and Jeff(2003),Work-life imbalance in
call centres and software development, British Journal of Industrial relation,Vol.41,pp.215-239 [16]. Nolan, M. (2009). Top Ten Sources of
Workplace Stress and How to Fight Them. Retrieved from (Accessed on 11th October, 2013).
[17]. Zoha A. Merchant, Shailaja Shastri.(2013).Exploring Job Satisfaction, Stress and Coping Strategies Employed by Engineering Faculty Volume 2 Issue 10, www.ijsr.net
[18]. Suryanarayana, N. and Luciana, M.Z. (2011). Teaching Competency and Teacher Job Satisfaction among Secondary School Teachers. Retrieved on 2012-7-17 from