INTERNATIONAL RESEARCH JOURNAL OF PHARMACY
www.irjponline.com
ISSN 2230 – 8407
Research Article
DEVELOPMENT AND VALIDATION OF ANALYTICAL METHOD FOR THE ESTIMATION OF ORNIDAZOLE IN PHARMACEUTICAL FORMULATION
Bhoomi H. Patel *, Satish A. Patel
Department of Pharmaceutical Quality Assurance, Shree S. K. Patel College of Pharmaceutical Education & Research, Ganpat University, Ganpat Vidyanagar, Mehsana, Gujarat, India
*Corresponding Author Email: [email protected]
Article Received on: 31/10/17 Approved for publication: 28/11/17
DOI: 10.7897/2230-8407.0811228
ABSTRACT
The present manuscript describe simple, novel, rapid, precise, accurate, specific and cost effective Differential Spectrophotometric method for the determination of Ornidazole in Pharmaceutical formulation. Methanol was used as solvent. Differential Spectrophotometric method involves measurement of absorbance at 268 nm Peak minima and 313 nm Peak maxima. The amplitude, which is sum of magnitude of absorbances at above two wavelengths, was selected for the measurement. The drug comply with Beer Lambert’s law over the linearity range 5-30 µg/ml. The method was validated as per ICH guideline rules in terms of Linearity, accuracy (recovery study), Precision (repeatability, intraday, interday validation), limit of detection, limit of quantification. All the validation parameters were found to be within acceptable limits. The method was found to be simple, novel, rapid, cost effective, accurate, and precise therefore is utilized for the routine analysis of drug in Pharmaceutical formulation.
Keywords: Ornidazole, Differential Spectroscopy, UV Spectrophotometric method, Validation.
INTRODUCTION
Ornidazole is a nitro imidazole which has broad spectrum cidal activity against Protozoa and some anaerobic bacteria. Nitro group of drug is reduced by redox proteins present only in anaerobic organisms to reactive nitro radical which excerts cytotoxic action by damaging DNA and other critical biomolecules1.
Ornidazole in their dosage form mainly used as broad spectrum antibiotics because ornidazole act as antiprotozoal activity1, 2.
MATERIAL AND REAGENTS INSTRUMENTS
• A double beam UV-visible Spectrophotometer (Shimadzu, UV-1700, Japan), attached to a computer software UV probe 2.0, with a spectral width of 2 nm, wavelength accuracy of 0.5 nm and pair of 1 cm matched quartz cells.
• Analytical balance (CP224S, Sartorius, Germany)
• Ultrasonic cleaner (Frontline FS 4, Mumbai, India)
• Corning volumetric flasks, beakers and pipettes of borosilicate glass were used in the study.
REAGENTS AND MATERIALS
• Ornidazole standard powder. (Acme pharmaceutical Ltd.)
• ORNI 500 (Zydus Cadila Healthcare Ltd.)
• Methanol AR grade as solvent (S.D. Fine Chemical Ltd., Mumbai, India.)
• AR grade Hydrochloric acid and Sodium hydroxide
• Whatman filter paper no. 41 (Whatman International Ltd., England)
Preparation of Reagents and Solutions Preparation of 0.1N Hydrochloric acid
0.1N Hydrochloric acid can be prepared by adding concentrated hydrochloric acid (8.5 ml) in 100 ml volumetric flask and diluting up to the mark with methanol (0.1N HCl)2.
Preparation of 0.1N Sodium hydroxide
0.1 M Sodium hydroxide can be prepared by adding sodium hydroxide (0.4 gm) in 100 ml volumetric flask and diluting up to the mark with methanol (0.1N NaOH)2.
Preparation of Standard Stock Solution
An accurately weighed ORN powder (10 mg) was weighed and transferred to 100 ml separate volumetric flask and dissolved in methanol. The flask was shaken and volume was made up to mark with methanol to give a solution having concentration 100 μg/ml 3.
Preparation of working standard solution
The working standard solutions of ORN was prepared be transfer in aliquots’ of standard stock solution of ORN (0.5, 1.0, 1.5, 2.0, 2.5 & 3.0 ml) was transferred in a series of 10 ml volumetric flask. The volume was adjusted to the mark with methanol and mixed3.
Preparation of Sample Solution
slight warming temperature to dissolve drug as completely as possible. Then the volume was adjusted up to mark with methanol. Transfer 0.1 ml of above solution to 10 ml volumetric flask to get final concentration around 10 μg/ml of ORN. Then the volume was adjusted up to mark with methanol4.
METHOD DEVELOPMENT
DETERMINATION OF WAVELENGTH
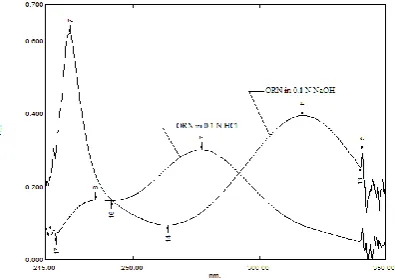
In Difference spectroscopic method the absorption spectra of equimolar solutions of Drug in two different pH (acidic or basic) were taken (Figure 2). The difference absorption spectrum is a plot of the difference in absorbance between the solutions against wavelength. It may be generated automatically using a double beam recording spectrophotometer with the solution 1 in the sample cell and the solution 2 in the reference cell5. The
absorbance was measured at two wavelengths, one being the peak maxima and other being peak minima. For this measurement, equimolar solution of Ornidazole was prepared separately in 0.1 N HCl as well as in 0.1 N NaOH at a concentration of 10 µg /ml. They were scanned in the wavelength range of 200-400 nm. Data were recorded at an interval of 1 nm. From the difference spectrum of drug in two different form, absorbances were measured at selected wavelength i.e. 268 nm Peak minima and 313 nm Peak maxima6. The amplitude, which is sum of magnitude of
absorbances at above two wavelengths, was selected for the measurement. It was calculated and used to obtain the concentration. The isobestic points (points representing zero absorbance corresponding to cutting points of acidic and alkaline spectra) was recorded at 287 nm, which were identical irrespective of the pH of solution in reference cell. There was no change in isobestic points7, which reveals that there was no
interference by additives.
METHOD VALIDATION15
The developed method was validated according to the International Conference on Harmonization (ICH) guidelines15.
The proposed method has been extensively validated in terms of specificity, linearity, accuracy, precision, limits of detection (LOD) and quantification (LOQ). The accuracy was expressed in terms of percent recovery of the known amount of the standard drugs added to the known amount of the Pharmaceutical formulation14. The precision (% RSD) was
expressed with respect to the repeatability, intra-day and inter-day variation in the expected drug concentrations.
Linearity & Range
Calibration curve was plotted over a concentration range of 5-30 μg/ml for ORN. Accurately measured standard working solution ORN (0.5, 1.0, 1.5, 2.0, 2.5 & 3.0 ml) was pipette out in to a separate series of 10 ml volumetric flask8. The volume was
adjusted to the mark with methanol and the amplitude of absorbance of the solutions was measured at 268.0 nm (Peak minima) and 313 nm (Peak maxima) against methanol as a blank. The calibration curve was constructed by plotting
proposed Method9. The results are reported in terms of relative
standard deviation (% RSD) 13, 15.
Intermediate Precision (Reproducibility)
The intra-day and inter-day precision of the proposed method was evaluated by analyzing the corresponding responses 3 times on the same day and on 3 different days over a period of 1 week for 3 different concentrations of sample solutions of ORN (5, 10, and 15 μg/ml)9. The results are reported in terms of relative
standard deviation (% RSD)13, 15.
Limit of detection (LOD) & Limit of Quantification (LOQ)
The limit of detection (LOD) and limit of quantification (LOQ) of the method were calculated by using the following equations15.
LOD = 3.3 X σ/S LOQ = 10 X σ/S
Where, σ = the standard deviation of the response, S = slope of the calibration curve
Accuracy (% Recovery study)
The accuracy of the method was determined by calculating recoveries of ORN by the standard addition method. Known amounts of standard solution of ORN were added at 50 %, 100 % and 150 % levels to pre quantified sample solutions of ORN10.
ANALYSIS OF ORNIDAZOLE IN PHARMACEUTICAL FORMULATION
Pharmaceutical formulation of Ornidazole was supplied by Zydus Cadila Healthcare Ltd. Sample solutions were prepared as described earlier. These solutions were then analyzed to obtain the spectra, and absorbance values at 268 nm and at 313 nm or amplitude absorbance was noted. Spectra of sample solution shown in Figure 3. These values was then equated in regression equation and the concentration of drug was calculated12.
RESULTS AND DISCUSSION
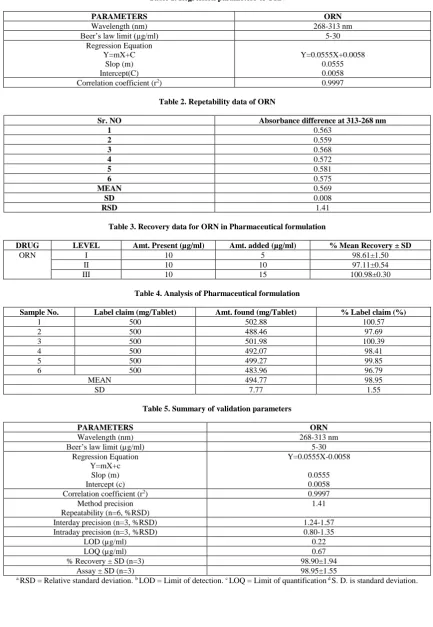
Table 1. Regression parameters of ORN
PARAMETERS ORN
Wavelength (nm) 268-313 nm
Beer’s law limit (µg/ml) 5-30
Regression Equation Y=mX+C
Slop (m) Intercept(C)
Y=0.0555X+0.0058 0.0555 0.0058
Correlation coefficient (r2) 0.9997
Table 2. Repetability data of ORN
Sr. NO Absorbance difference at 313-268 nm
1 0.563
2 0.559
3 0.568
4 0.572
5 0.581
6 0.575
MEAN 0.569
SD 0.008
RSD 1.41
Table 3. Recovery data for ORN in Pharmaceutical formulation
DRUG LEVEL Amt. Present (µg/ml) Amt. added (µg/ml) % Mean Recovery ± SD
ORN I 10 5 98.61±1.50
II 10 10 97.11±0.54
III 10 15 100.98±0.30
Table 4. Analysis of Pharmaceutical formulation
Sample No. Label claim (mg/Tablet) Amt. found (mg/Tablet) % Label claim (%)
1 500 502.88 100.57
2 500 488.46 97.69
3 500 501.98 100.39
4 500 492.07 98.41
5 500 499.27 99.85
6 500 483.96 96.79
MEAN 494.77 98.95
SD 7.77 1.55
Table 5. Summary of validation parameters
PARAMETERS ORN
Wavelength (nm) 268-313 nm
Beer’s law limit (µg/ml) 5-30
Regression Equation Y=mX+c
Slop (m) Intercept (c)
Y=0.0555X-0.0058
0.0555 0.0058
Correlation coefficient (r2) 0.9997
Method precision Repeatability (n=6, %RSD)
1.41
Interday precision (n=3, %RSD) 1.24-1.57
Intraday precision (n=3, %RSD) 0.80-1.35
LOD (µg/ml) 0.22
LOQ (µg/ml) 0.67
% Recovery ± SD (n=3) 98.90±1.94
Assay ± SD (n=3) 98.95±1.55
Figure 1. Structure of Ornidazole Figure 2. Overlay spectra of ORN in acidic and basic media
Figure 3. Difference absorption spectra of sample solution of
marketed formulation Figure 4. Calibration curve of Amplitude absorbance of ORN
CONCLUSION
The method described for the simultaneous estimation of ORN was found to be sensitive, accurate and precise for routine estimation of drug. The values of standard deviation and % RSD were satisfactorily low and recoveries studies indicate the reproducibility and accuracy of the method. The result of the analysis of the tablet dosage form by this method is reproducible and reliable and is in good agreement with label claim of the drug. The additive present in the tablet dosage form did not interfere in the analysis. So the method can be used for the routine analysis of drug in Pharmaceutical formulation.
ACKNOWALEDGEMENT
The authors wish to thank Acme pharmaceutical Ltd. and Zydus Cadila Healthcare for providing ORN pure drug powder and Pharmaceutical formulation as gift sample for research work. And we are also hearty thankful to department of Quality assurance of S.K.Patel College of Pharmaceutical Education & Research ,Ganpat University, for providing permission and all the facilities to carry out the research work.
3. Snezana SM, Gordana ZM. A rapid and reliable determination of doxycycline hyclate by HPLC with UV detection in pharmaceutical samples. Journal of Serbian chemical society 2008; 73(6): 665–671.
4. Ramesh, Divya, Nagarju. Titrimetric and Spectrophotometric Determination of doxycycline monohydrate in pharmaceutical formulation. Chemical Industry & Chemical Engineering Quarterly 2010; 16(2): 139−148.
5. Salvi M.S. et al. Development and validation of RP-HPLC Method for simultaneous estimation of doxycycline hyclate and ornidazole in bulk and tablet dosage International Journal of Pharmacy and Pharmaceutical Sciences 2013; 5(4): 7666-7671.
6. Venugopal Darak et al, Development and validation of simultaneous Spectrophotometric estimation of Doxycycline and Tinidazole in tablet dosage forms. An International Journal of Pharmaceutical Sciences 2011; 2(2): 85-90. 7. Indian Pharmacopoeia, Government of India, New Delhi:
The controller of publication, 6th ed. volume - 3, 2010;
1823-1824.
8. Development of new dissolution test and HPLC-RP and spectrophotometric method for anti-parasitic Ornidazole
N
N
CH
3
O
2
N
Research in Pharmaceutical and Biomedical Science 2011; 2(2): 710-713.
11.Sevak Manan R. et al. Development & validation of RP-UPLC and spectrophotometric method for simultaneous estimation of Ofloxacin and Ornidazole in their combine dosage form including stress study, Journal of Applied Chemistry 2014; 7(9): 32-35.
12.Natraj KS et al. UV Spectrophotometric Method Development and Validation of Simultaneous Estimation of Ciprofloxacin and Ornidazole in Tablet Dosage Form, International Research Journal of Pharmacy 2013; 4(7): 178-181.
13.Gandhi Santosh V et al. HPTLC Determination of Cefuroxime Axetil and Ornidazole in Combined Tablet Dosage Form, Journal of Chromatographic Science 2010; 48: 26-29.
14.Fatima A, Rizvan SH, Stability indicating UV spectrophometric method development and validation for thesimultaneous estimation of Ornidazole and Diloxanide furoatein bulk drug and combined dosage form. International Journal of Pharmaceutical Researches and Bio-Sciences 2014; 3(5): 362-378.
15.The International Conference on Harmonization.Q2 (R1).Validation of Analytical Procedure Text and Methodology. 2005.
Cite this article as:
Bhoomi H. Patel and Satish A. Patel. Development and validation of analytical method for the estimation of ornidazole in pharmaceutical formulation. Int. Res. J. Pharm. 2017;8(11):115-119 http://dx.doi.org/10.7897/2230-8407.0811228
Source of support: Nil, Conflict of interest: None Declared