
O R I G I N A L R E S E A R C H
Identification of Critical Pathways and Hub Genes
in LanCL1-Overexpressed Prostate Cancer Cells
This article was published in the following Dove Press journal:
OncoTargets and Therapy
Run Tang1,*
Zeming Wu1,*
Feng Lu1
Cheng Wang1
Bo Wu1
Jianqing Wang 2
Yingxiang Zhu1
1Department of Urology, The People’s
Hospital of Suzhou New District, Suzhou, Jiangsu, People’s Republic of China;
2Department of Urology, The Affiliated
Suzhou Hospital of Nanjing Medical University, Suzhou, Jiangsu, People’s Republic of China
*These authors contributed equally to this work
Background: Prostate cancer is one of the most common malignancies in urology,
espe-cially in developed countries. Our previous studies showed that Lanthionine synthase C-like protein 1 (LanCL1) can promote the proliferation of prostate cancer cells and protect cells from oxidative stress. Also, LanCL1 protects cells by inhibiting the JNK signaling pathway after H2O2 treatment.
Materials and Methods: In our study, we analyzed the data of RNA-seq to identify the
DEGs after LanCL1 overexpression. We performed a functional enrichment analysis with gene set enrichment analysis (GSEA) and a database for annotation, visualization, and integrated discovery (DAVID). We also identified the critical hub gene correlated with disease prognosis by Cox regression analysis.
Results: A total of 8928 DEGs were identified. Through the analysis of GO and KEGG, we
found that DEGs are significantly enriched in categories related to metabolism, cancer- related signaling pathways, and inflammation. The top 15 hub genes were then identified and ranked by degree from the protein–protein interaction network. Survival analysis showed 4 hub genes related to disease prognosis and ICAM1 expression is an independent risk factor for the prognosis.
Conclusion: Our results suggest the critical genes and pathways that might play key roles
after LanCL1 overexpression in prostate cancer. We also provide candidate gene targets that might play important roles in prostate cancer development.
Keywords: prostate cancer, RNA sequencing, LanCL1
Introduction
Prostate cancer remains the most common cause of cancer-related death in men, particularly in developed countries.1 Up to now, many studies have found out multiple critical genes, cellular processes, and signaling pathways that contribute to disease progression. In previous study, we focused on LanCL1 and explored whether it contributes to prostate cancer disease progression. As a result, we determined that LanCL1 expression correlated with the progression of human prostate cancer and that LanCL1 could also promote prostate cancer proliferation. Moreover, LanCL1 protects prostate cancer cells from reactive oxygen species (ROS) via suppression of JNK pathway.2
Lanthionine synthase C-like protein 1 (also known as P40 or GRP69A) is a mammalian member of the LanC-like protein superfamily. It contains highly differentiated peptide-modifying enzymes found in bacteria and plants (LanCs).3 Multiple studies reveal the role of LanCL1 in relieving oxidative stress in neurons during normal development by binding zinc ion and GSH. In addition, LanCL1 can Correspondence: Yingxiang Zhu
Email [email protected]
Jianqing Wang
Email [email protected]
OncoTargets and Therapy
Dove
press
open access to scientific and medical research
Open Access Full Text Article
OncoTargets and Therapy downloaded from https://www.dovepress.com/ by 118.70.13.36 on 27-Aug-2020
catalyze the formation of thioether products in neurons, thereby protecting them from oxidative stress.4–6 In breast cancer, LanCL1 expression is related to breast cancer survival, making it a marker of aging.7 In prostate cancer, we have preliminarily explored the role played by LanCL1
in the disease process. However, further mechanisms are still unclear. As we all know, a gene or protein usually exerts its function by affecting the signaling pathways downstream. In this study, we attempt to further study and explore the mechanism underlying to discover new potential targets for disease diagnosis and treatment.
Materials and Methods
Constructs
We generated pPB-CAG-ires-Pac vector as previously described.2,8 We inserted full-length LanCL1 into the mul-tiple-cloning sites (MCS) of pPB-CAG-ires-Pac to gener-ate pPB-CAG-LanCL1-ires-Pac vector.
Cell Lines and Cell Culture
LNCaP and PC-3 cells (ATCC) were maintained in RPMI1640 supplemented with 10% FBS. LNCaP and PC-3 cells were co-transfected with pPB-CAG-LanCL1
and pCMVPBase to obtain control and LanCL1 stable overexpressing LNCaP/PC-3 cells. We used 2 μg/mL pur-omycin (Amresco) to screen for 2 weeks for selecting the stable cell lines. Stable cell lines were identified by Western blotting. All cells were added with antibiotic- antifungal solution (100 units/mL penicillin, 0.1 mg/mL streptomycin, and 0.25 mg/mL amphotericin B), and under standard cell culture conditions (5% CO2, 95% humidity) grow at 37°C.
RNA Extraction
According to the manufacturer’s instructions (Invitrogen), total RNA was extracted from the tissue using TRIzol® reagent and genomic DNA was removed using DNase I (TaKara). RNA quality was then determined by 2100 Bioanalyser (Agilent) and quantified using ND-2000 (NanoDrop Technologies). Only high-quality RNA samples (OD260/280 = 1.8–2.2, OD260/230 ≥ 2.0, RIN ≥ 6.5, 28S: 18S ≥ 1.0, >10 μg) were used to construct the sequencing library.
Library Preparation, and Illumina
Hiseq4000 Sequencing
RNA-seq was performed according to the manufacturer’s guidelines (C-10,365; Life Technologies) and previous
research.9 RNA-seq transcriptome library was prepared following TruSeqTM RNA sample preparation Kit from Illumina (San Diego, CA) using 5μg of total RNA. Libraries were size selected for cDNA target fragments of 200–300 bp on 2% Low Range Ultra Agarose followed by PCR amplified using Phusion DNA polymerase (NEB) for 15 PCR cycles. After quantified by TBS380, paired- end RNA-seq sequencing library was sequenced with the Illumina HiSeq 4000 (2 × 150 bp read length). RNA-seq was performed on three biological replicates.
Analysis of RNA-Seq and Differentially
Expressed Genes (DEG)
RNA-seq was performed according to the manufacturer’s guidelines (C-10,365; Life Technologies) and previous research.9 We then used EdgeR, an R package to examine differential expressed genes as previously described.10,11 DEG was determined using the following criteria: | Fold Change (FC) | ≥ 2 and P value < 0.05. DEG is used for further bioinformatics analysis.
Gene Set Enrichment Analysis (GSEA)
GSEA v3.0 was used to analyze the mRNA expression level of biological function annotations and pathways afterLanCL1 overexpression. The results indicate the effects of
LanCL1 overexpression on various biological functional
gene sets. The number of permutations is set to 100. In the analysis, we used the following values as cut-off values: the P-value cut-off value is 0.05 and the false discovery rate (FDR q-val) is <0.25.
Functional Annotation and Pathway
Enrichment Analysis
We uploaded the top 2000 DEGs and the top 2000 down-graded DEGs to the database, respectively, for annotation, visualization, and integrated discovery (DAVID) website for GO analysis and KEGG analysis,12 while specifying a P-value <0.05 for statistical significance.
Integration of Protein–Protein Interaction
(PPI) Networks and Module Analysis
We used STRING database, which provides a critical assessment and integration of PPI, to analyze the protein interaction.13 To evaluate the interactive relationships among the DEGs above, we uploaded the top 1000 upre-gulated and top 1000 downreupre-gulated DEGs together to STRING. Then, only experimentally validated interactionsOncoTargets and Therapy downloaded from https://www.dovepress.com/ by 118.70.13.36 on 27-Aug-2020
(total score > 0.4) were selected as meaningful. The PPI network was then used for module screening by Molecular Complex Detection (MCODE) in Cytoscape (scores > 3, nodes > 4).14
Publicly Available Gene Expression and
Clinical Datasets for Prognosis Analysis
We download the gene expression data with corresponding prognostic profiles of 140 prostate cancer patients from online dataset GSE21032 for prognosis analysis.15 The Kaplan–Meier method using Log-rank test was used to calculate the clinical results between different gene expres-sion groups by Graphpad. Values of P <0.05 were consid-ered statistically significant.Statistical Analysis
The Kaplan–Meier method using Log-rank test was used to calculate the clinical results by Graphpad. Multivariate Cox regression analyses were used to investigate the asso-ciation between prognosis and hub genes expression/clin-ical factors. The FDR in GSEA was tested several times using the Benjamini–Hochberg program to control the FDR.16,17 Values of P <0.05 were considered statistically significant. All statistical analyses were performed using SPSS v19, Graphpad, and R 3.3.0.
Results
RNA-Seq and Identification of DEGs
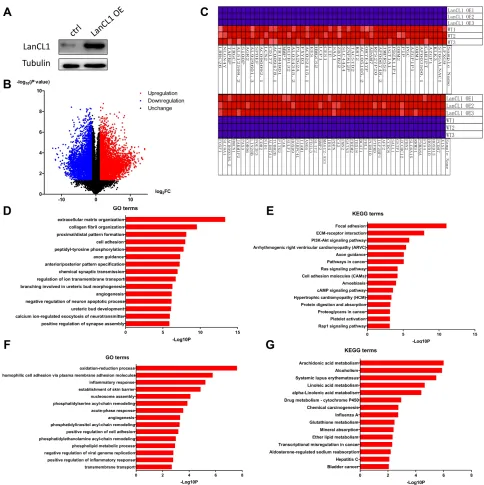
To further explore the critical signaling pathways or the reg-ulatory network downstream, we obtained the LanCL1 stably overexpressed LNCaP cell line. Western blotting showed upregulation of LanCL1 in stable cell lines (Figure 1A). We then performed RNA-seq on a stable cell line with LanCL1overexpression or an empty vector as a control. RNA-seq was performed on three biological replicates.
Based on computer analysis, we used P < 0.05 and Fold Control (FC)≥ 2.0 or ≤0.5 as criteria, and identified 8928 genes as DEGs, of which 4755 were upregulated and 4173 were downregulated. The volcano map of DEGs is shown in Figure 1B, while the heat map of DEGs expres-sion for the first 100 genes is shown in Figure 1C.
GO and KEGG Analyses of DEGs
To further analyze the DEGs at the functional level, we submitted the top 2000 upregulated and top 2000 downregu-lated DEGs, respectively, online for further analyses using DAVID. In the upregulation group, the GO-BP (Biological
Process) analysis of DEGs (Figure 1D) suggested significant enrichment in extracellular matrix organization, collagen fibril organization, proximal/distal pattern formation, cell adhesion, peptidyl-tyrosine phosphorylation, axon guidance, anterior/posterior pattern specification, chemical synaptic transmission, regulation of ion transmembrane transport, ureteric bud morphogenesis, angiogenesis, negative regula-tion of neuronal apoptosis, ureteric bud development, cal-cium ion-regulated exocytosis of neurotransmitter, and positive regulation of synapse assembly. We also showed the results of GO-CC (Cellular Component) and GO-MF (Molecular Function) in Supplementary Figures 1A and B. While KEGG pathway analysis showed enrichment mainly in focal adhesion, ECM–receptor interaction, PI3K-AKT sig-naling pathway, arrhythmogenic right ventricular cardiomyo-pathy (ARVC), axon guidance, pathways in cancer, Ras signaling pathway, cell adhesion molecules (CAMs), amoe-biasis, cAMP signaling pathway, hypertrophic cardiomyopa-thy (HCM), protein digestion and absorption, proteoglycans in cancer, platelet activation, and Rap1 signaling pathway (Figure 1E).
In downregulation group, in GO-BP (Biological Process) analysis, DEGs were significantly enriched in oxi-dation-reduction process, homophilic cell adhesion via plasma membrane adhesion molecules, inflammatory response, establishment of skin barrier, nucleosome assem-bly, phosphatidylserine acyl-chain remodeling, acute-phase response, angiogenesis, phosphatidylinositol acyl-chain remodeling, positive regulation of cell adhesion, phospha-tidylethanolamine acyl-chain remodeling, phospholipid metabolic process, negative regulation of viral genome replication, positive regulation of inflammatory response, and transmembrane transport (Figure 1F). The results of GO-CC (Cellular Component) and GO-MF (Molecular Function) were shown in Supplementary Figures 1C and D. KEGG pathway analysis showed enrichment mainly in arachidonic acid metabolism, alcoholism, systemic lupus erythematosus, linoleic acid metabolism, alpha-Linolenic acid metabolism, drug metabolism – cytochrome P450, chemical carcinogenesis, influenza A, glutathione metabo-lism, mineral absorption, ether lipid metabometabo-lism, transcrip-tional misregulation in cancer, Aldosterone-regulated sodium reabsorption, Hepatitis C, and Bladder cancer (Figure 1G).
GSEA
To determine the effect of LanCL1 overexpression on prostate cancer progression, we then analyzed various
OncoTargets and Therapy downloaded from https://www.dovepress.com/ by 118.70.13.36 on 27-Aug-2020
gene sets by GSEA. As shown in Figure 2 and Supplementary Figure 2, the GSEA results indicate bio-logical processes including UV response to DN, WNT
beta-catenin signaling, Hedgehog signaling, hypoxia, myogenesis, angiogenesis, apical junction, KRAS signal-ing, complement, IL2-STAT5 signaling, epithelial– mesenchymal transition, allograft rejection, pancreas
beta cells, and mitotic spindle were significantly enriched.
PPI Network Analysis
To investigate the protein–protein interaction and find out the hub genes, we then uploaded the top 1000 upre-gulated DEGs and 1000 downreupre-gulated DEGs to the
Figure 1 Differentially expressed genes (DEGs) and functional enrichment results of differentially expressed genes. DEG was determined using the following criteria: | Fold Change (FC) | ≥ 2 and P value <0.05. For enrichment analysis, a P-value <0.05 is taken to indicate statistical significance. (A) Western blotting result of LanCL1
overexpression in LNCaP cells. (B) Volcano plot for differentially expressed genes. (C) Heat map of the top 100 differentially expressed genes (50 upregulated genes and 50 downregulated genes). Red: upregulation; purple: downregulation. (D) The GO- BP (Biological Process) enrichment terms of upregulated genes. (E) The KEGG pathway analysis of upregulated genes. (F) The GO- BP (Biological Process) enrichment terms of downregulated genes. (G) The KEGG pathway analysis of downregulated genes.
OncoTargets and Therapy downloaded from https://www.dovepress.com/ by 118.70.13.36 on 27-Aug-2020
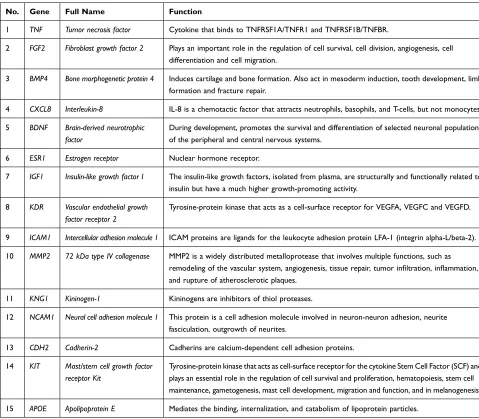
website to screen the information in the STRING data-base. The top 15 genes ranked by degree were identified as hub genes. These hub genes included TNF, FGF2, BMP4, CXCL8, BDNF, ESR1, IGF1, KDR, ICAM1,
MMP2, KNG1, NCAM1, CDH2, KIT, and APOE (Table
1). TNF is the top hub gene with the highest degree of 137. Then, we identified the gene modules in the PPI network through MCODE. The top three modules were selected, and we performed GO-BP and KEGG pathway enrichment analysis (Figure 3). Functional annotations in
module 1 genes are richer in G protein-coupled receptor signaling pathways, chemotaxis, positive regulation of cytosolic calcium ion concentration, chemokine signal-ing pathways, neuroactive ligand–receptor interactions, and Cytokine–cytokine receptor interaction.
Enrichment analysis showed that the genes in module 2 were mainly associated with interferon-gamma-mediated signaling pathway, type I interferon signaling pathway, collagen catabolic process, protein digestion and absorp-tion, ECM–receptor interacabsorp-tion, and herpes simplex
Figure 2 Gene set enrichment analysis (GSEA) results of LanCL1 overexpression in prostate cancer cells (Top1–9). In the analysis, we used the following values as cut-off values: the P-value cut-off value is 0.05 and the false discovery rate (FDR q-val) is <0.25.
OncoTargets and Therapy downloaded from https://www.dovepress.com/ by 118.70.13.36 on 27-Aug-2020
infection. In module 3, genes were mainly enriched in extracellular matrix organization, nucleosome assembly, integrin-mediated signaling pathway, systemic lupus erythematosus, alcoholism, and hypertrophic cardiomyo-pathy (HCM).
Clinical Outcome and Hub Genes
To select the hub genes that are closely related to clinical prognosis, we use the data and clinical information of GSE21032.15 Figure 4 and Table 2 show that 4 of the 15 hub genes strongly associated with clinical outcomes, including APOE, FGF2, ICAM1, and KIT. Lower APOE
expression level correlated with better outcome, while higher
FGF2, ICAM1, and KIT correlated with better outcome. Then,
we reorganized the clinical data of GSE21032 and found that
it contains two clinical factors, Gleason score and Tumor stage (Table 3). To investigate the association between prog-nosis and these clinical two factors, and to evaluate whether the expressions of the 4 hub genes above are independently associated with disease recurrence, we first did Kaplan-Meier analysis. The results suggest that both Gleason score and Tumor stage significantly correlated with the prognosis of the disease (Table 2). Then, we conducted a multivariate COX regression analysis. Results showed that only the expression of ICAM1 in the four genes, as well as Gleason score and T stage, is an independent risk factor for the prog-nosis (Table 4). At last, to confirm our results, we investigated the expression of the 4 critical hub genes after LanCL1 over-expression in another prostate cancer cell line, PC-3, which revealed the same results as in LNCaP cells (Figure 5). These
Table 1 Functional Roles of the 15 Hub Genes
No. Gene Full Name Function
1 TNF Tumor necrosis factor Cytokine that binds to TNFRSF1A/TNFR1 and TNFRSF1B/TNFBR.
2 FGF2 Fibroblast growth factor 2 Plays an important role in the regulation of cell survival, cell division, angiogenesis, cell differentiation and cell migration.
3 BMP4 Bone morphogenetic protein 4 Induces cartilage and bone formation. Also act in mesoderm induction, tooth development, limb
formation and fracture repair.
4 CXCL8 Interleukin-8 IL-8 is a chemotactic factor that attracts neutrophils, basophils, and T-cells, but not monocytes.
5 BDNF Brain-derived neurotrophic
factor
During development, promotes the survival and differentiation of selected neuronal populations of the peripheral and central nervous systems.
6 ESR1 Estrogen receptor Nuclear hormone receptor.
7 IGF1 Insulin-like growth factor I The insulin-like growth factors, isolated from plasma, are structurally and functionally related to insulin but have a much higher growth-promoting activity.
8 KDR Vascular endothelial growth
factor receptor 2
Tyrosine-protein kinase that acts as a cell-surface receptor for VEGFA, VEGFC and VEGFD.
9 ICAM1 Intercellular adhesion molecule 1 ICAM proteins are ligands for the leukocyte adhesion protein LFA-1 (integrin alpha-L/beta-2).
10 MMP2 72 kDa type IV collagenase MMP2 is a widely distributed metalloprotease that involves multiple functions, such as remodeling of the vascular system, angiogenesis, tissue repair, tumor infiltration, inflammation, and rupture of atherosclerotic plaques.
11 KNG1 Kininogen-1 Kininogens are inhibitors of thiol proteases.
12 NCAM1 Neural cell adhesion molecule 1 This protein is a cell adhesion molecule involved in neuron-neuron adhesion, neurite fasciculation, outgrowth of neurites.
13 CDH2 Cadherin-2 Cadherins are calcium-dependent cell adhesion proteins.
14 KIT Mast/stem cell growth factor
receptor Kit
Tyrosine-protein kinase that acts as cell-surface receptor for the cytokine Stem Cell Factor (SCF) and plays an essential role in the regulation of cell survival and proliferation, hematopoiesis, stem cell maintenance, gametogenesis, mast cell development, migration and function, and in melanogenesis.
15 APOE Apolipoprotein E Mediates the binding, internalization, and catabolism of lipoprotein particles.
OncoTargets and Therapy downloaded from https://www.dovepress.com/ by 118.70.13.36 on 27-Aug-2020
results suggested that these 4 genes, especially ICAM1, might be potential key genes for further research.
Discussion
Prostate cancer is still one of the most common malignant tumors in male urinary system all around the world, espe-cially in developed countries. In-depth research on the downstream pathways and regulatory networks of key genes involved in disease progression is of great
significance for understanding the disease and finding new therapeutic targets. In our previous study, we revealed the role of LanCL1 as an oncogene in prostate cancer to promote cell proliferation and protect cell from attack of ROS via JNK pathway. However, important downstream genes and regulatory signaling pathways are still not clear.
Here in this study, we overexpressed LanCL1 gene in LNCaP cells and did RNA-Seq analysis. By selecting DEGs and performing GO and KEGG analysis on the
Figure 3 Top three modules from the protein–protein interaction (PPI) network. (A) PPI network of module 1. (B) GO-BP (Biological Process) and KEGG analyses of module 1. (C) PPI network of module 2. (D) GO-BP (Biological Process) and KEGG analyses of module 2. (E) PPI network of module 3. (F) GO-BP (Biological Process) and KEGG analyses of module 3.
OncoTargets and Therapy downloaded from https://www.dovepress.com/ by 118.70.13.36 on 27-Aug-2020
top 4000 DEGs, we found that LanCL1 overexpression was significantly associated with the metabolism, axon and synaptic function, and several signaling targets or pathways, such as cAMP signaling pathway, Ras signaling pathway, PI3K-AKT-mTOR signaling pathway, and Rap1
signaling pathway. Previous researches have shown that
Rap1 (ras-related protein 1) signaling pathway and Ras
signaling pathway are related to JNK and participate in cellular oxidative stress and the production and elimina-tion of ROS in a variety of cellular backgrounds.18–21 In addition, the cAMP signaling pathway is also involved in the production, metabolism, and clearance of ROS in the body, which has the same important role as the JNK- related pathway.22,23 These results suggest that LanCL1
plays an important role in assisting cells in processing ROS, which is consistent with our previous findings. Besides, because the oxidative stress state and related signaling pathways in the cells will change after H2O2 treatment, there may be significant differences in the sig-naling pathways between treated and untreated cells. This might be the main reason why JNK pathway was not
enriched in the RNA-seq results of untreated cells in this study. JNK pathway is the main mechanism by which
LanCL1 protects prostate cancer cells from oxidate stress
in H2O2 treated cells. Our results here also show that the mechanism of LanCL1 in dealing with ROS is more com-plicated. It also validates our previous experiments, that is, changing the activity of JNK pathway in rescue experi-ments only partially restored the ROS-related phenotype.
In addition to oxidative stress such as ROS, we also found that many pathways related to tumorigenesis and progression appeared enriched after LanCL1 overexpres-sion, mainly including WNT beta-catenin signaling,
PI3K-AKT signaling pathway, and KRAS signaling.
These pathways play important roles in the pathogenesis and progression of various tumors, including prostate cancer.
In prostate cancer, WNT/β-catenin and AR signals inhi-bit each other. β-catenin activation and PTEN deletion synergistically drive non-AR independent castration- resistant prostate cancer.24–26 In most cancer types, the PI3K signaling pathway is activated and promotes
Figure 4 Prognosis analyses of the hub genes. (A–D) Four hub genes that significantly related to prognosis by analyzing the data from GSE21032. The Kaplan-Meier method using Log-rank test was used to calculate the clinical results. Values of P <0.05 were considered statistically significant.
Abbreviations: APOE, apolipoprotein E; FGF2, fibroblast growth factor 2; ICAM1, intercellular adhesion molecule 1; KIT, KIT proto-oncogene.
OncoTargets and Therapy downloaded from https://www.dovepress.com/ by 118.70.13.36 on 27-Aug-2020
tumorigenesis by regulating nutrient metabolism, cell pro-liferation, survival, migration, and angiogenesis.26 The potential mechanism of PI3K/AKT activation is mainly due to the deletion or mutation of its key negative regula-tory gene, PTEN.27 In fact, it is known that the mutual interference between PI3K/AKT and other pathways (such
as AR, WNT, and ERK signaling pathways) plays a vital
role in the disease progression and drug resistance of prostate cancer, making co-targeting the PI3K/AKT signal-ing pathway and its synergistic pathways critical to
improve the anticancer efficacy of PI3K/AKT
inhibitors.28,29 Our results indicate that LanCL1 may con-tribute to prostate cancer by influencing these important tumor regulatory signal pathways or signal networks, espe-cially its promotion effect on prostate cancer cell prolif-eration. LanCL1 also may affect one of these pathways. As for the specific regulatory mechanism, further molecular biology experiments are needed to verify it.
In the PPI network analysis, we identified the top 15 central genes with the highest degree of interaction.
TNF (tumor necrosis factor) is the top hub gene, which is mainly secreted by macrophages. TNF can bind to its receptors TNFRSF1A/TNFR1 and TNFRSF1B/TNFBR to exert its function. TNF could involve in the development of tumors by regulating inflammatory and immune responses. Among the 15 hub genes, we also identified 4 hub genes that strongly associated with clinical out-comes in prostate cancer, including APOE, FGF2,
ICAM1, and KIT. We used data from a classic and
author-itative prostate cancer RNA-seq database GSE21032 to analyze. These 4 genes might play critical roles in the development of prostate cancer and are closely related to the prognosis of the disease. Then, we conducted a multivariate COX regression analysis and found that only the expression of ICAM1 is an independent risk factor for the prognosis. This result emphasizes the important potential role of ICAM1 in prostate cancer initiation and development. ICAM1 (Intercellular adhesion molecule 1) is a cell surface glycoprotein expressed on endothelial cells and immune system cells. It binds to CD11a/CD18
or CD11b/CD18 type integrins and is also used by
rhino-virus as a receptor.30,31 Previous studies have shown that
ICAM1 may facilitate breast and lung.32–34 Researchers
Table 2 Disease Free Survival and Clinicopathological Affairs/
Hub Genes Expression
Characteristics Overall Survival,% P
10-Year Probability
Gleason score <0.0001
<7 70.73
7 54.54
>7 15.23
Tumor stage <0.0001
T2 69.45
T3-T4 44.7
FGF2 expression 0.0159
High 75.3
Low 46.22
ICAM1 expression 0.0209
High 77.03
Low 34.56
KIT expression 0.0409
High 63.96
Low 60.84
APOE expression 0.0381
High 58.41
Low 63.29
Notes: P<0.05 was considered statistically significant: values shown in bold. Kaplan–Meier analysis was used.
Table 3 Summary of the Clinical Characteristics of Patients with
Prostate Cancer in GSE21032
Characteristics Case, N (%)
Gleason score
<7 78 (55.7%)
7 49 (35%)
>7 13 (9.3%)
Tumor stage
T2 86 (61.4%)
T3–T4 54 (38.6%)
Table 4 Multivariate Cox Regression Analyses Investigating the
Association Between Prognosis and Hub Genes Expression/ Clinical Factors
Variables Hazard Ratio P 95.0% CI
Gleason score 0.0200
GS<7 1.00 – Referent
GS=7 0.26 0.0063 0.09–0.681
GS>7 0.41 0.0403 0.17–0.96
Tumor stage 4.98 0.0001 2.24–11.08
FGF2 2.18 0.0808 0.91–5.21
ICAM1 2.61 0.0167 1.19–5.74
KIT 0.70 0.4415 0.28–1.718
APOE 0.53 0.1016 0.25–1.13
Notes: P<0.05 was considered statistically significant: values shown in bold. Multivariate Cox regression analysis was used.
OncoTargets and Therapy downloaded from https://www.dovepress.com/ by 118.70.13.36 on 27-Aug-2020
reported that CCN3-ICAM1 and MiRNA-296-3p-ICAM1
axes could influence cell migration in prostate cancer cells.35,36 However, the role and mechanism of ICAM1 in prostate cancer are still largely unknown. ICAM1 may be further studied as key a gene to find more clues about the initiation and progression of prostate cancer disease. As for APOE, FGF2, and KIT, many previous studies have investigated their roles in prostate cancer, and our results further confirmed these findings.
Our study contained one limitation. In our study, we analyzed the data of RNA-seq to identify the DEGs after LanCL1 overexpression and figured out the cri-tical genes and pathways that might play key roles
after LanCL1 overexpression in prostate cancer using bioinformatics analysis. The mechanism and validation
of LanCL1 overexpression in prostate cancer still need
further research in clinical and molecular biology experiments.
Conclusions
In conclusion, our results revealed the critical genes and pathways that might play key roles after LanCL1 overexpres-sion in prostate cancer. We also provide 4 critical hub genes that could play critical roles in the development of prostate cancer and are closely related to the prognosis of the disease,
Figure 5 The expression levels of the 4 hub genes in PC-3 LanCL1 overexpression cells. (A–D) The mRNA expression levels of Apolipoprotein E (APOE, (A)), Fibroblast Growth Factor 2 (FGF2, (B)), Intercellular Adhesion Molecule 1 (ICAM1, (C)) and KIT Proto-Oncogene (KIT, (D)) in LanCL1 overexpressed PC-3 cells. N=5 and a P-value <0.05 is taken to indicate statistical significance. **P<0.01, ***P<0.001.
OncoTargets and Therapy downloaded from https://www.dovepress.com/ by 118.70.13.36 on 27-Aug-2020
which may help in developing prostate cancer treatment strategies.
Acknowledgments
This study was supported by scientific innovation founda-tion of People’s Hospital of SND (grant no. SGY2018A02) and National Natural Science Foundation of China (81802565).
Disclosure
The authors declared no potential conflicts of interest with respect to the research, authorship, or publication of this article.
References
1. Siegel RL, Miller KD, Jemal A. Cancer statistics, 2016. CA Cancer J Clin. 2016;66(1):7–30. doi:10.3322/caac.21332
2. Wang J, Xiao Q, Chen X, et al. LanCL1 protects prostate cancer cells from oxidative stress via suppression of JNK pathway. Cell Death Dis. 2018;9(2):197. doi:10.1038/s41419-017-0207-0
3. Bauer H, Mayer H, Marchler-Bauer A, Salzer U, Prohaska R. Characterization of p40/GPR69A as a peripheral membrane protein related to the lantibiotic synthetase component C. Biochem Biophys Res Commun. 2000;275(1):69–74. doi:10.1006/bbrc.2000.3260 4. Chung CH, Kurien BT, Mehta P, et al. Identification of lanthionine
synthase C-like protein-1 as a prominent glutathione binding protein expressed in the mammalian central nervous system. Biochemistry.
2007;46(11):3262–3269. doi:10.1021/bi061888s
5. Zhang W, Wang L, Liu Y, et al. Structure of human lanthionine synthetase C-like protein 1 and its interaction with Eps8 and glutathione. Genes Dev. 2009;23(12):1387–1392. doi:10.1101/gad. 1789209
6. Huang C, Chen M, Pang D, et al. Developmental and activity-dependent expression of LanCL1 confers antioxidant activity required for neuronal survival. Dev Cell. 2014;30(4):479–487. doi:10.1016/j.devcel.2014.06.011
7. Althubiti M, Lezina L, Carrera S, et al. Characterization of novel markers of senescence and their prognostic potential in cancer. Cell Death Dis. 2014;5:e1528. doi:10.1038/cddis.2014.489
8. Wang J, He C, Gao P, et al. HNF1B-mediated repression of SLUG is suppressed by EZH2 in aggressive prostate cancer. Oncogene. 2019:1–12. 9. Guo R, Zheng L, Park JW, et al. BS69/ZMYND11 reads and con-nects histone H3.3 lysine 36 trimethylation-decorated chromatin to regulated pre-mRNA processing. Mol Cell. 2014;56(2):298–310. doi:10.1016/j.molcel.2014.08.022
10. Robinson MD, McCarthy DJ, Smyth GK. edgeR: a bioconductor package for differential expression analysis of digital gene expression data. Bioinformatics. 2010;26(1):139–140. doi:10.1093/bioinfor-matics/btp616
11. McCarthy DJ, Chen Y, Smyth GK. Differential expression analysis of multifactor RNA-Seq experiments with respect to biological variation. Nucleic Acids Res. 2012;40(10):4288–4297. doi:10.1093/ nar/gks042
12. Dennis G Jr, Sherman BT, Hosack DA, et al. DAVID: database for annotation, visualization, and integrated discovery. Genome Biol.
2003;4(5):P3. doi:10.1186/gb-2003-4-5-p3
13. Szklarczyk D, Franceschini A, Wyder S, et al. STRING v10: protein-protein interaction networks, integrated over the tree of life. Nucleic Acids Res. 2015;43(Database issue):D447–D452. doi:10. 1093/nar/gku1003
14. Bader GD, Hogue CW. An automated method for finding molecular complexes in large protein interaction networks. BMC Bioinform.
2003;4(1):2. doi:10.1186/1471-2105-4-2
15. Taylor BS, Schultz N, Hieronymus H, et al. Integrative genomic profiling of human prostate cancer. Cancer Cell. 2010;18(1):11–22. doi:10.1016/j.ccr.2010.05.026
16. Reiner A, Yekutieli D, Benjamini Y. Identifying differentially expressed genes using false discovery rate controlling procedures. Bioinformatics.
2003;19(3):368–375. doi:10.1093/bioinformatics/btf877
17. Benjamini Y, Drai D, Elmer G, Kafkafi N, Golani I. Controlling the false discovery rate in behavior genetics research. Behav Brain Res.
2001;125(1–2):279–284. doi:10.1016/S0166-4328(01)00297-2 18. Ye F, Chai W, Xie M, et al. HMGB1 regulates erastin-induced
ferroptosis via RAS-JNK/p38 signaling in HL-60/NRAS(Q61L) cells. Am J Cancer Res. 2019;9(4):730–739.
19. Abo El-Nasr NME, Saleh DO, Mahmoud SS, et al. Olmesartan attenu-ates type 2 diabetes-associated liver injury: cross-talk of AGE/RAGE/ JNK, STAT3/SCOS3 and RAS signaling pathways. Eur J Pharmacol.
2020;874:173010. doi:10.1016/j.ejphar.2020.173010
20. Schattauer SS, Bedini A, Summers F, et al. Reactive oxygen species (ROS) generation is stimulated by kappa opioid receptor activation through phosphorylated c-Jun N-terminal kinase and inhibited by p38 mitogen-activated protein kinase (MAPK) activation. J Biol Chem.
2019;294(45):16884–16896. doi:10.1074/jbc.RA119.009592 21. Takino JI, Sato T, Nagamine K, Hori T. The inhibition of Bax
activation-induced apoptosis by RasGRP2 via R-Ras-PI3K-Akt sig-naling pathway in the endothelial cells. Sci Rep. 2019;9(1):16717. doi:10.1038/s41598-019-53419-4
22. Bouchez C, Devin A. Mitochondrial biogenesis and mitochondrial Reactive Oxygen Species (ROS): a complex relationship regulated by the cAMP/PKA signaling pathway. Cells. 2019;8:4. doi:10.3390/ cells8040287
23. Palmeira CM, Teodoro JS, Amorim JA, Steegborn C, Sinclair DA, Rolo AP. Mitohormesis and metabolic health: the interplay between ROS, cAMP and sirtuins. Free Radic Biol Med. 2019;141:483–491. doi:10.1016/j.freeradbiomed.2019.07.017
24. Yeh Y, Guo Q, Connelly Z, et al. Wnt/beta-catenin signaling and prostate cancer therapy resistance. Adv Exp Med Biol. 2019; 1210:351–378.
25. Patel R, Brzezinska EA, Repiscak P, et al. Activation of beta-catenin cooperates with loss of pten to drive AR-independent castration-resistant prostate cancer. Cancer Res. 2020;80 (3):576–590. doi:10.1158/0008-5472.CAN-19-1684
26. Sun J, Li S, Wang F, Fan C, Wang J. Identification of key pathways and genes in PTEN mutation prostate cancer by bioinformatics analysis. BMC Med Genet. 2019;20(1):191. doi:10.1186/s12881- 019-0923-7
27. Yan Y, Huang H. Interplay among PI3K/AKT, PTEN/FOXO and AR signaling in prostate cancer. Adv Exp Med Biol. 2019;1210:319–331. 28. Fan HT, Shi YY, Lin Y, Yang XP. EHMT2 promotes the development of prostate cancer by inhibiting PI3K/AKT/mTOR pathway. Eur Rev Med Pharmacol Sci. 2019;23(18):7808–7815. doi:10.26355/ eurrev_201909_18990
29. Sarker D, Reid AH, Yap TA, de Bono JS. Targeting the PI3K/AKT pathway for the treatment of prostate cancer. Clin Cancer Res.
2009;15(15):4799–4805. doi:10.1158/1078-0432.CCR-08-0125 30. Lawson C, Wolf S. ICAM-1 signaling in endothelial cells. Pharmacol
Rep. 2009;61(1):22–32. doi:10.1016/S1734-1140(09)70004-0 31. Lin YT, Chen LK, Jian DY, et al. Visfatin promotes monocyte
adhesion by upregulating ICAM-1 and VCAM-1 expression in endothelial cells via activation of p38-PI3K-Akt signaling and sub-sequent ROS production and IKK/NF-kappaB activation. Cell Physiol Biochem. 2019;52(6):1398–1411.
32. Rosette C, Roth RB, Oeth P, et al. Role of ICAM1 in invasion of human breast cancer cells. Carcinogenesis. 2005;26(5):943–950. doi:10.1093/carcin/bgi070
OncoTargets and Therapy downloaded from https://www.dovepress.com/ by 118.70.13.36 on 27-Aug-2020
33. Chen S, Pan S, Wu H, et al. ICAM1 regulates the development of gastric cancer and may be a potential biomarker for the early diag-nosis and progdiag-nosis of gastric cancer. Cancer Manag Res.
2020;12:1523–1534. doi:10.2147/CMAR.S237443
34. Figenschau SL, Knutsen E, Urbarova I, et al. ICAM1 expression is induced by proinflammatory cytokines and associated with TLS for-mation in aggressive breast cancer subtypes. Sci Rep. 2018;8 (1):11720. doi:10.1038/s41598-018-29604-2
35. Chen PC, Lin TH, Cheng HC, Tang CH. CCN3 increases cell moti-lity and ICAM-1 expression in prostate cancer cells. Carcinogenesis.
2012;33(4):937–945. doi:10.1093/carcin/bgs108
36. Liu X, Chen Q, Yan J, et al. MiRNA-296-3p-ICAM-1 axis promotes metastasis of prostate cancer by possible enhancing survival of nat-ural killer cell-resistant circulating tumour cells. Cell Death Dis.
2013;4(11):e928. doi:10.1038/cddis.2013.458
OncoTargets and Therapy
Dove
press
Publish your work in this journal
OncoTargets and Therapy is an international, peer-reviewed, open access journal focusing on the pathological basis of all cancers, potential targets for therapy and treatment protocols employed to improve the management of cancer patients. The journal also focuses on the impact of management programs and new therapeutic
agents and protocols on patient perspectives such as quality of life, adherence and satisfaction. The manuscript management system is completely online and includes a very quick and fair peer-review system, which is all easy to use. Visit http://www.dovepress.com/ testimonials.php to read real quotes from published authors.
Submit your manuscript here: https://www.dovepress.com/oncotargets-and-therapy-journal
OncoTargets and Therapy downloaded from https://www.dovepress.com/ by 118.70.13.36 on 27-Aug-2020




![Tetrakis[2 (benzylaminocarbonyl)phenoxymethyl]methane](data:image/gif;base64,R0lGODlhAQABAIAAAP///wAAACH5BAEAAAAALAAAAAABAAEAAAICRAEAOw==)