Precision Meson Spectroscopy at COMPASS
B. Grubeafor the COMPASS Collaboration
Excellence Cluster Universe, Technische Universit¨at M¨unchen, Boltzmannstr. 2, 85748 Garching, Germany.
Abstract. We present first results of a partial wave analysis of the diffractive reactionπ−
Pb → π−π+π−
Pb based on data from the COMPASS experiment taken during a pilot run in 2004 using a 190 GeV/cπ−
beam on a lead target. The analysis was performed in the region of squared four-momentum transfert0
between 0.1 and 1.0 (GeV/c)2. Theπ−π+π−
final state shows a rich spectrum of well-known resonances. In addition a spin-exotic JPC =1−+
state with significant intensity was observed at 1.66 GeV/c2in theρ(770)πdecay channel in natural parity exchange. The resonant nature of this state is manifest in the mass dependence of its phase difference to JPC =1++ and 2−+
waves. The measured resonance parameters are consistent with the disputedπ1(1600). An outlook on the analyses of the much larger data set taken during 2008 and 2009 is given.
1 Introduction
The na¨ıve Constituent Quark Model (CQM) describes light mesons as bound color-singlet states of quarks and anti-quarks with flavors u, d, and s grouped into SU(3)flavor multiplets. In the CQM the spin J, parity P, and charge conjugationCof a meson are given by
(1) J=|L−S|, . . . ,L+S; P=(−1)L+1andC=(−1)L+S
whereLis the relative orbital angular momentum of quark and antiquark andS = 0,1 the total intrinsic spin of the
qq0pair. In addition a meson is characterized by its isospin
IandG-parity which is defined as
(2) G=(−1)I+L+S
Both quantum numbers are conserved in strong interac-tions.
Despite of its simplicity, the CQM works surprisingly well and explains a good part of the observed light me-son spectrum as well as some of the meme-son properties, al-though it does not make any assumptions about the nature of the binding force. Quantum ChromoDynamics (QCD) describes the strong interaction between colored quarks by the exchange of gluons, which are colored themselves. Even though it is still not clear, how the confinement of quarks and gluons into hadrons is generated by the QCD Lagrangian, its structure suggests that there are color-sing-let states beyond |qq0i. In particular one expects gluonic degrees of freedom, that reflect the non-Abelian charac-ter of QCD, to manifest themselves in the meson spec-trum. Mesonic states beyond the CQM are classified into hybrids, glueballs, and multi-quark states [1]. Hybrids are
|qq0giresonances with constituent glue that contributes to the quantum numbers of the hadron. Theqq0 pair is in a color-octet configuration which is neutralized in color by
a e-mail:[email protected]
the excited gluon. Glueballs are pure gluonic bound states
|ggi. Multi-quark states include tetraquarks and mesonic molecules. Most of these states will be hardly distinguish-able from ordinary|qq0istates with the sameJPCand will mix with them so that physically observable states are in general a linear combination of|qq0iand additional basis states that is experimentally very difficult to disentangle. An unambiguous evidence for the existence of mesonic states beyond the CQM, as allowed by QCD, would be the discovery of exotic states with quantum numbers forbidden in the simple quark model. In the light-meson sector so-called spin-exotic states with quantum numbersJPC =0−−, 0+−, 1−+, 2+−, 3−+, 4+−, . . . are a particularly promising field of research.
In lattice QCD [2] simulations the lightest glueball is predicted to have ordinary scalar quantum numbersJPC =
0++ and a mass of about 1.7 GeV/c2. A possible experi-mental glueball candidate is the f0(1500) seen by the Crys-tal Barrel [3] and WA102 [4] experiments. The interpreta-tion of the data is, however, complicated by the mixing of the f0(1500) with other states.
The lowest mass hybrid, on the other hand, is predic-ted [5] to have exotic quantum numbersJPC =1−+so that it will not mix with ordinary resonances. It is expected to have a mass between 1.3 and 2.2 GeV/c2and in the flux-tube model it preferentially decays into b1(1235)π and
f1(1285)π[6]. Three experimental candidates for isovec-tor spin-exotic JPC = 1−+ states were found so far: The
π1(1400) was seen inπ−N → π−ηN by the E852 [7] and VES [8] experiments. Crystal Barrel observed a 1−+ ηπ state in pn → π−π0η [9] and pp → π0π0η [10] Dalitz plot analyses. Another 1−+state, theπ
1(1600), was seen at higher mass by the E852 and VES experiments in
ρπ [11,12,13],η0π [14,15], f
1π [16,17], andb1π[18,17] decay modes in peripheralπ−pinteractions. It was also re-ported in pp → b1ππ[19]. The resonant nature of both 1−+states is still discussed controversially in the commu-DOI:10.1051/epjconf/201007018
R
(
P
)
h
beamh
targeth
′targetX
h
beamh
targeth
′targeth
beamh
targeth
′targeth
beamh
targeth
′targeth
1...
h
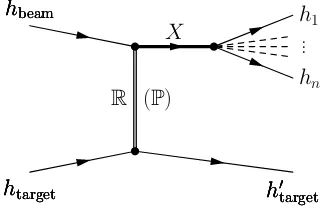
nFig. 1.Production of resonanceXin diffractive scattering of the
beam particlehbeamoffthe target particlehtargetand its subsequent decay intonhadronsh1, . . . ,hn. The interaction is mediated by
exchange of a Reggeon Rand leaves target particle intact. At high energies the PomeronPis the dominant Regge-trajectory.
nity [8,17]. In particular the observation of theπ1(1600) in theρπdecay channel is heavily disputed. A different anal-ysis of a larger E852 data set showed that an extension of the wave set, used to model the data, makes theπ1(1600) signal disappear [20]. A third 1−+state, theπ
1(2000), was seen only by the E852 experiment in the f1π [16] and
b1π[18] decay channel.
The COMPASS experiment sets out to settle these and other issues in light-meson spectroscopy by studying me-son production in diffractive and central production reac-tions using high-energetic hadron beams on various fixed targets.
Diffractive reactions are known to exhibit a rich spec-trum of produced states. In diffractive meson production the target particle remains intact and interacts with the in-cident beam particle viat-channel Reggeon exchange. In this process the beam particlehbeamis excited to some res-onanceX which then dissociates into the final state as il-lustrated in Fig. 1:
(3) hbeam+htarget→X+htarget0 and X→h1+. . .+hn
The process can be characterized by two kinematic vari-ables: the square of the total center-of-mass energy, s =
(pbeam+ptarget)2, and the squared four-momentum transfer from the incoming beam particle to the outgoing systemX,
t=(pbeam−pX)2. It is custom practice to use the variable t0=|t|−|t|mininstead oft, where|t|minis the minimum value of|t|allowed by kinematics for a given Xinvariant mass
mX. The value of|t|min is small but larger than zero, be-cause of the additional longitudinal four-momentum trans-fer which is required bymX >mbeam. At high beam ener-gies the diffraction is dominated by Pomeron exchange [21] so that isospin andG-parity of the intermediate stateXare the same as that of the beam particle. In addition the final state particles are produced mostly at small angles with re-spect to the beam direction which requires a high angular resolution and coverage of the detector.
In central production reactions the mesonic state is pro-duced in Reggeon-Reggeon fusion, where both beam and target particle remain unaltered. This is illustrated in Fig. 2. These reactions will enhance scalar mesons and in par-ticular to the f0(1500). It is also believed that in central
h
beamh
fasth
targeth
′targetX
h
beamh
fasth
targeth
′targeth
beamh
fasth
targeth
′targeth
beamR
h
fasth
targetR
h
′target
h
beam(
P
)
h
fasth
target(
P
)
h
′target
h
beam(
P
)
h
fasth
target(
P
)
h
′target
h
1h
n...
Fig. 2.Central production of mesonXin Reggeon-Reggeon
fu-sion and its subsequent decay into nhadrons h1, . . . ,hn. Both
beam and target particles stay intact.
production gluonic degrees of freedom are enriched which makes it a promising reaction for glueball searches. The produced resonanceXcarries only a small fractionxF ≈0
of the maximum possible longitudinal momentum pmax
L in
the center-of-mass frame, wherexF =pL/pmaxL ≈2pL/
√
s. The scattered beam hadron hasxF ≈1 and the targetxF ≈
−1. In fixed target geometry this means that the scattered beam particle appears as the leading hadron hfast in the event, while the target recoil proton is slow. The centrally produced system is separated from the leading hadron and the recoil particle by rapidity gaps.
2 Experimental Setup
Finding mesonic states that do not fit into the CQM in the light-quark sector is an experimentally challenging task. There is a high density of broad overlapping states so that the signal can only be extracted from interference effects. This requires large data sets and a complete phase space coverage of the experiment. The COmmon Muon and Pro-ton Apparatus for Structure and Spectroscopy (COM-PASS) [22] is a fixed-target experiment at the CERN Super Proton Synchrotron (SPS) and is well suited for this task: It is a two-stage spectrometer built to measure at high beam intensities. The detector covers a wide range of scattering angles and particle momenta and has a high angular res-olution. In the target region scintillating fibers and planes of silicon microstrip detectors are used for beam definition and vertexing. The setup has two large dipole magnets with 1.0 and 5.5 Tm bending power which both are surrounded by staggered tracking detectors with increasing granularity and resolution towards the beam axis. The two spectrome-ter stages are equipped with hadronic and electromagnetic calorimeters. This enables COMPASS to reconstruct final states with charged as well as neutral particles likeπ0,η, andη0. In addition the first stage features a Ring Imaging CHerenkov (RICH) detector able to separate charged final state pions and kaons in the momentum range between 5 and 50 GeV/c.
sec-ondary hadron as well as polarized tertiary muon beams which are produced at a production target by the incoming 400 GeV/cproton beam from the SPS. The hadron beams can have a momentum of up to 300 GeV/cand a maximum intensity of 4·107 sec−1. The positive hadron beam con-sists of 71.5 % p, 25.5 %π+, and 3.0 %K+, the negative beam has 96.0 %π−and 3.5 %K−.
The suitability of the COMPASS setup for meson spec-troscopy was studied in a short pilot run in 2004, where a 190 GeV/cπ− beam was shot onto a fixed lead target. Based on the experience from this run the spectrometer was upgraded in order to address the challenges of the hadron spectroscopy physics program. A Recoil Proton De-tector (RPD) was installed around a 40 cm long liquid hy-drogen target. The RPD measures the time-of-flight of the recoil protons using two barrels of scintillator slats and provides information for the trigger decision. The read-out electronics of the electromagnetic calorimeters was up-graded and the central part of the second calorimeter was equipped with 800 radiation-hard Shashlik blocks. In ad-dition the tracking close to the beam axis and the vertex definition were improved by adding high-resolution Pixel-GEM detectors in the spectrometer and cryogenic silicon microstrip detectors in the target region, respectively. At the same time the material budget in the beam region was reduced. Also the particle identification capabilities were enhanced by utilizing the RICH detector in the first spec-trometer stage and two ChErenkov Differential counters with Achromatic Ring focus (CEDAR) upstream of the tar-get which are able to identify the incoming beam particles. With this enhanced setup COMPASS took diffractive and central production data in 2008 and 2009 using 190 GeV/cnegative and positive hadron beams on liquid hydrogen, nickel, tungsten, and lead targets. The goal of collecting about ten times the available world statistics for both production reactions has been achieved.
3 Diffractive Production of
π
−π
+π
−During the 2004 pilot run COMPASS was able to record within a few days a data sample of the diffractive reaction
(4) π−+Pb→π−π+π−+Pb
with competitive statistics using a 190 GeV/c π− beam on a total 3 mm thick lead target. Theπ−π+π−final state was chosen for a first analysis [23,24,25], because the con-troversial spin-exoticπ1(1600) has been observed in this channel.
3.1 Data Sample and Event Selection
The trigger for diffractive events selected one incoming and at least two outgoing charged particles. In 2004 it con-sisted of several components. Incoming beam particles were selected by a coincidence of two scintillator discs with 5 cm diameter that were positioned upstream of the tar-get and centered about the beam axis. A veto system with
a 4 cm central hole rejected beam particles that were not crossing the target material. Additional lead-scintillator ve-to counters placed downstream of the target suppressed events with outgoing particles that were emitted under large angles so that they would fall out of the acceptance. A sys-tem of three scintillation detectors in the spectrometer, so-called beam killers, vetoed non-interacting beam particles. In order to enrich diffractive events, a scintillator disk with 5 cm diameter was placed after the target and was used as a multiplicity counter, selecting events with at least two forward charged particles. In addition at least one cluster with minimum energy deposit of 6 GeV was required in the hadronic calorimeter in the second spectrometer stage. The 2004 data sample contains about 87.7·106 events from the diffractive trigger which were subject to further offline event selection. Events were required to have ex-actly one primary vertex with one incoming beam and three outgoing charged tracks. The primary vertex position was constraint to the target region and the three outgoing tracks were required to have a charge sum of−1. Diffractive events were enriched by an exclusivity cut. However, the spec-trometer setup was not able to measure the energy of the incident beam particle event-by-event, only the direction of the beam particle and thus the scattering angleθwas de-termined precisely by a silicon microstrip beam telescope. In the 2004 setup also the target recoil particle was not de-tected. For small momentum transfer, large beam energy, and assuming specific target and recoil masses the beam energy Ebeamand the momentum transfert0can be calcu-lated in good approximation from the well-measured quan-titiesmX,EX, andθ. For the analysis thet0region between
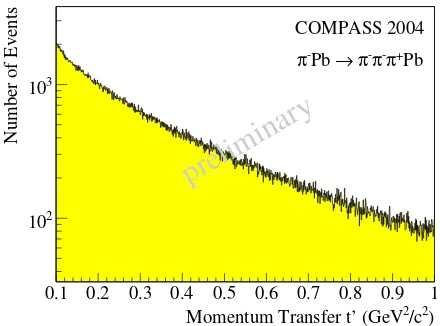
0.1 and 1.0 (GeV/c)2 was selected, where the π1(1600) was reported in the past. In this t0 region the beam par-ticles were assumed to scatter offquasi-free nucleons in-side the Pb nuclei of the target. The validity of this as-sumption is supported by the roughly exponential falling
t0-spectrum shown in Fig. 3 which has a slope parameter compatible with the nucleon radius. Exclusiveπ−π+π− pro-duction was selected by requiring the reconstructed beam
)
2
/c
2
Momentum Transfer t’ (GeV
0.1 0.2 0.3 0.4 0.5 0.6 0.7 0.8 0.9 1
Number of Events
2
10
3
10
COMPASS 2004
Pb
+ π -π -π →
Pb
-π
preliminary
Fig. 3.Spectrum of the squared four-momentum transfert0=|
Calculated Beam Energy (GeV)
165 170 175 180 185 190 195
Number of Events
0 0.5 1 1.5 2 2.5 3 3.5
3
10
×
COMPASS 2004
Pb
+ π -π -π →
Pb
-π
2
/c
2
0.1 < t’ < 1.0 GeV
preliminary
Fig. 4.Distribution of the beam energyEbeamcalculated frommX,
EX, andθfor the t0 range between 0.1 and 1.0 (GeV/c)2. The
exclusivity cut is indicated by the vertical lines.
)
2
System (GeV/c
+ π -π -π
Mass of
0 0.5 1 1.5 2 2.5 3
)
2
Events / (5 MeV/c
0 0.5 1 1.5 2 2.5 3 3.5
3
10
×
(1260)
1
a
(1320)
2
a
(1670)
2 π
COMPASS 2004
Pb
+ π -π -π →
Pb
-π
2
/c
2
0.1 < t’ < 1.0 GeV
preliminary
Fig. 5.π−π+π−
invariant mass distribution of the selected data sample fort0∈
[0.1,1.0] (GeV/c)2.
energy Ebeamto be maximum 4 GeV off the mean beam energy of 189 GeV (see Fig. 4). About 420 000 events in the mass range between 0.5 and 2.5 GeV/c2pass all of the above selection cuts.
In the 2004 pilot run there was no particle identifica-tion for the incoming beam particles. The non-pionic com-ponent of the beam of about 5 % consists mainly ofK−. Their decays and diffractive reactions constitute part of the background in the analysis. Also for the final state no par-ticle identification was applied.
3.2 Partial-Wave Analysis
Figure 5 shows theπ−π+π−invariant mass distribution of the selected data sample. It exhibits clear structures in the mass region of the well-known resonances a1(1260),
a2(1320), and π2(1670). In order to find and disentangle the various resonances in the data, a partial-wave analysis (PWA) was performed.
π−
Target Recoil
X−
[JPCMǫ]
Isobar
π−
Target Recoil
π−
Target Recoil
π−
Target
R
Recoil [L]
Bachelor
π−
π+ π−
π−
Target
(P)
Recoil [L]
Bachelor
π−
π+ π−
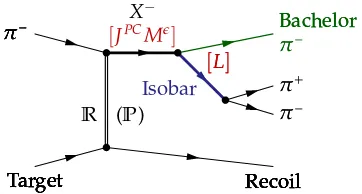
Fig. 6.A partial wave in the isobar model. The diffractively
pro-ducedX−
with quantum numbersJPCMdecays first into an
iso-bar and a bachelorπ−
. The isobar has spinSand a relative orbital angular momentumLwith respect to theπ−
bachelor. The isobar then decays in a second step intoπ+π−
.
The PWA employed in this analysis is based on two basic assumptions. We assume that the total cross section factorizes into a resonance and a recoil vertex and we use the isobar model to describe the X− decay. This by defi-nition neglects any final state interaction of the outgoing pions or the isobar with the target as well as within the
π−π+π−system. The isobar model decomposes the decay
X−→π−π+π−into a chain of successive two-body decays: First theX−with quantum numbers JPC decays into a di-pion resonance, the so-called isobar, and a bachelor di-pion
π−
bachelor. The isobar has spinS and a relative orbital angu-lar momentumLwith respect toπ−bachelor.LandS couple to theX−spinJ. Second the isobar decays intoπ+π−. This is illustrated in Fig. 6. In general the π−π+π−system has isospinI≥1. Since there are no known flavor-exotic light-quark mesons and Pomeron exchange is assumed, we set
I = 1. A state with odd number of pions has negativeG -parity so that the value of the charge conjugationCis fixed byG=C(−1)I to be positive.
The spin-density matrixρi,i0 is parameterized in terms
of production amplitudesVir:
(5) ρi,i0=
Nr
X
r VirVi0∗r
wherei=JPCM[decay]Landdenote a particular
partial-wave amplitude that is characterized by the isobar state, the decay orbital angular momentumL, the spin quantum numbers JPC of the X− state, and by the spin projection
Mof J. The amplitudes are constructed in the reflectivity basis [26], whereM≥0 and where the reflectivity=±1 describes the symmetry under reflection through the pro-duction plane. This basis is convenient, because, due toP
parity conservation, amplitudes with different reflectivities do not interfere. Furthermore at high center-of-mass ener-gies √sthe reflectivity corresponds to the naturality of the exchanged Reggeon. The rankNr of the spin density
The observed intensity is parameterized as a coherent and incoherent sum over the partial-wave amplitudes [26]:
(6) I(τ;mX)=η(τ)
X
=±1
Nr
X
r
waves
X
i
Vir ψi(τ;mX)
2
Hereτrepresents the five phase space coordinates that com-pletely describe the three-body kinematics. They are mea-sured for each event and are used to calculate the decay amplitudesψi which are constructed using non-relativistic Zemach tensors [27,28] and do not contain any free pa-rameters. The decay of theX−is described in its rest sys-tem using the Gottfried-Jackson frame [29] with thez-axis along the beam particle direction and they-axis perpendic-ular to the production plane spanned by the beam and the recoil particle. The angular distribution of the isobar de-cay is defined in the canonical system obtained by pure Lorentz boost to the isobars rest frame. The production amplitudesVir are complex numbers that are determined from extended maximum likelihood fits to the data per-formed in 40 MeV/c2wide bins in the three-pion invariant massmXusing a program that was originally developed at
Illinois [30] and later developed at Protvino and Munich. This so-called “mass-independent” fit takes into account the overall acceptanceηas a function of the phase space variables. It does not include any parameterization of the produced resonancesX−and assumes constant production strengths of the waves within the mX bin. Thet0
depen-dence of the wave intensities was implemented by multi-plying the amplitudes with differentt0-dependent functions of the form fi(t0)∝e−bt0forM=0 and fi(t0)∝t0e−bt0for
M=1, where the slope parameterbwas determined from the data by fittingt0slices.
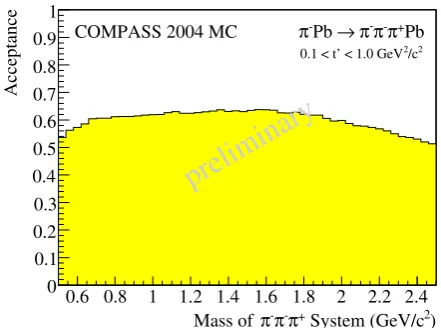
The acceptance was estimated using a Monte Carlo simulation. Events were generated uniformly according to three-body phase space with beam kinematics andt0 distri-bution taken from the real data and then processed through the detailed detector simulation and the full reconstruction and event selection chain. Figure 7 shows that COMPASS has an excellent acceptance of more than 50 % forπ−π+π− final states even in the regionmX >2 GeV/c2. Moreover
the acceptance shows only weak dependence on the po-lar angle of the isobar in the Gottfried-Jackson frame (cf. Fig. 8). This is important for the PWA, since in [20] it was shown that a drop of the acceptance towards cosθGJ=±1
in combinations with detector resolution effects may lead to significant leakage of intensity between waves.
The PWA model includes fiveπ+π−isobars [12]: The amplitudes of the ρ(770), f2(1270), and ρ3(1690) where described using relativistic Breit-Wigner line shape func-tions including Blatt-Weisskopf barrier penetration fac-tors [31]. Theπ+π−S-wave is in general dominated by a broad f0(600) meson, a narrow f0(980), and several reso-nances above 1 GeV/c2. We use the parameterization from [33] which is based on the “M” solution from Au, Morgan, and Pennington [34], but with the f0(980) sub-tracted from the elasticππamplitude and added as a sepa-rate Breit-Wigner resonance.
Due to the angular momentum carried by the Pomeron that is exchanged in diffractive reactions, the incomingπ−
)
2
System (GeV/c
+ π -π -π
Mass of
0.6 0.8 1 1.2 1.4 1.6 1.8 2 2.2 2.4
Acceptance
0 0.1 0.2 0.3 0.4 0.5 0.6 0.7 0.8 0.9 1
COMPASS 2004 MC π-Pb →π-π-π+Pb
2
/c
2
0.1 < t’ < 1.0 GeV
preliminary
Fig. 7.Overall acceptance as a function of theπ−π+π−
invariant massmX.
GJ θ
cos
-1 -0.8 -0.6 -0.4 -0.2 -0 0.2 0.4 0.6 0.8 1
Acceptance
0 0.1 0.2 0.3 0.4 0.5 0.6 0.7 0.8 0.9 1
COMPASS 2004 MC
)
2
< 2.0 (GeV/c
π 3
0.8 < m
Pb
+ π -π -π →
Pb
-π
2
/c
2
0.1 < t’ < 1.0 GeV
preliminary
Fig. 8.Overall acceptance as a function of the cosine of the polar
angleθGJof the isobar in the Gottfried-Jackson rest frame of the X−
.
(JP = 0−) can be excited to a stateX− with differentJP,
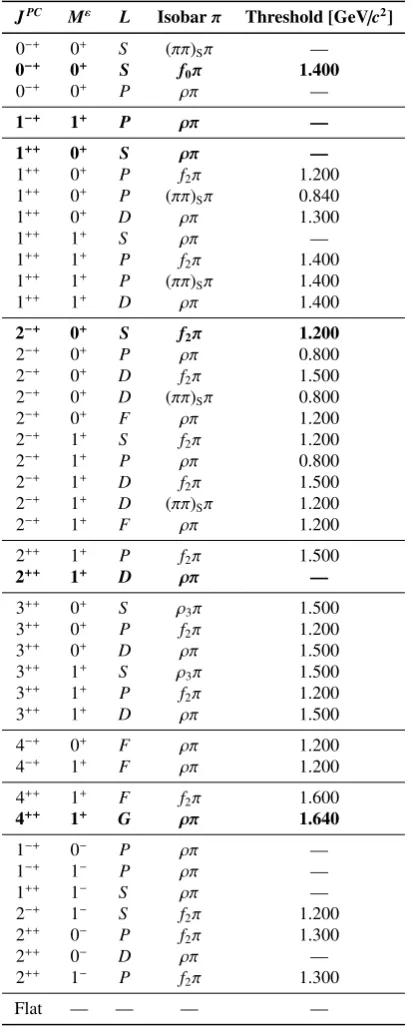
which is limited only by the conservation laws of strong interaction. In the construction of the PWA model waves withJ≤4 andM≤1 were considered. The final wave set of the model consists of 41 partial waves plus one incoher-ent isotropic background wave, the so-called “flat” wave. Table 1 lists all waves. Mostly positive reflectivity waves, corresponding to natural parity exchange production, are needed to describe the data. The wave set in particular in-cludes the 2−+0+[ρπ]F, 2−+1+[ρπ]F, and 2−+1+[ρπ]Pwaves that in [20] were found to be crucial for describing the data and in addition made the exoticπ1(1600) signal disappear. Some of the waves havemX thresholds below which their
intensity was fixed to zero.
error of this bin was increased by the maximum difference of the solutions, which in the plots is indicated by thick green bars.
After performing the mass-independent fit the mass de-pendence of the production amplitudes of a subset of six waves (printed in boldface in Table 1) was fit in the range from 0.80 to 2.32 GeV/c2 to a model parameterized in
Table 1.Wave set used for the mass-independent fit. The set
con-sists of mostly positive reflectivity waves that correspond to nat-ural parity exchange. The six waves printed in boldface are used in the mass-dependent fit.
JPC Mε L Isobarπ Threshold [GeV/c2]
0−+
0+ S (ππ)Sπ —
0−+
0+ S f0π 1.400
0−+
0+ P ρπ —
1−+
1+ P ρπ —
1++ 0+ S ρπ —
1++ 0+ P f2π 1.200
1++ 0+ P (ππ)Sπ 0.840
1++ 0+ D ρπ 1.300
1++ 1+ S ρπ —
1++ 1+ P f2π 1.400
1++ 1+ P (ππ)Sπ 1.400
1++ 1+ D ρπ 1.400
2−+
0+ S f2π 1.200
2−+ 0+
P ρπ 0.800
2−+ 0+
D f2π 1.500
2−+
0+ D (ππ)Sπ 0.800
2−+
0+ F ρπ 1.200
2−+
1+ S f2π 1.200
2−+
1+ P ρπ 0.800
2−+
1+ D f2π 1.500
2−+
1+ D (ππ)Sπ 1.200
2−+
1+ F ρπ 1.200
2++ 1+ P f2π 1.500
2++ 1+ D ρπ —
3++ 0+ S ρ3π 1.500
3++ 0+ P f2π 1.200
3++ 0+ D ρπ 1.500
3++ 1+ S ρ3π 1.500
3++ 1+ P f2π 1.200
3++ 1+ D ρπ 1.500
4−+
0+ F ρπ 1.200
4−+
1+ F ρπ 1.200
4++ 1+ F f2π 1.600
4++ 1+ G ρπ 1.640
1−+
0−
P ρπ —
1−+
1−
P ρπ —
1++ 1−
S ρπ —
2−+
1−
S f2π 1.200
2++ 0−
P f2π 1.300
2++ 0−
D ρπ —
2++ 1−
P f2π 1.300
Flat — — — —
terms of Breit-Wigner amplitudes: (7)
ρ i j(mX)=
Nr
X
r
resonances
X
k
cikrBWk(mX)
resonances
X
l
cjlrBWl(mX)
∗
Here BWi(mX) is the relativistic Breit-Wigner amplitude
for resonancei:
(8) BWi(mX;M0, Γ0)=
1
m2X−M02+iΓtot(mX)M0
whereΓtot(mX)=P Ndecay
n Γn(mX) is the total mass-dependent
width of the resonance including phase space factors and Blatt-Weisskopf barrier penetration factorsBLn(qn) [31] for
allNdecaydecay channels:
(9) Γtot(mX)= Ndecay
X
n Γ0n
M0
mX qn q0n
B2Ln(qn) B2Ln(q0n)
with Γ0 = Γtot(M0). Here qn represents the breakup
mo-mentum of the particular two-body decay andq0n =qn(M0). If required by the data, for some waves an additional co-herent exponential background term of the forme−αq2
was added. The waves selected for the mass-dependent fit ex-hibit either significant amplitudes or rapid phase motions in the 1.7 GeV/c2mass region.
3.3 Results
Figure 9 shows the most dominant wave, 1++0+[ρπ]S. The data points with statistical error bars are the result of the mass-independent fit. The wave intensity exhibits a broad structure around 1.2 GeV/c2 which is the a1(1260). The continuous line represents the result of the mass-dependent
χ2-fit of the intensities and phase differences of six waves (see Table 1). In this fit the peak is well described using a Breit-Wigner parameterization according to Bowler [35] and a small exponential background which could be caused by the Deck-effect [36].
The second most intense wave is the 2++1+[ρπ]Dwave which is depicted in Fig. 10. It is also the strongestM=1 wave and can be large only at hight0. The sharp peak of the
a2(1320) is described by a Breit-Wigner, where the mass-dependent total widthΓtot(mX) takes into account the two
dominant decay modes of thea2(1320) to [ρπ]Dand [ηπ]D with strength according to PDG [32]. In order to reproduce the high-mass tail of the wave and its interference with the 1++0+[ρπ]S and the 2−+0+[f
2π]S waves, a second Breit-Wigner for the a2(1700) with its parameters fixed to the PDG values [32] was added to the fit.
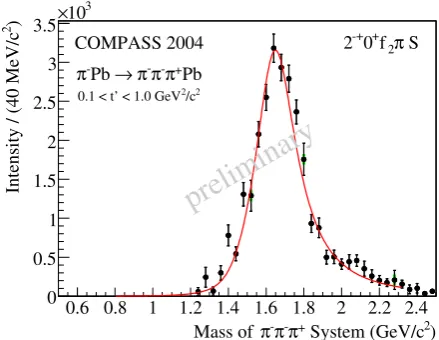
The third significant wave is the 2−+0+[f2π]S wave shown in Fig. 11. A Breit-Wigner corresponding to the
π2(1670) fits the data well. Its total width was parameter-ized assuming 60 % [f2π]S and 40 % [ρπ]Pdecays, ne-glecting contributions below 10 %.
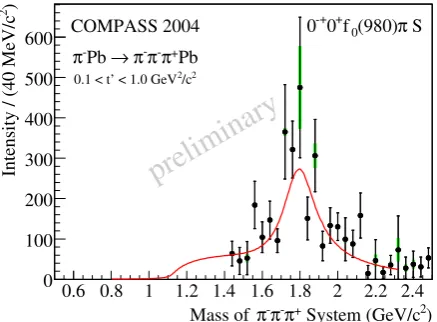
wave with thea4(2040) (see Fig. 12) and the 0−+0+[f0(980)
π]S wave with theπ(1800) (see Fig. 13). The 4++1+[ρπ]G
wave peaks around 1.9 GeV/c2and is fit by a Breit-Wigner amplitude using a constant width in its denominator, be-cause no branching fractions are known for thea4(2040). The resultinga4mass of 1 884±13(stat.)+−250(syst.) is lower than the PDG average [32], but has a large systematic er-ror. Even fainter in intensity is theπ(1800) peak in the 0−+ 0+[f0(980)π]S wave, but it exhibits a clear phase motion with respect to theπ2(1670) in the 2−+0+[f2π]S wave (not shown here). A Breit-Wigner with constant total width on top of a background describes the data.
Figure 14 shows the intensity of the spin-exotic 1−+ 1+[ρπ]Pwave. The distribution exhibits a broad bump at 1.7 GeV/c2and a shoulder at lower masses. The phase dif-ference between this wave and the 1++0+[ρπ]S wave, as depicted in Fig. 15, exhibits a rising phase motion around 1.7 GeV/c2, in the tail region of the a1(1260), thus indi-cating a resonant behavior of the spin-exotic wave. This is supported by the flat phase difference with respect to the 2−+0+[f
2π]S wave as shown in Fig. 16 which can be explained by a 1−+resonance with mass and width simi-lar to that of theπ2(1760) which dominates the 2−+wave. The intensity and the phase differences of the 1−+ ampli-tude are fit by a Breit-Wigner with constant total width on top of an exponential background that describes the low-mass shoulder. The extracted resonance parameters of
M0 = 1 660±10(stat.)+−640 (syst.) MeV/c2 andΓ0 =269± 21(stat.)+42
−64(syst.) MeV/c
2 are in agreement with the dis-putedπ1(1600).
Table 2 summarizes the resonance parameters extracted by the mass-dependent fit which are in good agreement with the PDG values [32]. The table also gives the intensi-ties of the resonant part of the particular waves integrated over the mass range from 0.80 to 2.32 GeV/c2 and nor-malized to the total intensity of the waves in the mass-dependent fit, which corresponds to 38.7(2) % of the total acceptance-corrected data sample in the mass range.
)
2
System (GeV/c
+ π -π -π
Mass of
0.6 0.8 1 1.2 1.4 1.6 1.8 2 2.2 2.4
)
2
Intensity / (40 MeV/c
0 2 4 6 8 10 12 14 16
3
10
×
S
π ρ +
0
++
1
2
/c
2
0.1 < t’ < 1.0 GeV
COMPASS 2004
Pb
+ π -π -π →
Pb
-π
preliminary
Fig. 9.Intensity of the 1++0+[ρπ]S partial wave. The wave
ex-hibits a broad peak from thea1(1260). The continuous line shows the result of the mass-dependent fit.
)
2
System (GeV/c
+ π -π -π
Mass of
0.6 0.8 1 1.2 1.4 1.6 1.8 2 2.2 2.4
)
2
Intensity / (40 MeV/c
0 2 4 6 8 10 12
3
10
×
D
π ρ +
1
++
2
2
/c
2
0.1 < t’ < 1.0 GeV
COMPASS 2004
Pb
+ π -π -π →
Pb
-π
preliminary
Fig. 10.Intensity of the 2++1+[ρπ]Dpartial wave. The wave is
dominated by a narrowa2(1320) peak. The continuous line shows the result of the mass-dependent fit.
)
2
System (GeV/c
+ π -π -π
Mass of
0.6 0.8 1 1.2 1.4 1.6 1.8 2 2.2 2.4
)
2
Intensity / (40 MeV/c
0 0.5 1 1.5 2 2.5 3 3.5
3
10
×
S
π 2
f
+
0
-+
2
2
/c
2
0.1 < t’ < 1.0 GeV
COMPASS 2004
Pb
+ π -π -π →
Pb
-π
preliminary
Fig. 11.Intensity of the 2−+
0+[f2π]S partial wave. The wave ex-hibits a broadπ2(1670) peak. The continuous line represents the result of the mass-dependent fit.
Several studies were performed to test the stability of the 1−+wave with respect to various assumptions made in the analysis, e.g. by adding and removing waves, varying cuts or initial values of the fit parameters, and shifting the mass binning in the mass-independent fit. In addition the dependence of the fit on the rankNr was studied. The fit
withNr=1 shows an increase of the flat background wave
from 5.8 % for Nr = 2 to 19 % with respect to the total
acceptance-corrected data sample in the mass range from 0.5 to 2.5 GeV/c2. ForN
r =3 this value drops to 1.2 %.
This fit, however, exhibits larger bin-to-bin fluctuations. In both cases the 1−+intensity was not significantly altered in the region between 1.5 and 1.8 GeV/c2.
Table 2.Preliminary resonance parameters and intensities of the specified decay channels for the six waves included in the mass-dependent fit. The first uncertainty corresponds to the statistical error, the second one to the systematic error.
State Mass Width Intensity Channel
[MeV/c2] [MeV/c2] [%] JPCM[decay]L
a1(1260) 1 255±6+−717 367±9+ 28
−25 67±3+ 4
−20 1++0+[ρπ]S
a2(1320) 1 321±1+−07 110±2+ 2
−15 19.2±0.6+ 0.3
−2.2 2++1+[ρπ]D π2(1670) 1 658±3+24
−8 271±9+ 22
−24 10.0±0.4+ 0.7
−0.7 2
−+
0+[f2π]S
a4(2040) 1 885±13+−502 294±25+ 46
−19 1.0±0.3+ 0.1
−0.1 4++1+[ρπ]G π(1800) 1 785±9+12
−6 208±22+ 21
−37 0.8±0.1+ 0.3
−0.1 0
−+
0+[f0π]F
π1(1600) 1 660±10+0
−64 269±21+ 42
−64 1.7±0.2+ 0.9
−0.1 1
−+
1+[ρπ]P
)
2
System (GeV/c
+ π -π -π
Mass of
0.6 0.8 1 1.2 1.4 1.6 1.8 2 2.2 2.4
)
2
Intensity / (40 MeV/c
0 50 100 150 200 250 300 350 400 450
G
π ρ +
1
++
4
2
/c
2
0.1 < t’ < 1.0 GeV
COMPASS 2004
Pb
+ π -π -π →
Pb
-π
preliminary
Fig. 12.Intensity of the 4++1+[ρπ]Gpartial wave. The broad peak
around 1.9 GeV/c2is attributed to thea4(2040). The continuous line shows the result of the mass-dependent fit.
)
2
System (GeV/c
+ π -π -π
Mass of
0.6 0.8 1 1.2 1.4 1.6 1.8 2 2.2 2.4
)
2
Intensity / (40 MeV/c
0 100 200 300 400 500
600 f0(980)π S
+
0
-+
0
2
/c
2
0.1 < t’ < 1.0 GeV
COMPASS 2004
Pb
+ π -π -π →
Pb
-π
preliminary
Fig. 13.Intensity of the 0−+
0+[f0(980)π]Spartial wave. The struc-ture around 1.8 GeV/c2is attributed to theπ(1800). The continu-ous line shows the result of the mass-dependent fit.
the 1−+wave. The Monte Carlo data were then processed by the same PWA used for the real data. The amount of
)
2
System (GeV/c
+ π -π -π
Mass of
0.6 0.8 1 1.2 1.4 1.6 1.8 2 2.2 2.4
)
2
Intensity / (40 MeV/c
0 100 200 300 400 500 600 700
800 1-+1+ρπ P
2
/c
2
0.1 < t’ < 1.0 GeV
COMPASS 2004
Pb
+ π -π -π →
Pb
-π
preliminary
Fig. 14.Intensity of the spin-exotic 1−+
1+[ρπ]Ppartial wave. The distribution exhibits a broad bump around 1.7 GeV/c2. The red curve shows the result of the mass-dependent fit with one Breit-Wigner for theπ1(1600) (blue curve) on top of a background (pur-ple curve).
intensity leaking from the 16 major waves into the 1−+1+ [ρπ]Pwave was found to be below 5 % of the 1−+ inten-sity and is therefore negligible. This is mainly due to the flat angular acceptance and the better resolution of COM-PASS, both well reproduced by the simulations.
In the mass-dependent fit the low mass shoulder in the 1−+1+[ρπ]Pwave is accounted for by a non-resonant expo-nential background, which is possibly caused by a Deck-like effect [36]. In an alternative attempt to describe the shoulder an additional Breit-Wigner for theπ1(1400) with its parameters fixed to the PDG values [32] was included in the mass-dependent fit. This did not significantly alter the intensity or the phase difference of any of the waves in the mass-dependent fit, but slightly shifted theπ1(1600) towards smaller masses which was included in the system-atic error.
)
2
System (GeV/c
+ π -π -π
Mass of
0.6 0.8 1 1.2 1.4 1.6 1.8 2 2.2 2.4
Phase (degrees)
-400 -350 -300 -250 -200 -150 -100 -50
Pb
+ π -π -π →
Pb
-π
preliminary
2
/c
2
0.1 < t’ < 1.0 GeV
S)
π ρ +
0
++
P - 1
π ρ +
1
-+
(1
φ ∆
COMPASS 2004
Fig. 15.Phase difference of the 1−+
1+[ρπ]Pand the 1++0+[ρπ]S partial waves. A clear phase motion is seen in the region around 1.7 GeV/c2which can be explained by aπ1(1600) resonance in-terfering with the tail of thea1(1260). The continuous line shows the result of the mass-dependent fit.
)
2
System (GeV/c
+ π -π -π
Mass of
0.6 0.8 1 1.2 1.4 1.6 1.8 2 2.2 2.4
Phase (degrees)
-200 -150 -100 -50 0 50 100 150
Pb
+ π -π -π →
Pb
-π
preliminary
2
/c
2
0.1 < t’ < 1.0 GeV
S)
π 2
f
+
0
-+
P - 2
π ρ +
1
-+
(1
φ ∆
COMPASS 2004
Fig. 16.Phase difference of the 1−+
1+[ρπ]Pand the 2−+
0+[f2π]S partial waves. The phase difference is virtually flat which can be explained by aπ1(1600) resonance with resonance parame-ters similar to theπ2(1670). The continuous line shows the result of the mass-dependent fit.
where the PWA was performed without thet0-dependent factors in the partial-wave amplitudes.
It cannot be ruled out, however, that theπ1(1600) sig-nal is an artifact of the simplifying assumptions made in the PWA model. Final state interactions in particular the Deck-mechanism were found to be relevant in theπ−π+π− system [38,39] and might cause spurious signals.
3.4 Run 2008/9 Data
The analysis of the data from the 2004 pilot run marked only the beginning of the hadron spectroscopy program at COMPASS. During the years 2008 and 2009 COMPASS collected very large diffractive and central production data sets using 190 GeV/cpositive and negative hadron beams
mostly on liquid hydrogen targets. These data will make it possible to study a number of channels with unprecedented precision.
Several analyses have started: Figure 17 shows the
π−π+π−invariant mass spectrum after event selection. The tremendous boost in statistics will enable COMPASS to extract precise resonance parameters, to study thet0 -depen-dence of resonance production, and to hopefully settle the
π1(1600) issue in the diffractiveπ−π+π−channel. This anal-ysis will be accompanied by a PWA of the π−π0π0 final state which will provide important internal cross checks of our results. Furthermore the PWA will be extended to the region oft0<0.1 (GeV/c)2. Data sets with different targets will give access to possible nuclear effects in diffractive production.
) 2 System (GeV/c +
π -π -π
Mass of
0 1 2 3 4 5 6
)
2
Events/(5 MeV/c
0 0.02 0.04 0.06 0.08 0.1 0.12
6 10
×
COMPASS 2008 p + π -π -π →
p -π
2
/c
2
< t’ < 1.0 Gev
2
/c
2
0.1 GeV
w/o acceptance correction
(21% of 2008 data)
preliminary
(1320)2 a
(1670) 2 π
(1260) 1 a
Fig. 17.Invariant mass distributionπ−π+π−
final states diff rac-tively produced by aπ−
beam on a liquid hydrogen target; based on 21 % of the 2008 data set.
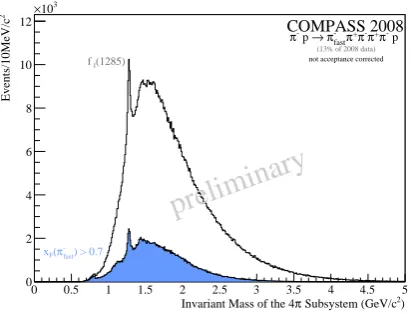
In addition COMPASS will search for scalar and tensor glueballs in centrally produced π+π−π+π− systems. Fig-ure 18 depicts theπ+π−π+π−invariant mass with and with-out selecting centrally produced event via the cutxF(π−fast)>
0.7. A clear signal from thef1(1285) is seen.
The f1πand maybe even theb1πchannel, into which the 1−+hybrid is predicted to preferentially decay, can also be studied in charged five pion final states produced in
πA → π−π+π−π+π−A. Furthermore this channel gives ac-cess to higher masses above 2 GeV/c2, where the PDG lists many states that need confirmation [32].
Finally COMPASS will search for possible hybrids and glueballs in kaonic final states produced in reactions like
π−p→π−K+K−p,π−K0
SK
0
Sp, orπ
−K0
SK
0
Lp. Moreover the
CEDAR detectors enable COMPASS to measure diff rac-tion of kaon beam, e.g. inK−p→K−π+π−p.
4 Summary
) 2 Subsystem (GeV/c
π
Invariant Mass of the 4
0 0.5 1 1.5 2 2.5 3 3.5 4 4.5 5
2
Events/10MeV/c
0 2 4 6 8 10 12
3 10
×
preliminary
COMPASS 2008
p -π + π -π + π fast -π →
p -π
not acceptance corrected (13% of 2008 data)
) > 0.7 fast
-π ( F x
(1285)
1
f
Fig. 18.Invariant mass distribution of theπ+π−π+π−
system pro-duced inπ−
p→ π−
fast(π+π
−π+π−
)precoil with and without the cut xF(π−fast)>0.7; based on 13 % of the 2008 data set.
the f0(1500). At COMPASS two production mechanisms, diffractive dissociation and central production, can be mea-sured in parallel usingπ,K, orpbeams. The spectrometer provides high acceptance and excellent resolution for final states containing both charged and neutral particles.
In a short first pilot run in 2004 COMPASS acquired a diffractive data set using a 190 GeV/cπ−beam scattered off a lead target. A partial wave analysis of theπ−π+π−final state in the region oft0 ∈ [0.1,1.0] (GeV/c)2 shows sev-eral of the well-known resonances expected in this chan-nel. In addition we observe a spin-exoticJPC =1−+state with significant intensity in theρπ decay channel in nat-ural parity exchange at a mass of 1.66 GeV/c2. The mass dependence of its phase and its resonance parameters are consistent with the disputedπ1(1600).
Based on the experience of the pilot run the spectrom-eter was upgraded and improved. In particular a detector to measure the target recoil was added to the setup. Dur-ing dedicated runs in 2008 and 2009 COMPASS accumu-lated diffractive and central production data sets of un-precedented statistics using 190 GeV/chadron beams. The bulk of the data were taken with a liquid hydrogen target, but also nickel, tungsten, and lead targets were measured. First analyses of diffractive and central production reac-tions have started.
This work is supported by the the German Bundesministerium f¨ur Bildung und Forschung, the Maier-Leibnitz-Labor der LMU und TU M¨unchen, the DFG Cluster of ExcellenceOrigin and Structure of the Universe, and CERN-RFBR grant 08-02-91009.
References
1. E. Klempt and A. Zaitsev, Phys. Rept.454(2007) 1 2. Y. Chenet al., Phys. Rev.D73(2006) 014516 3. C. Amsleret al., Phys. Lett.B353(1995) 571 4. D. Barberiset al., Phys. Lett.B474(2000) 423 5. K.J. Juge, J. Kuti, and C. Morningstar, AIP Conf. Proc.
688(2004) 193
6. F.E. Close and P.R. Page, Nucl. Phys.B443(1995) 233 7. D.R. Thompsonet al., Phys. Rev. Lett.79(1997) 1630 8. V. Dorofeevet al., AIP Conf. Proc.619(2002) 143 9. A. Abeleet al., Phys. Lett.B423(1998) 175 10. A. Abeleet al., Phys. Lett.B446(1999) 349 11. G.S. Adamset al., Phys. Rev. Lett.81(1998) 5760 12. S.U. Chunget al., Phys. Rev.D65(2002) 072001 13. Yu.A. Khokhlovet al., Nucl. Phys.A663(2000) 596 14. E.I. Ivanovet al., Phys. Rev. Lett.86(2001) 3977 15. G.M. Beladidzeet al., Phys. Lett.B313(1993) 276 16. J. Kuhnet al., Phys. Lett.B595(2004) 109
17. D.V. Amelinet al., Phys. Atom. Nucl.68(2005) 359 18. M. Luet al., Phys. Rev. Lett.94(2005) 032002 19. C.A. Bakeret al., Phys. Lett.B563(2003) 140 20. A.R. Dzierbaet al., Phys. Rev.D73(2006) 072001 21. U. Amaldi, M. Jacob, and G. Matthiae, Ann. Rev.
Nucl. Part. Sci.26(1976) 385
22. P. Abbonet al., Nucl. Instrum. Meth.A577(2007) 455 23. Q. Weitzel, Int. J. Mod. Phys.A24(2009) 484 24. Q. Weitzel, Ph.D. Thesis, TU M¨unchen,
Physik-Department E18 (2008)
25. M. Alekseev et al., submitted to Phys. Rev. Lett. (2009)
26. S.U. Chung and T.L. Trueman, Phys. Rev.D11(1975) 633
27. C. Zemach, Phys. Rev. B97(1965) 140; ibid. B109 (1965) 140
28. S.U. Chung, CERN-71-08, Lectures given in the Aca-demic Training Program of CERN (1971)
29. K. Gottfried and J.D. Jackson, Nuovo Cimento 33 (1964) 309
30. G. Ascoliet al., Phys. Rev. Lett.25(1970) 962 31. F. von Hippel and C. Quigg, Phys. Rev.D5(1972) 624 32. W.M. Yaoet al., J. Phys.G33(2006) 1
33. D.V. Amelinet al., Phys. Lett.B356(1995) 595 34. K.L. Au, D. Morgan, M.R. Pennington, Phys. Rev.
D35(1987) 1633
35. M.G. Bowler, Phys. Lett.B209(1988) 99 36. R.T. Deck, Phys. Rev. Lett.13(1964) 169
37. S.U. Chung and J. Friedrich, Phys. Rev. D78(2008) 074027
38. G. Ascoli, L.M. Jones, B. Weinstein, and H.W. Wyld, Phys. Rev.D8(1973) 3894
![Fig. 15. Phase difference of the 1−+1+[ρπ]P and the 1++0+[ρπ]Spartial waves. A clear phase motion is seen in the region around1.7 GeV/c2 which can be explained by a π1(1600) resonance in-terfering with the tail of the a1(1260)](https://thumb-us.123doks.com/thumbv2/123dok_us/9045762.1440650/9.595.77.297.345.508/phase-dierence-spartial-motion-region-explained-resonance-terfering.webp)