A Framework To Support Management Of
HIV/AIDS Using K-Means And Random Forest
Algorithm
Gladys Iseu, Waweru Mwangi, Dr. Michael Kimwele
Abstract: Healthcare industry generates large amounts of complex data about patients, hospital resources, disease management, electronic patient records, and medical devices among others. The availability of these huge amounts of medical data creates a need for powerful mining tools to support health care professionals in diagnosis, treatment and management of HIV/AIDS. Several data mining techniques have been used in management of different data sets. Data mining techniques have been categorized into regression algorithms, segmentation algorithms, association algorithms, sequence analysis algorithms and classification algorithms. In the medical field, there has not been a specific study that has incorporated two or more data mining algorithms hence limiting decision making levels by medical practitioners. This study identified the extent to which K-means algorithm cluster patient characteristics; it has also evaluated the extent to which random forest algorithm can classify the data for informed decision making as well as design a framework to support medical decision making in the treatment of HIV/AIDS related diseases in Kenya. The paper further used random forest classification algorithm to compute proximities between pairs of cases that can be used in clustering, locating outliers or (by scaling) to give interesting views of the data.
Index Terms: Clustering, Classification, K-Means, Random Forest , Data Mining, Big Data
————————————————————
1.
Introduction
The need for rapid access to information in order to support critical decisions in public health cannot be disputed; however, development of such systems requires an understanding of the actual informational requirements of the practitioners. The motivation for handling data and performing computation is the establishment of a retrieval mechanism for information which can be referred to as data mining [1]. Data mining is the exploration of large datasets to extract hidden and previously unknown patterns, relationships and knowledge that are difficult to detect with traditional statistical methods [2]. Goebel [3] outlines data mining as the exploration and analysis of large quantities of data in order to discover valid, novel, potentially useful, and ultimately understandable patterns in data. Chunfei and Zhiyi [4] adds that data mining brings a set of tools and techniques that can be applied to discover hidden patterns that provide healthcare professionals an additional source of knowledge for making decisions. Data mining algorithms applied in healthcare sector play a major role in prediction, diagnosis and management of the diseases. There are different types of data mining applications found in the medical field such as medical device industry, pharmaceutical Industry and hospitals.
To find the useful and hidden information from the database is the objective behind the application of data mining [1]. In the recent past, management of HIV/AIDS in developing countries has received a paradigm shift from the traditional diagnostic and treatment to use of technology for effective service delivery [5]. Use of technology in HIV management involves various mechanisms such as centralized information management system which reduces physical movement of documents as well as automated data capture system. Increased automated system enable policy makers and practitioners implement models geared towards increased service delivery in health care systems [6]. Various Information Communication (ICT) technologies applied in management of HIV/AIDS include the internet, intelligent computer systems, mobile devices and web have resulted in an increasing use of these technologies in provision of medical care. These technologies have brought benefits to medical practitioners and patients [7]. The main challenge that medical practitioners face is how to relate various symptoms causing same opportunistic disease and a methodology of classifying same information to enhance faster diagnosis and the management of the disease.
1.1 Data Mining Algorithms
An algorithm in data mining (or machine learning) is a set of heuristics and calculations that creates a model from data. To create a model, the algorithm first analyzes the data provided looking for specific types of patterns or trends. The algorithm uses the results of this analysis over much iteration to find the optimal parameters for creating the mining model. These parameters are then applied across the entire data set to extract actionable patterns and detailed statistics. Although there are various data mining techniques used to make collected data adoptable, most of medical related data required techniques that can cluster various disease and patient characteristics as well as segment related outcomes. The outcomes can be used to support decision making for diagnosis and treatment of HIV/AIDs.
__________________________________
Gladys Iseu, School of Computing and Information
Technology, Jomokenyatta University of Agriculture and
Technology, P. O. BOX 62000-00200 Nairobi,
Kenya,Email: [email protected]
Waweru Mwangi, School of Computing and Information
Technology, Jomokenyatta University of Agriculture and
Technology, P. O. BOX 62000-00200 Nairobi,
Kenya,Email: [email protected]
Dr. Michael Kimwele, School of Computing and
62
1.2 Big Data Clustering and Classification
There is a challenge in patient treatment process as data used for reference keeps growing, with new outcomes reported every time and particular on opportunistic disease that affect people living with HIV/AIDS [8]. In Kenya, medical practitioners accumulate patients data that if well utilised could be fundamental in diagnostic , treatment and management of recurring opportunistic diseases that could be associated with accidents, age, allergies, blood pressure, cholesterol, diabetes, hypertension and heart disease among other opportunistic diseases related to HIV/AIDS. Previous data use has been managed using various techniques including decision trees, neural networks, bagging, kernel density and vector machines have been used for data mining and formulation of outcomes that contribute to literature but have not solved the need for data mining and disease management [9]. Lack of usable data outcomes among medical practitioners have delayed decision making process for patients leading to over 75% fatalities among patients seeking health care support especially on the chronic opportunistic diseases [5].
2 Related Work
2.1 K-means
Jain and Dubes (1988) argues that cluster analysis organises data by abstracting underlying structure either as a grouping of individuals or as a hierarchy of groups. The representation is investigated to group data according to preconceived ideas or to suggest new experiments. Various studies have been carried out on medical diagnosis system incorporating artificial intelligence and expert system. The two techniques adopt different data mining techniques to provide results for decision making. Singla, Grover and Bhandari [10] analyzed medical expert systems for diagnosis of various diseases. The paper found that diseases should be treated well and on time because they can lead to many health problems. The hybridized k-means clustering algorithm uses Principal Component Analysis (PCA) method on data and then k-means clustering is applied on resultant reduced data for analyzing high dimensional data [11]. These problems may become causes of death. Additionally, K-means clustering is a data mining/machine learning algorithm used to cluster observations into groups of related observations without any prior knowledge of those relationships [12] The k-means algorithm is one of the simplest clustering techniques and it is commonly used in medical imaging, biometrics and related fields. The traditional K-Means clustering algorithm works on the data set with the attributes of numerical types [1, 2, and 3]. Clustering divide the data set into classes using the principle of ―Maximum intra class similarity and Minimum inter class similarity‖.
Figure 1
Figure 1 incorporates k data points which are selected to be seeds more or less arbitrary. Each of these variables is an embryonic cluster with only one element where k is 3.
Figure 2
Initial Clusters and inter-cluster boundaries (from Berry and Linoff, [14] In Kenya, Wakoli, Orto and Mageto [15] used K-means clustering algorithm in medical claim and abuse detection by programming the Java and MySQL database programming. Data was converted to numeric data and listed to patients and the outcomes showed that all companies had internal mechanisms to control fraud although 47 percent of the internal controls were not efficient.
2.2 Random Forest
order to get observable patterns that can assist the medical practitioners in decision making. Random forest has been adopted in the study because K-means is an efficient algorithm which only gives the clusters /patterns on a particular area of study and the results cannot help in decision making.
3 The Proposed framework
3.1 K-Means
Cluster analysis using K-means algorithm segments data in three clusters Centre guesses. The process alternates the following steps to convergence; (a) For each data point, the closest cluster center (in Euclidean distance) is identified (b) Each cluster centre is replaced by the coordinate –wise average of all data points that are closest to it, the comparative advantage of K-means to other clusters approaches is the adaptability to top-down approach. The K means algorithm is intact for situations in which all variables are quantitative type and have squared Euclidean distance represented as:
2 ' 2 1 ' ' ) ( ) ,
( i i
P j j i ij i
i x x x x x
x
d
chosen as the dissimilarity measure. The weighted Euclidean
distance can be redefining
x
ij values within point scatter. To minimize a ―loss‖ function that characterizes the degree to which cluster goal is not met as outlined in:
k
k ci kci k
i i x x d c W
1 () ( )
' ' ) , ( 2 1 ) (
is developed. The equation characterizes the extent to which observations assigned to same cluster tend to be close to one another, referred to ―within cluster‖ point scatter since‖
kk ci k c i k
ii k i c ii k
k ci kci k
ii d d
d T
1 () ( ) ( )
1 () ( ) '
' ' ' ' ' ( ) 2 1 2 1
or T w(c) B(c) where ' ( , ') i i
ii d x x
d and T equal to
total scatter level.
Thus the scatter is written as
2
1 () ( )
' ' ) , ( 2 1 ) (
kk ci kci k
i i x x c W = 2
1 ()
^
K
k ci k
k i
k
x
x
N
where xk (x1k,..., xpk ) is the main vector associated with
kth cluster and
N
i
k I c i k
N
1
) ) (
( . The criteria is
minimized by assigning N observation to K clusters in such a way that with each cluster average discounting of observations
for cluster mean is minimized such that
m1,..., mk
and 2min arg )
(i xi mk
c for 1 K k . To validate
k-means clusters as weighted sum of validity of individual
clusters is presented as:
k
i
i ivalidity C w
validity 1
) ( . The
validity can either be cohesion, separation or both of the quantities analyzed. The validity is also presented in a
MATRIX as
i i C y C x
i proximity x y C
Cohension ( ) ( , ) and
j i C y C x ji C proximity x y C
Separation ( , ) ( , ) which
presents a shaded display of the original data matrix
3.2 Random Forest
According to Jones and Linder, 2015 [18] random Forest adopts various outcomes from other algorithms such as K-Nearest Neighbor and K-Means. Some of the outcome variables may be continuous, discrete, censored survival and multivariate combination. One advantage of Random Forest is that it does not require distributional assumptions [19]. The result from Random Forest will lead to classifications and regression tree (CART) which are useful in decision making [20]. CART method relies on repeated partitioning of the data to estimate the conditional distribution of a response given a set of explanatory variables. Let the decision expected from K-means clusters be: y (y1,..., yn)T and the set of cluster observation be a matrixx (x1,..., xp)where
T nj ij
j x x
x ( ,..., ) forj(1,..., P). The goal of the algorithm
is to partition y conditional on the value of x in such a way the resulting sub-groups of y are as homogeneous as possible. The algorithm works by considering every unique value in each predictor as a candidate for a bury split and calculating the homogeneity of subgroups and outcome variable that would result by grouping observations that fall on either side of the variable. The outcome will find homogenous decision of ygiven the decision tree. The classification error when using
modal category of outcome variable further splits data justified because of decrease in error. Thus let ymm y1mm,..., ynmm)
and x(m) (x1(m),..., xpm)be data at the current
nodeM ,x(m), the explanatory variable that is to be used for a
split with unique values
( )
( )
) ( ,..., 1 , m m i m n i xC andcC (m)of the value
considered for a split. The data in decision nodes resulting from the split in c are ( (m1))
y and (y(m))where )
( (m1)
y contains all elements of ( ) ) (m y
whose corresponding values ofx3(m) c . The gain (or reduction in error) from a split at node m is predictor x3at value c is defined as: Where (mi)
n and n(m)are the number of cases that fall to the right and to the left of the split and L(.) is the loss function. If the outcomes are categorical, the unique categories of
)
(y(m) are set as D(m)
yi(m)
,i
1,..., n(m)
in order to assess to assess impurity of the node we first calculate the proportion of cases pertaining to each class d D(m)and denote as p(m)(d). Denote further the class that occurs most frequent on^ ) (m y
64
) ( 1 ^ ^ ) ( ) ( ) ( ) ( ) ( ) ( 1 ) ( 1 ) ( m n i m m m m i m m y p y y n y Lmcwhere (.) is the indicator function that is equal to one when its input is true [21]. To further measure the loss in decision impurity of the node, when the outcome is continuous, then the mean squared error (MSE) is used [22] [23]. Then,
) ( 1 ^ 2 ) ( ) ( ) ( ) ( ) ( m n i m m i m y y y Lmsewhere the predicted value ^
) (m y
is usually the mean of other
observations in(y(m)). The extension to ordered discrete predictions is straight forward. Since the values of a continuous random variable are discrete, the partitioning algorithm describe above works in the same way for ordered discrete random variable.
4.0 Experimental Analysis and Results.
To evaluate the efficiency and effectiveness of our framework R data mining tool was used to create the clusters and also for data classification in order to achieve better results.
4.1 Variable characteristics
To establish the key variable characteristics and different clusters, the data was subjected in R analysis, to establish the various clusters as well as decision trees for adoption in HIV/AIDS management. Variables analyzed in the study included age of the patient, gender of the patient, age at the registration of the patient, age at the start of the medicine and the CD4 Count.
Clu ste r Clust er size Age of patient( years) Gender of patient Age at registrat ion
Age at the start of medicine
CD4 count
1 12 41.13 1.73 37 37.13 46.17
2 3 24.12 1.62 20.1 22 368.25
3 16 29 2 26.5 27 970.5
4 6 39.8 1.71 35.5 36.7 281.23
5 17 33.4 1.72 28.1 28.7 170.9
6 8 62.8 1.6 57.9 58.4 161
7 19 29.6 1.4 25.9 27.4 483.2
8 42 30.2 1.5 26.5 29 719.5
9 6 18.5 1.75 10.25 13 610
10 14 2 2 1 1 1943
Table 1: Mean of patient characteristics
From Table 1, the cluster sizes were between 3 and 42. On the age of the patients, only cluster 10 has a mean age of 2 years representing children, while cluster 9 represented the teens at a mean of 18.5 years. In cluster 6 with 8 members, the mean
age was 62.8 years. Of the patient gender, only cluster 3 and 10 has only females represented by 2, while the rest has a mixture of both male and females in the data set. From the analysis there is a small difference between the time of registration of the patient to Comprehensive Care Centres (CCC) facility and the age of start for medication. According to American Association for Clinical Chemistry, CD4 count between 500-1,200 cells.mm cubed in adults and teens reflect normalcy-existence, however, for low count, the patient is put under treatment. From the analysis cluster 3, 8, 9 and 10 have normal coexistence while 1 and 6 needs to be put in treatment.
4.2 Clusters Centers
The partitioned encoder C *(i) achieves the required clusters based on dissimulations d(xi,xi')between every pair of observation in a Euclidean distance. The Euclidean distance represented as:
2 ' 2 1 ' ' ) ( ) ,
( i i
P j j i ij i
i x x x x x
x
d
is chosen as the dissimilarity measure that will define various cluster centers represented in the Table 2 below:
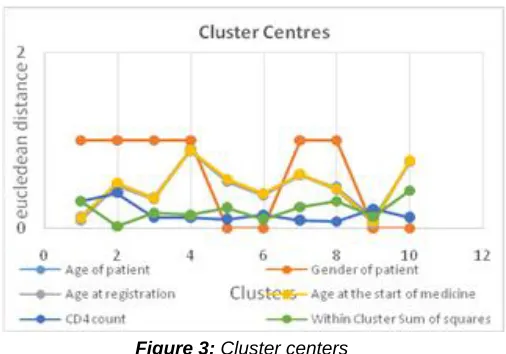
Clust er Age of patient Gend er of patien t Age at registra tion Age at the start of medicin e CD4 count Within Cluster Sum of square s 1 0.132 1 0.093 0.12 0.307 0.307 2 0.502 1 0.486 0.514 0.4 0.021 3 0.351 1 0.331 0.344 0.123 0.18 4 0.894 1 0.879 0.89 0.119 0.149 5 0.54 0 0.534 0.559 0.101 0.237 6 0.386 0 0.377 0.398 0.151 0.102 7 0.607 1 0.606 0.616 0.093 0.246 8 0.466 1 0.441 0.451 0.078 0.313 9 0.111 0 0.062 0.076 0.218 0.129 10 0.755 0 0.768 0.77 0.122 0.431 Total 4.744 6 4.577 4.738 1.712 2.115 Mea
n 0.474 0.6 0.4577 0.4738 0.171 0.212 Table 2: Euclidean distance of cluster centers
Figure 3: Cluster centers
Figure 3 shows measures of compactness of different clusters.
Identified xnis a vector representing the nth data point and
j
u is the geometric centroid of data point insj
. The within cluster sum of squares reduces number of iterations to achieve said variable as outlined by
2 min
arg )
(i xi mk
c such that in order to avoid the need
for an oracle to set a nominally correct number of clusters, a generic index of association, of concordance, must apply to data partitions whose inherent labels are not known in advance, should be normalized and not strongly dependent on marginal frequencies in each cluster partition and preferably apply to comparisons between partitions with different numbers of clusters [24]. To produce a shaded display of the original data matrix in which rows and columns are permutated according to K-means algorithm as outlined by Gruvaeus and Wainer [25] who used matrix option which was improved by Ling [26] to represent the magnitude of each number in the matrix. The matrix distance represented by
i i
C y
C x
i proximity x y C
Cohension ( ) ( , ) and
j i
C y
C x j
i C proximity x y C
Separation ( , ) ( , ); the matrix is
presented in Annex Table 1 and 2. The summaries are presented in Figure 2 below:
Figure 4: Cluster validity and Euclidean distance
From figure 4, the Euclidean distance provides a Euclidean space points which are vectors for real dimension. The vector components are coordinates represented points. Notably, all the distances are provided in the Euclidean space. It is important to note that (i) The distances are always non-negative; and only the distance between a point and itself is 0 (ii) The distance is systematic and it doesn’t matter in which order you consider the points when computing their distances; and (iii) the distances measures which obey the triangle inequality; the distance from x to y toz is never less than the distance going for x to z directly. These distances are therefore represented in figure 2, which include the diameter distance, the median distance, the silwidth, the separation distance and separation toother.
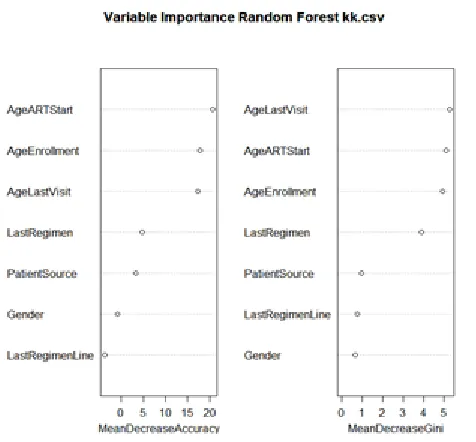
4.3 The Radom Forest analysis
The random forest algorithm analysis was analyzed as: randomForest(formula = ExitReason ~ .,
data = crs$dataset [crs$sample, c (crs$input, crs$target)], ntree = 1000, mtry = 2, importance = TRUE, replace =
FALSE, na.action = na.omit)
Type of random forest: classification Number of trees: 1000
No. of variables tried at each split: 2 OOB estimate of error rate: 11.76%
The results show that there is a confusion matrix which has a set of bootstrap data sets which does not contain a particular record from the original set. The data set is known as
out-of-bag (OOB) created by classifiers (random S trees) for each
) , (xi yi
in the original treatment setT . The OOB as outlined by Breiman [20] provides empirical evidence for estimates that are accurate as using a test of the same size as the patients set. The confusion matrix for the 143 patients was identified as presented.3:
Table 3: Confusion Matrix (Analysis of the OOB)
Confusion
matrix Death Lost Stop Transfer
Death 0 13 0 1
Lost 2 165 0 0.012
Stop 0 3 0 1
Transfer 0 4 0 1
The confusion matrix represented by ; ) ( )
( ) )
( )
( (
) (
) (
) (
) ( ) ( )
(
m m
m m
m m m
m
y L n n y L n n y
L
y i
i
66 Figure 5: Graphical representation of a Confusion Matrix
From figure 5, it’s observed that death and stoppage of services offered by health provides are surpassed by patients been lost (165) and (13) respectively; and thus need for an innovative mechanism to improve retention of the patients. It’s also notable that patients transfer is almost linear among all other intervention mechanisms provided in the study. The random forest and related methods represented as
( )
( )
) (
,..., 1
, m
m i m
n i
x
C and cC(m) is a
conditional inference forest (CIF) which is both tree building method that has been incorporated successful in bio-informatics. Using Strobl et al, [28] the analysis presents correlated outcomes for splits of the trees employed in the computations as presented in figure 6.
Figure 6: Conditional Inference Forest
The measure for loss in decision impurity of nodes with mean squared error (MSE) presented in
) (
1
^ 2 ) ( ) ( )
(
) (
) (
m
n
i
m m i m
y y
y Lmse
has a predicted value ^
) (m y
shown in Figure 6. The measures
are computationally traceable choice for large datasets and are unbiased under the hypothesis set. The predictor has a coefficient 0 in the generating model, and thus the predicted
value ^
) (m y
has a zero coefficient. It is notable that the last regimen, the last regiment line, gender of the patients and the patient’s source provides a high accuracy for decision for patient’s management. To endure adherence, the patients age, age of last visit and age of ART start provides an environment for patients management.
Correlation relationship between management and various variables
The determination of the HIV management is explained by Table 4
Table 4: Correlation Coefficient
Correlation summary using the 'Pearson' covariance. First CD4
Count
Second CD4 Count
Source of Patient for Treatment First CD4 Count 1.000 0.992 0.063 Second CD4 Count 0.992 1.000 0.269 Source of Patient for
Treatment 0.062 0.269 1.000
Access for ARV
Treatment -0.003 0.046 -0.123
e7: Random Forest Probabilities for HIV Management
The management of HIV involves understanding the viral load level in a patient. The management majorly involved access to Anti-retroviral drugs (ARVs) as part of treatment. From the sampled patients, the probability is that 5% of the patients will go without treatment. In addition, 74% of the patients who achieved the first CD4 test and 21% of the patients referred from the different sources will determine the age of starting treatment. Among 95% of these patients stating treatment, the age will be required to determine the ARVs dosage.
5.
TOOLS USED
There are many tools available for processing data and extracting user information from collection of datasets. In this paper R statistical package was used to train the data sets and extract various classifications from the datasets
6. Summary and Conclusions
The application of data mining tools in medical data is to extract hidden information using data mining techniques especially in the analysis of this data. Therefore, the choice of the clustering and classification algorithms used in disease management, diagnosis and treatment is certainly an essential issue to be considered.
6.1 Correlation between variables
In the management of HIV/AIDS, K-means clustering has been adopted to put together different patient’s characteristics that are used by health care providers to determine the extent of distance between variables. Ten (10) clusters were created from K-means model and are determined by the Euclidean distance between variables that provides a dissimilarity
measure and error to the mean. Notably, gender as a variable has the largest mean disparity to the origin because it’s not continuous and it’s a base variable for all other variables. Cluster center and sum of squares reduces the number of iterations to achieve the said variable. The data is thus normalized to the correct number of clusters [24]. The Euclidean distance which is always non-negative provides a triangular inequality that incorporates the diameter distance, the median cluster, the silwidth and the average toother for determination on the size of clusters. Random forest provides an OOB and ROC classifier for (xi,yi)for original treatment set T also presenting an empirical evidence for estimation that are correlated as using a test of the same size as patients set outlined in a confusion matrix which presents a sensitivity tradeoff between treatment and respective numbers and this explains why most patients are lost due to poor health management [27]. Management of HIV/AIDS patients with coefficient 0 are comparatively traceable choice for large and unbiased set that incorporate last regiment, last regimen line, the gender of the patient and patients source. It has been identified that gender of the patient, patients’ age, age of the last visit and age of the start of ART provides an environment for health care providers to manage the patients’ adherence to treatment. The main goal of medical data mining is to extract hidden information using data mining techniques especially in the analysis of this data. Therefore, the choice of the clustering and classification algorithms used in disease management, diagnosis and treatment is certainly an essential issue to be considered Random forest has been used in this study to classify patients based on their characteristics from the results obtained after clustering. Random forest has proved the accuracy and promising results that can assist in decision making. The use of K-means algorithm for clustering and Random Forest for classification helps to avoid false prescriptions during low CD4 counts. This is achieved by minimum error for results of employing optimal algorithm. The study considered delays on decision making through future enhancement for present work which may facilitate identifying the decision differentiated CD4 counts and opportunistic diseases in HIV/AIDS management.
7. References
[1] Fathima, S and Sheriff, A. (2012). Exploring Support Vector Machines and Random Forests for the Prognostic Study of an Arboviral Disease. International Journal of Computer Applications 57(9):6-10, November 2012.
[2] Hatamlou, A., 2013. Black hole: A new heuristic optimization approach for data clustering. Information Sciences 222, 175-184
[3] Goebel, V (2015). Knowledge Discovery in Databases (KDD) - Data Mining (DM) Department of Informatics, University of Oslo
[4] Chunfei Zhang, Zhiyi Fang (2013) ―An Improved K-means Clustering Algorithm‖, Journal of Information & Computational Science, Volume 10, No. 1, 2013, pp :193-199.
375 n=144 100%;
age.of.patient >= 10
314 n=137 95%;
age.at.start.of.medicine >= 22
511 n=30 21%;
Patient Source >= 2.5 259
n=107 74%; 1st test < 232
1576 n=7 5%
609 n=14 10% 425
n=16 11%
339 n=17 2%
68 [5] WHO (2013) Consolidated guidelines on the use of
antiretroviral drugs for treating and preventing HIV infection; HIV/AIDS Department 20, Avenue Appia CH-1211 Geneva 27 Switzerland
[6] Ndavi, P.M., S. Ogola, P.M. Kizito, and K. Johnson. 2009. Decentralizing Kenya’s Health Management System: An Evaluation. Kenya Working Papers No. 1. Calverton, Maryland, USA: Macro International Inc.
[7] Hodge G, Flower R, Han P.(1999) Effect of factor VIII concentrate on leucocyte cytokine production: characterization of TGF-beta as an immuno modulatory component in plasma-derived factor VIII concentrate. Sep; 106(3):784-91
[8] Letouz, E (2011). Big data for development: Challenges and Opportunities: Global Pulse, New York
[9] Khamis, H, Cheruiyot,K and Kimani, S (2014) Application of k- Nearest Neighbour Classification in Medical Data Mining; International Journal of Information and Communication Technology Research, Volume 4 No. 4, April 2014 ISSN 2223-4985
[10]Singla, J, Grover, D and Bhandari, A (2014). Medical Expert Systems for Diagnosis of Various Diseases, International Journal of Computer Applications (0975– 8887) Volume 93–No.7, May 2014
[11]Rosenblatt,F (1958) The perceptron: A probabilistic model for information storage and organization in the brain. Psychological Review, 65, 386–407, 1958 (Reprinted in Neurocomputing (MIT Press, 1988),
[12]Rajinikanth T, Balaram, V and Rajasekhar, N (2014) ―Dhinaharan Nagamalai, Analysis of Indian Weather Data Sets using Data Mining Techniques", Dhinaharan Nagamalai et al. (Eds) : ACITY, WiMoN, CSIA, AIAA, DPPR, NECO, Volume 1, Issue 2, 2014, pp. 89–94.
[13]Khalilia, M, Chakraborty, S and Popescu, M "Predicting Disease Risks from Highly Unbalanced Data using Random Forest", BMC Medical Informatics and Decision Making, 2011, 11:51.
[14]Berry, M. and Linoff, G. (2000) Mastering Data Mining. John Wiley & Sons, Inc., NewYork
[15]Wakoli,L, Orto, A and Mageto, S (2014). Application of The K-Means Clustering Algorithm In Medical Claims Fraud / Abuse Detection, " Application of The K-Means Clustering Algorithm In Medical Claims Fraud / Abuse Detection" , International Journal of Application or Innovation in Engineering & Management (IJAIEM) , Volume 3, Issue 7, July 2014 , pp. 142-151 , ISSN 2319 - 4847.
[16]Shams,I, Ajorlou, S and Yang, K (2013). A predictive analytics approach to reducing avoidable hospital
readmission Department of Industrial and Systems Engineering, Wayne State University , Detroit, MI
[17]Shanu, S, Newman, S and Marquardt, J (2014). Population Cost Prediction on Public Healthcare Datasets, http://www.commonwealthfund.org/publications/fund- reports/2014/jun/mirror-mirror
[18]Jones, Z and Linder. F (2015). Exploratory Data Analysis using Random Forests, Big Data Social Science‖
[19]Ferńandez-Delgado, M., Cernadas, E., Barro, S., and Amorim, D. (2014).Do we need hundreds of classifiers to solve real world classification problems? Journal of Machine Learning Research, 15:3133–3181
[20]Breiman, L. (2001). "Statistical Modeling: the Two Cultures". Statistical Science 16 (3): 199–215. doi:10.1214/ss/1009213725
[21]Mingers,J (1989) . An empirical comparison of selection measures for decision-tree induction. Machine Learning, 3,319-342
[22]Shwaran, H, Kogalur, B, Blackstone, H, and Lauer, S (2008) Random Survival Forest, Cleverend Clinic, Columbia University Vol.2 No. 3, 841-860
[23]Hothorn,T, Hornik, K & Zeileis, A (2006) Unbiased Recursive Partitioning: A Conditional Inference Framework, Journal of Computational and Graphical Statistics Volume 15, 2006 - Issue 3
[24]Kuncheva L.I., D.P. Vetrov, Evaluation of stability of k-means cluster ensembles with respect to random initialization, IEEE Transactions on Pattern Analysis and Machine Intelligence, 28 (11), 2006, 1798-1808
[25]Gruvaeus, G. and Wainer, H. (1972).Two additions to hierarchical cluster analysis. British Journal of Mathematical and Statistical Psychology, 25, 200-206.
[26]Ling, R.F (1973). A probability theory of cluster analysis, Annals of the American Statistical Association 68,159-164
[27]Wigton RS, Connor JL, Centor RM (1986) Transportability of a decision rule for the diagnosis of streptococcal pharyngitis. Arch Intern Med. 1986 Jan; 146(1):81-3.
[28]Breiman, L. (2001a). Random Forest, Machine Learning, 45(1): 5-32