www.pharmascholars.com
14
Original Article
CODEN: IJPNL6
VALIDATED
SPECTROPHOTOMETRIC
AND
SPECTROFLUORIMETRIC
METHODS FOR THE DETERMINATION OF PREGABALIN IN ITS PURE AND
DOSAGE FORMS USING EOSIN
Mohammed I. Walash, N. El-Enany and H. Askar*
*Department of Analytical Chemistry, Faculty of Pharmacy, University of Mansoura, 35516,
Mansoura, Egypt
*Corresponding author e-mail: [email protected]
Received on: 07-12-2015; Revised on: 24-12-2015; Accepted on: 28-12-2015
ABSTRACT
Two sensitive spectrophotometric and spectrofluorimetric methods were developed for
determination of pregabalin (PGB) in its pure and pharmaceutical dosage forms. For
spectrophotometric method (Method I), absorbance value of a binary complex with eosin was
measured at 550 nm at pH 3.5. The absorbance-concentration plot was rectilinear over the range
of 4-80 μg mL
-1. For spectrofluorimetric method (Method II), the decreasing in the fluorescence
intensity of the native fluorescence of eosin was measured at 544 nm after excitation at 304 nm
at the same pH. The fluorescence-concentration plot was rectilinear over the range of 0.05-1 μg
mL
-1. Statistical comparison of the results with those of the reference method indicated that there
was no significant difference between the two methods respectively.
Keywords
: Pregabalin (PGB), eosin, spectrophotometric, spectrofluorimetric, dosage forms.
INTRODUCTION
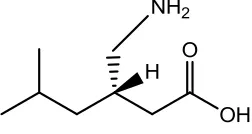
Pregabalin (PGB), (S)-3-(amino
methyl)-5-methylhexanoic acid, is lipophilic GABA (g-aminobutyric acid) analogue (Fig.1) , but it is inactive at GABAA and GABAB receptors [1]. The main site of action of PGB is the a2δ subunit of presynaptic, voltage-dependent calcium channels which are widely distributed throughout both peripheral and central nervous system. PGB binds to the a2δ subunit potently and modulates calcium influx at nerve terminals, and, thereby, reduces the release of several neurotransmitters, including noradrenaline, glutamate , serotonin, dopamine and substance P. These effects result in the analgesic, anticonvulsant and anxiolytic activity exhibited by PGB. Recently, PGB has been approved by FDA for the treatment of spinal cord
injury and indicated as the first drug of choice for treatment of fibromyalgia [2].
Pregabalin is not yet the subject of monograph in any pharmacopeia. The literature survey revealed that few analytical methods have already been published concerning the analysis of PGB in its pharmaceutical
dosage forms and biological fluids via,
spectrophotometric [3-11], specrtofluorimetric [11-13] and
chromatographic methods [14-31]. The chromatographic
methods require high cost solvents in addition to elaborate treatment. Regarding spectrophotometric methods for determination of PGB, some of them don’t offer high sensitivity [7,9,10] or need tedious
extraction procedures [11]. Meanwhile, some of the
spectrophotometric methods recommended the
measurement of absorbance in the near UV region
International Journal of Pharmacy
www.pharmascholars.com 15
where interference most probably occurs [6,9] or use nonspecific reagent (Potassium iodide/potassium iodate) that don’t offer suitable linearity range [8].
Objectives of the study: In this study, PGB was determined in its pharmaceutical formulations using
two sensitive spectrophotometric and
spectrofluorimetric methods. Proposed methods were performed without prior organic extraction, so they were simple and time-saving techniques. Eosin reagent, used in the derivatization process of the present study, was available and not highly expensive. Calibration graphs were constructed and showed a linear dependence of ∆F and absorbance values on the drug concentrations over the range of 4-80 µg mL-1
and 0.05-1.0 µg mL-1 for methods I and II
respectively. A comparative spectrophotometric method [5], which required heating at 55±5°C for 10 min, was used to analyze the same sample. Student's t-test and variance ratio F-test were applied to the obtained results for a statistical comparison. Validation steps were not tedious and indicated high sensitivity, accuracy, precision and robustness of the results.
MATERIALS AND METHODS
Apparatus: The spectrophotometric measurements (P/N 206-67001) were made using Shimadzu UV-Visible 1601 PC Spectrophotometer (Kyoto, Japan).
The recording range was 0-1.0. The
spectrofluorimetric measurements were established using Perkin Elmer LS 45Luminescence Spectrometer equipped with 150 Watt Xenon arc lamp and quartz cell (1cm). A Consort NV P-901 digital pH-meter (Belgium) calibrated with standard buffers was used for checking the pH of the buffer solution used.
Materials: Pregabalin pure sample was kindly supplied by Pfizer company (Sandwich, UK).The purity of PGB was found to be 99.5% according to the reference method [5].
Pharmaceutical preparations: Lyrica® capsules (labeled to contain 75 mg pregabalin per capsule), Batch # 3004, a product of Pfizer Co. and obtained from local pharmacy.
Reagents: All chemicals and reagents used in the study were of Analytical Reagent grade, and the solvents were of spectroscopic grade. Distilled water was used as a solvent throughout the study. Eosin (
Riedel-De-Haen AG-D-3016 Seeize 1) 5x10⁻³ M
aqueous solution for spectrophotometric method and 4.8 ×10⁻⁵ M aqueous solution for spectrofluorimetric method. Both solutions were freshly prepared in
distilled water and further diluted with the same solvent to the appropriate concentration. Sodium acetate and acetic acid (BDH, UK) were freshly prepared as 0.2 M aqueous solutions. Acetate buffer solution (0.2M) was prepared by mixing appropriate volumes of 0.2 M sodium acetate and 0.2 M acetic acid and adjusting the pH to 3.5 using pH-meter.
Stock and standard solutions: A stock standard solution of PGB of 200 µgmL-1 was prepared by dissolving 20.0 mg of PGB in 100.0 mL of distilled water using an ultrasonic bath. It was then further diluted with the same solvent as appropriate to obtain the working solutions. Standard solution was kept in the refrigerator and remained stable for two weeks.
Construction of calibration matrices and curves
Spectrophotometric method (Method I):
Accurately measured aliquots of PGB covering the working concentration range (4-80 µg mL-1) were transferred into a series of 10 mL volumetric flasks.
To each flask, 1.5 mL of 5x10⁻³ M eosin solution was
added followed by 2.0 mL of acetate buffer (pH 3.5) and mixed well. The solutions were completed to the volume with distilled water. The absorbance value was then measured at 550 nm against an appropriate blank which was prepared simultaneously. The
measured absorbance was plotted vs the final
concentration in µg mL-1 to get the calibration curve. Alternatively, the regression equation was derived.
Spectrofluorimetric method (Method II): The same procedure adopted in spectrophotometric
method, was followed except that, 1.5 mL of 4.8x10
-5M eosin was used and the standard solution was
diluted to obtain the final concentration range of 0.05-1 µg mL-1. The fluorescence intensity of the resulting solution was measured at 544 nm after excitation at 304 nm and the difference in the fluorescence intensity (ΔF) was plotted vs the final concentration of the drug (µg mL-1) to get the calibration curve. Alternatively, the regression equation was derived.
Application of the proposed methods to the determination of PGB in pure form: Aliquots of PGB standard solution covering the working concentration range were transferred into a series of 10 mL volumetric flask and the procedure described under "Construction of the calibration graph" was followed. Finally, the % recoveries were calculated using either the corresponding regression equation or from the previously constructed calibration graph.
www.pharmascholars.com 16
well. A weighed amount of the powdered capsules equivalent to 20.0 mg of PGB was then transferred into a small conical flask and extracted with 3x30 mL of distilled water. The extract was filtered into a 100 mL volumetric flask. Few mLs of distilled water were used for washing of the conical flask. These washings were passed into the same volumetric flask and solutions were made up to the volume with the same solvent. Aliquots covering the working concentration range were transferred into a series of 10 mL volumetric flasks. The procedure described under "Construction of calibration graph" was applied. Finally, the nominal content of the capsules was determined either from the previously plotted calibration graph or using the corresponding regression equation.
RESULTS AND DISCUSSION
PGB is an aliphatic compound and lacks any chromophores or auxchromes which are essential for light absorption, so it has no absorbance. However, a spectrophotometric method was reported for the determination of PGB based on the direct measurement of the absorbance at 210 nm [6]. In contrast, other reports confirmed that, the drug has no specific absorbance in the UV-region [9,12]. This renders its spectrophotometric determination a challenging problem. Such problem is highly aggravated especially when it is necessary to determine the studied drug in its pharmaceutical dosage forms. However, presence of a basic primary amino group makes the drug susceptible to
derivitazation with reagents containing acidic
functional group such as eosin initiated the present study.
Eosin has been utilized for the determination of many pharmaceutical compounds of interest either through
spectrophotometric measurment such as,
fluoroquinolone antibacterials [32], gliclazide [33],
ramipril and enalapril [34] or through
spectrofluorimetric measurement such as, ramipril [35], fluphenazine and olanzapine [36] and some histamine H1-receptor antagonists [37].
In the present work, PGB was found to form an ion pair red complex with eosin reagent at pH 3.5 with maximum absorbance at 550 nm (Fig.2). The complex was formed mainly due to the electrostatic interaction between the basic studied drug and acidic functional group of eosin under acidic pH. The formed ion pair complex is not fluorescent, therefore, the decrease in the fluorescence of eosin upon the addition of the drug was the basis for the
spectrofluorimetric measurement at 544 nm after excitation at 304 nm (Fig.3).
Method Development and Optimization: The spectrophotometric and spectrofluorimetric properties of the reaction product as well as different experimental parameters affecting its development and stability were studied and optimized carefully. Such factors were changed individually while the others were kept constant. These factors included; volume of eosin, type of buffer, volume of buffer, pH and time of reaction. Experimental trials could be summarized as follows:
Effect of volume of eosin: The optimum volume of eosin reagent was determined for the studied drug. For the spectrophotometric method, it was found that, increasing volume of (5 × 10⁻³ M) eosin resulted in a gradual increase in the absorbance value of the reaction product up to 1.5 mL and then it began to decrease till 2.5 mL, so 1.5 mL of eosin (5 × 10⁻³ M) was a suitable volume to develop the maximum absorbance. For spectrofluorimetric method; the effect of volume of eosin (4.8 × 10⁻⁵ M) on the decrease of the fluorescence intensity of eosin was studied using 1 µg mL-1 PGB. It was found that, increasing volume of (4.8 × 10⁻⁵ M) eosin resulted in a gradual increase in ΔF (difference in the fluorescence intensity) up to 1.5 mL and then it began to decrease also till 2.5 mL, therefore 1.5 mL of eosin (4.8 × 10⁻⁵ M) was suitable to develop the
maximum absorbance (Fig.4).
Effect of pH: Since pH has an effect on the ionization of eosin, it is a critical factor in the complex formation. For the spectrophotometric method; the effect of pH of 0.2 M acetate buffer on the absorbance value of the reaction product was studied over the pH range 3.0 – 5.0. It was found that, increasing values of pH resulted in a subsequent increase in the absorbance of the reaction product up to 3.5. After which, there was a decrease in the absorbance value. For spectrofluorimetric method, it was also found that increasing pH values resulted in a subsequent increase in Δ F up to 3.5. After which a decrease in Δ F was achieved (Fig.5). Therefore, 0.2 M acetate buffer of pH 3.5 was chosen as the optimum pH throughout the study.
www.pharmascholars.com 17
of 0.2 M acetate buffer (pH 3.5) was sufficient to
produce the maximum ∆F (Fig.6).
Effect of time of reaction and standing: Regarding the effect of time on the intensity of the final color in the spectrophotometric method; it was found that, the intensity of the final color was stable for 1 h without precipitation of the formed ion pair complex. In spectrofluorimetric method, it was found that the decrease in the fluorescence intensity of eosin was immediate upon addition of PGB and remained constant for more than 30 min.
Effect of diluting solvent: The effect of diluting solvents on the absorbance intensities of the reactions products and also its effect on ∆F was tested using different solvents viz water, methanol, acetone, acetonitrile and dimethylformamide. Using distilled water as a diluting solvent gave the highest absorbance values, the best peaks shapes and the highest ∆F values. Distilled water was chosen finally as the best diluting solvent of choice for the two methods.
Method Validation
The validity of the proposed methods was tested regarding linearity, specificity, accuracy, repeatability and intermediate precision according to ICH Q2(R1) recommendations [38].
Linearity and Range: Assessment of linearity of the assay methods was performed by construction of the calibration graphs for the two methods under the
described experimental conditions, where the
absorbance value in method I or difference in the fluorescence intensity (∆F) in method II was plotted
vs concentration in µg mL-1. The regression plots showed a linear dependence of ∆F and absorbance values on the drug concentrations over the range of 4-80 µg mL-1 and 0.05-1.0 µg mL-1 for methods I and II respectively. Linear regression analysis of the data gave the following equations:
A = 0.105 + 0.007 C (r=0.9998) ∆F = 31.80 + 55.11 C (r=0.9999)
where A is the absorbance in 1-cm cell, C is the concentration of the drug (µg mL-1)
∆F = the native fluorescence of eosin solution (Fº) - fluorescence of the reaction product (F), and r is the correlation coefficient.
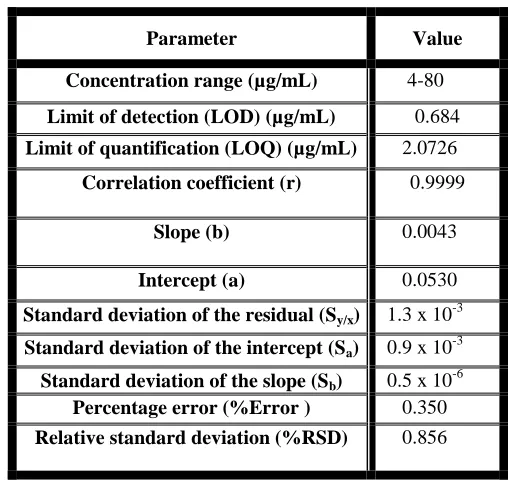
The high values of the correlation coefficients with a small intercept and high slope indicate the good linearity of the calibration graph and high sensitivity
(Table 1). Statistical evaluation[39] of the regression line gave high values for the correlation coefficient (r) of the regression equations. Small values of the standard deviation of the residual (Sy/x), standard
deviation of the intercept (Sa) and standard deviation
of the slope (Sb) indicated the low scattering of the
points around the calibration curves. Small values of the percentage relative standard deviation (%RSD) and the percentage relative errors (% Er) also pointed out to high accuracy and high precision of the proposed methods (Table 1).
Limit of Quantitation (LOQ) and Limit of Detection (LOD): The limit of detection (LOD) and limit of quantitation (LOQ) were calculated according to ICH
Q2 Recommendation [38] . The limit of detection
(LOD) of an individual analytical method is the lowest amount of analyte in a sample which can be detected but not necessarily quantitated as an exact value [38]. The results are showed in Table 1.
Where the limit of quantitation (LOQ) of an individual analytical method is the lowest amount of analyte in a sample which can be quantitatively determined with suitable precision and accuracy[38]. The results are also presented in Table 1.
LOD and LOQ were calculated according to the following equations specified by ICH guidelines [38]: LOD = 3.3 Sa / b
LOQ = 10 Sa / b
Where Sa= standard deviation of the intercept of the
calibration graph and b=slope of the calibration curve.
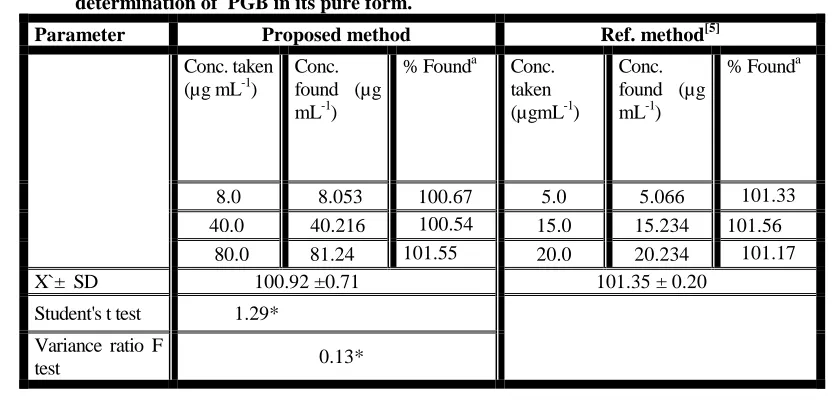
Accuracy: Statistical analysis of the results, obtained by the proposed and the reference methods for PGB using Student's t-test and variance ratio F-test[39] , showed no significant difference between the performance of the proposed methods regarding accuracy and precision, respectively (Table 2). The
reference method [5] was based on spectrophotometric
measuring of the reaction product of PGB with 1,2-naphthoquinone-4-sulphonate (NQS) at pH 10.5 to form colored reaction product peaking at 473 nm after heating in thermostatically controlled water bath at 55 ± 5°C for 10 min. It was tedious and time consuming method.
Precision
www.pharmascholars.com 18
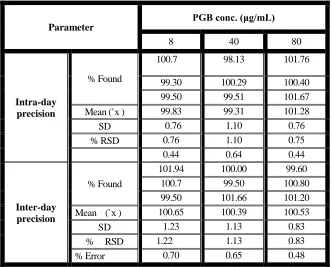
the proposed method. The results are presented in Table3.
Inter-day assay: To evaluate the intermediate precision of the proposed methods, they were applied to the determination of three concentrations and three replicates of each concentration of the studied drug in pure form over three successive days. The relative standard deviation was found to be small indicating the high precision of the proposed methods (Table 3).
Robustness of the method: The robustness of an analytical method is a measure of its capacity to remain unaffected by small, but deliberate changess in parameters of the proposed method and it gives an indication of its reliability during normal usage [38]. The robustness of the two proposed methods was indicated by the constancy of the difference in the fluorescence intensity (∆F) with the minor changes in the experimental parameters such as change in the volume of eosin,( 4.8 × 10⁻⁵M), using 1.5 ± 0.2 mL and pH 3.5 ± 0.2. These minor changes that may take place during the experimental operation didn't greatly affect the decrease in the fluorescence intensity of eosin.
Selectivity: Specificity is the ability to assess unequivocally the analyte in the presence of
components which may be expected to be present [38].
The specificity of the proposed methods was
investigated by observing any interference
encountered from the common capsule excepients, such as lactose monohydrate, corn starch and talc.
These excipients did not greatly interfere with the proposed methods.
Pharmaceutical Applications
Capsule analysis: The proposed methods were applied successfully to the determination of PGB in its capsule dosage forms. The average percent recoveries of different concentrations were based on the average of three replicate determinations. The proposed methods were tested for specificity and accuracy for capsules analysis showing results in (Table 4). These results are in good agreement with
those obtained using the reference method [5].
Statistical analysis of the results obtained using Student’s t-test and variance ratio F-test [39] revealed
no significant difference between the performance of the proposed methods regarding the accuracy and precision, respectively.
Mechanism of the reaction: The stoichiometry of the reaction between PGB and eosin was carefully studied using limiting logarithmic method [40]. The absorbance values of the reaction product were measured alternatively in the presence of either PGB or eosin. Plots of log [PGB] vs log A and log [eosin]
vs log A gave two straight lines and values of the slopes were 0.68: 0.72 for PGB: eosin respectively (Fig.7). Hence, it is concluded that, the molar reactivity of the reaction is 1:1 drug: eosin. Based on the obtained molar ratio and by analogue to previous study [41], a schematic proposal for the reaction pathway between PGB and eosin is shown in Scheme 1.
Scheme 1: The proposal of the mechanism for the reaction between PGB and eosin.
CONCLUSION
Two simple, sensitive and validated methods were developed for simultaneous determination of PGB
without interference from common capsule
excipients. The proposed methods were found to have LODs of 0.82 and 0.01 and LOQs of 2.49 and 0.03 for methods I and II, respectively. From economic point of view, both proposed methods are simple,
www.pharmascholars.com 19
Table 1.a : Analytical performance data for the determination ofPGB by the proposed spectrophotometric method.
Table 1.b: Analytical performance data for the determination of PGB by the proposed spectrofluorimetric method.
Parameter Value
Concentration range (µg/mL) 4-80
Limit of detection (LOD) (µg/mL) 0.684
Limit of quantification (LOQ) (µg/mL) 2.0726
Correlation coefficient (r) 0.9999
Slope (b) 0.0043
Intercept (a) 0.0530
Standard deviation of the residual (Sy/x) 1.3 x 10⁻³
Standard deviation of the intercept (Sa) 0.9 x 10
-3
Standard deviation of the slope (Sb) 0.5 x 10
-6
Percentage error (%Error ) 0.350
Relative standard deviation (%RSD) 0.856
Parameter Value
Concentration range (µg/mL) 0.05-1
Limit of detection (LOD) (µg/mL) 0.01
Limit of quantification (LOQ) (µg/mL) 0.03
Correlation coefficient (r) 0.9999
Slope (b) 55.11
Intercept (a) 31.80
Standard deviation of the residual (Sy/x) 0.254
Standard deviation of the intercept (Sa) 0.188
Standard deviation of the slope (Sb) 0.349
Percentage error (%Error ) 0.65
www.pharmascholars.com 20
Table 2.a: Application of the proposed spectrophotometric method for thedetermination of PGB in its pure form.
Ref. method[5] Proposed method
Parameter
% Founda
Conc. found (µg mL-1) Conc.
taken (µgmL-1)
% Founda
Conc. found (µg mL-1) Conc. taken
(µg mL-1)
101.33 5.066 5.0 100.67 8.053 8.0 101.56 15.234 15.0 100.54 40.216 40.0 101.17 20.234 20.0 101.55 81.24 80.0
101.35 ± 0.20 100.92 ±0.71 X`± SD
1.29* Student's t test
0.13* Variance ratio F
test
N.B.:
a Each one of these results is the average of three separate determinations.
* The tabulated values of t and F are (2.78) and (19.00) respectively, at p=0.05 [39].
Table 2.b: Application of the proposed spectrofluorimetric method for the determination of PGB in its pure form.
Ref. method[5] Proposed method
Parameter
% Founda
Conc.
found (µg mL-1) Conc.
taken (µg mL-1)
% Founda
Conc.
found (µg mL-1)
Conc. taken (µg mL-1)
101.33 5.066 5.0 100.89 0.0504 0.05 101.56 15.234 15.0 101.55 0.406 0.40 101.17 20.234 20.0 100.33 1.003 1.00
101.35 ± 0.20
100.92 ±0.40 X`± SD
0.005* Student's t test
9.703*
Variance ratio F test
N.B.:
a Each one of these results is the average of three separate determinations.
www.pharmascholars.com 21
Table 3.a: Precision data for PGB using the proposed spectrophotometric method.
Parameter
PGB conc. (μg/mL)
8 40 80
Intra-day precision
% Found
100.7 98.13 101.76
99.30 100.29 100.40
99.50 99.51 101.67
Mean (`x ) 99.83 99.31 101.28
SD 0.76 1.10 0.76
% RSD 0.76 1.10 0.75
% Error
0.44 0.64 0.44
Inter-day precision
% Found
101.94 100.00 99.60
100.7 99.50 100.80
99.50 101.66 101.20
Mean (`x ) 100.65 100.39 100.53
SD 1.23 1.13 0.83
% RSD 1.22 1.13 0.83
% Error 0.70 0.65 0.48
Table 3.b: Precision data for PGB using the proposed spectrofluorimetric method.
Parameter PGB conc. (μg/mL)
0.05 0.4 1
Intra-day precision
% Found
100.00 98.90 99.60
100.50 100.10 99.20
101.30 101.76 99.40
Mean (`x ) 100.60 100.25 99.40
SD 0.66 1.44 0.20
% RSD 0.65 1.43 0.20
% Error 0.38 0.83 0.12
Inter-day precision
% Found
101.40 98.25 99.60
102.00 100.50 101.20
101.00 101.00 101.00
Mean (`x ) 101.43 99.92 100.60
SD 0.51 1.47 0.87
% RSD 0.51 1.47 0.87
www.pharmascholars.com 22
Table 4.a: Application of the proposed spectrophotometric method for the determination of PGB in capsules.Ref. method[5] Proposed method
Parameter
% Founda
Conc.
found (µg mL-1) Conc.
taken (µg mL-1)
% Founda
Conc. found (µg mL-1) Conc. taken
(µg mL-1) Lyrica® capsules
(75.0 mg PGB/ capsule) 101.01 5.050 5.0 100.45 8.036 8.0 99.43 14.914 15.0 101.11 40.444 40.0 99.3 19.86 20.0 98.78 79.024 80.0
99.91 ± 0.95 100.11 ± 1.20 X`± SD
0.226* Student's t test
1.591* Variance ratio F test
N.B.:
a Each one of these results is the average of three separate determinations.
* The tabulated values of t and F are (2.78) and (19.00) respectively, at p=0.05 [39].
Table 4.b: Application of the proposed spectrofluorimetric method for the determination of PGB in capsules.
Ref. method[5] Proposed method
Parameter
% Founda
Conc. found(µg mL-1) Conc. taken
(µg mL-1) % Founda
Conc.
found (µg mL-1) Conc.
taken (µg mL-1) Lyrica®
capsules (75.0 mg PGB/ capsule) 101.01 5.050 5.0 99.91 0.049 0.05 99.43 14.974 15.0 99.41 0.397 0.40 99.3 19.860 20.0 98.01 0.980 1.00 99.91± 0.95
99.11 ± 0.98 X`± SD
1.016* Student's t test
1.070* Variance ratio F test
N.B.:
a Each one of these results is the average of three separate determinations. * The tabulated values of t and F are (2.78) and (19.00) respectively, at p=0.05 [39].
www.pharmascholars.com 23
Fig. (2):
Absorption spectra of: a) pregabalin only (80 μg/mL);
(b)
Blank eosin (5 × 10
-3M)
at pH 3.5;
(c)
Reaction product of pregabalin (80 μg/mL) with (5 × 10
-3M) eosin at pH
3.5.
www.pharmascholars.com 24
0 1 2 3
0.4 0.5 0.6 0.7 0.8
Volume of Eosin(mL)
A
b
so
rb
a
n
c
e
(a)
(b)
0
1
2
3
75
80
85
90
95
Volume of Eosin(mL)
F
Fig. (4): (a)
Effect of volume of eosin (5 × 10
-3M) on the absorbance of reaction
product (80 µg mL
-1PGB).
www.pharmascholars.com 25
(a)
0
2
4
6
0.45
0.50
0.55
0.60
0.65
0.70
pH
A
b
so
rb
a
n
c
e
(b)
0
2
4
6
75
80
85
90
95
pH
F
Fig. (5):
(a)
Effect of pH of 0.2 M acetate buffer on the absorbance of
reaction product (80 µg mL
-1PGB);
(b)
Effect of pH of 0.2 M acetate buffer on the
www.pharmascholars.com 26
(a)
0 1 2 3 4
0.55 0.60 0.65 0.70 0.75
Volume of 0.2 M acetate buffer(mL)
A
b
so
rb
a
n
c
e
(b)
0
1
2
3
4
70
75
80
85
90
95
Volume of 0.2 M acetate buffer(mL)
F
Fig. (6): (a)
Effect of volume of 0.2 M acetate buffer on the absorbance of
reaction product (80 µg mL
-1PGB);
(b)
Effect of volume of 0.2 M acetate buffer on the
www.pharmascholars.com 27
(a)
-5.0
-4.5
-4.0
-3.5
-3.0
-1.0
-0.8
-0.6
-0.4
-0.2
0.0
Log [pregabalin]
L
o
g
A
(b)
-3.5
-3.0
-2.5
-2.0
-0.8
-0.6
-0.4
-0.2
0.0
Log [eosin]
L
o
g
A
Fig. (7):
Stoichiometry of the reaction between PGB and eosin ( 5 x 10³- M)
adopting limiting logarithmic method.
www.pharmascholars.com 28
REFERENCES:1. Sweetman S, Martindale. The Complete Drug Reference. London; Pharmaceutical Press : 2009, pp.36.
2. Gajraj NM. Anesth Analg, 2007; 105(6): 1805-1815.
3. Gouda A, Al Malah Z. J Mol Biomol Spectrosc,2013 ;105: 488-496.
4. Bali A, Gaur P. J Chem Cent , 2011; 5: 59.
5. Walash M, Belal F, El-Enany N, El-Maghrabey M. Chem Cent J,2011; 5(1): 36.
6. Gujral RS, Haque SM, Shanker P. Int JBiomed Sci, 2009; 5(2): 175-180.
7. Önal A. Chin J Chem, 2009; 27(4):781-786.
8. Gujral RS, Haque SM, Shanker P. Int JBiomed Sci, 2009; 5(4): 421-427.
9. Navneet K, Karan M, Rishabh N, Kunal N, Arti T, Road F, Kalan G. Int Res J Pharm, 2010; 1: 175-180.
10.Salem H. E- JChem, 2009; 6(2): 332-340.
11.Önall A, Sagirli O. J Spectrochim Acta[A], 2009; 72(1): 68-71.
12.Vovk T, Martinc B, Grabnar I. J Sci Pharm, 2010; 78(3):704.
13.Themelis DG, Tzanavaras PD, Boulimari EA. J Anal Lett,2010; 43(6): 905-918.
14.Hegstad S, Hermansson S, Betnér I, Spigset O, Margrethe B , Falch H. JChromatogr B, 2014; 947–948: 83-89.
15.Krishna M, Mudiam R, Chauhan A, Jain R, Ratnasekhar C, Fatima G, Malhotra E, Murthy R. J Pharm Biomed
Anal, 2012; 70: 310-319.
16.Dahl SR, Olsen KM, Strand DH. J Chromatogr B, 2012; 885–886: 37-42.
17.Vermeij TAC, Edelbroek PM. J Chromatogr B, 2004; 810(2): 297-303.
18.Berry D, Millington C. J Ther Drug Monit, 2005; 27(4): 451-456.
19.Jadhav AS, Pathare DP, Shingare MS. J Chromatographia, 2007; 65(3-4): 253-256.
20.Vaidya VV, Yetal SM, Roy SMN, Gomes NA, Joshi SS. J Chromatographia, 2007; 66(11-12): 925-928.
21.Chen XH, Zhang DL, Deng J, Fu XT. JChromatogr Sci,2008; 46(1): 42-44.
22.Mandal U, Sarkar AK, Gowda KV, Agarwal S, Bose A, Bhaumik U, Ghosh D, Pal TK. J Chromatographia,
2008; 67(3-4): 237-243.
23.Zhang Y, Holliman C, Tang D, Fast D, Michael SJ. J Chromatogr B, 2008; 875(1): 148-153.
24.Gujral RS, Haque SM, Kumar SA. Afr J PharmPharmacol, 2009; 3(6): 327-334.
25.Nirogi R, Kandikere V, Mudigonda K, Komarneni P, Aleti R. J Chromatogr B, 2009; 877(30): 3899-3906.
26.Oertel R, Arenz N, Pietsch J, Kirch W. J Sep Sci,2009; 32(2): 238-243.
27.Douša M, Gibala P, Lemr K. J Pharm Biomed Anal, 2010; 53(3): 717-722.
28.Kannapan N, Nayak SP, Venkatachalam T, Prabhakaran VJ. J Appl Chem Res, 2010; 13(1): 85-89.
29.Kasawar GB, Farooqui MN. Indian J Pharm Sci, 2010; 72(4): 517-9.
30.Martinc B, Grabnar I, Mrhar A, Vovk T. J Assoc Anal Comm,2010; 93(4): 1069-1076.
31.Shah GR, Ghosh C, Thaker BTJ. J Adv Pharm Technol Res, 2010; 1(3): 354-357.
32.El-Brashy AM, Metwally ME, El-Sepai FA. J Farmaco, 2004; 59(10): 809-817.
33.El-Enany N. J Farmaco, 2004; 59(1): 63-69.
34.Ayad MA, Shalaby AA, Abdellatef HE, Hosny MM. J PharmBiomed Anal, 2002; 28(2): 311-332.
35.Abdellatef HE. J Spectrochim Acta [A], 2007; 66(3): 701-706.
36.Belal F, El-Brashy AM, El-Enany N, El-Bahay N. J Assoc Anal Comm, 2008; 91(6): 1309-1317.
37.Gazy AA, Mahgoub H, El-Yazbi FA, El-Sayed MA, et al. J Pharm Biomed Anal, 2002; 30(3): 859-867.
38.ICH Harmonized Tripartite Guideline, Validation of Analytical Procedures, Text and Methodology, Q2(R1), Current Step 4 Version, Parent Guidelines on Methodology: 2005.
Availableat[http://www.bioforum.org.il/Uploads/Editor/karen/q2_r1_step4.pdf].
39.Miller JN, Miller JC. Statistics and chemometrics for analytical chemistry. 5th ed., London; Prentice Hall: 2005, pp. 124–125, 256.
40.Rose J. Advanced physico-chemical experiments. London, England; Pitman : 1964.