~ 1 ~ WWJMRD 2018; 4(7): 1-10
www.wwjmrd.com International Journal Peer Reviewed Journal Refereed Journal Indexed Journal
Impact Factor MJIF: 4.25 E-ISSN: 2454-6615
Mihretab G. Ghebrezgabher Eritrea Institute of Technology College of Education, Mai-Nefhi 12676, Eritrea
TaibaoYang
Institute of Glaciology and Eco-geography, College of Earth and Environmental Sciences, Lanzhou University, Lanzhou 730000, China
Xuemei Yang
Gansu Desert Control Research Institute, Lanzhou 730070, China
Correspondence:
Mihretab G. Ghebrezgabher Eritrea Institute of Technology College of Education, Mai-Nefhi 12676, Eritrea
Spatio-temporal Assessment of climate change in
Eritrea based on precipitation and temperature
variables
Mihretab G. Ghebrezgabher,
TaibaoYang, Xuemei Yang
Abstract
Climate change based on precipitation and temperature variability is a major concern in the world, particularly in the Horn of Africa, including Eritrea, which has led to severe droughts in poverty and hunger in the region. In this study, the long-term trends and interpolation methods were used to evaluate and evaluate the average annual rainfall and temperature, and the drought condition was analyzed by using standard precipitation Index (SPI) (1930 – 2010).The results showed that the long-term trend of annual precipitation was obviously decreased and the temperature increased significantly. Relatively, the Highland (around Asmara) receives above 466 mm rainfall, with an average temperature of 20.13oC. In the last eight decades, Massawa and Assab recorded minimum rainfall (221 mm) and the highest temperature (> 28.16oC). The country has experienced moderate to severe droughts since the 1960s, particularly in 1966, 1984, 1990 and 2009. We conclude that, over the past 81 years, climate change and drought have been serious environmental problems in Eritrea, and this study may be of great importance to policymakers in formulating and establishing appropriate plans to address and control current environmental issues.
Keywords:
Climate change; Interpolation; Drought; Eritrea
1. Introduction
Climate change is a difference of the weather patterns that may describe changes in quantity and distribution of weather patterns such as rainfall, temperature, wind, snow, air pressure, etc. Typically, climate change records exceed 30 years (IPCC, 2014; Hegerl, 2007); short-term extreme weather changes can lead to climate change (Eludoyin, 2015). Climate change is the world’s most serious of environmental problems, directly affecting human activities and property. Precipitation, melting ice, increasing sea level, drought, poverty, river drying and reducing the number and distribution of groundwater resources are the best indicators of climate change (IPCC, 2014). The impact of climate change on desertification and deforestation is difficult to understand, but some researchers believe climate change may at least accelerate land degradation in deserts and forests (IPCC, 2014), and desert vegetation is highly sensitive to climate change (Yang et al., 2016). Human factors or nature are the main causes of climate change, including volcanic eruptions, solar radiation changes, the Earth's sun angle/orbit, greenhouse gases (carbon dioxide, methane gas, nitrous oxide, chlorofluorocarbons), agricultural expansion, deforestation, population explosion, urbanization and resource explosion play an important role in climate change. Before the Industrial Revolution, climate change can be caused by natural factor and later by human activity (Hegerl, 2007).
~ 2 ~ of the Earth rose from 15.5oC to 16.2oC at the end of the 1850 and 20th century, with 60% from carbon dioxide and 25% of methane gas. According to the IPCC, 2001, data the Earth's surface temperature increased to 0.6oC at the end of the 20th century, thus effectively warming the earth. Climate change may have positive or negative effects, but the positive impact is very limited. Climate change has complex interactions affecting social, economic, environmental and political forms of livelihoods (IPCC, 2014). However, climate change has more impact on the environment than in other forms, because it depends directly or indirectly on environmental factors. As a result, climate change has a negative impact on the environment at local, regional or global level. As the annual average temperature increases, the Earth's surface and atmosphere become warmer, especially human factors (Conway and Schipper, 2011). In many parts of the world, seasons change, sea levels rise, ice melts in Polar Regions, glaciers and permafrost melt on some mountains (IPCC, 2014). Climate change has led to floods and droughts in some places, mainly in Africa, such as Ethiopia (Bryan, 2009; Conway and Schipper, 2011), including Eritrea and its ability to influence soil moisture and its support for production (Whan, 2015). Climate change such as drought and floods has a negative impact on human life and property (Antwi, 2015); particularly in the Horn of Africa (IPCC, 2014) and from the 1960s to the 1980s it was serious (Waal, 1991; Brandt, 2014; Ghebrezgabher, 2016b), including Eritrea. Global warming may have the greatest impact on extinction of species in the last century, for example, according to IPCC data, the average temperature rise of 1.5oC may be that the 20% – 30% species will be at risk, and if it rises above 3oC, the ecosystem will struggle. While our planet still provides living things and a man with all the necessities such as water, food, air, local or land, but climate change constantly changes land and water resources, all life depends on its for survival. It is therefore essential to focus on the future and predict the extremes of weather and climate (Mahmood, 2015) that climate change will have a negative impact on children and the elderly, particularly the continent's future is concerned (Stringer, 2009).
The focus of this study is therefore on the long-term climate change analysis of Eritrea based on temperature and precipitation variability from 1930 to 2010. Time series data for analyzing trends in temperature and rainfall, interpolation, and precipitation data for assessing and
evaluating the country's drought index as a climate change indicator.
2 Material and Methods
2.1 Materials 2.1.1 The study site
Eritrea is located in a fragile region, where the arid and semi-arid climate dominates. Eritrea also found that in East Africa or the Horn of Africa, between 36°26′ and 43°13′e, 12°22′ and 18°02′. It is bordering with the Red Sea, Ethiopia, and Djibouti and Sudan (Figure 1). The country is considered one of the world's smallest and poorest countries with a total population of 6.4 million, estimated at about 125,300 km2 (Nyssen, 2004; Ogbazghi and Bein, 2006; Ghebrezgabher, 2018). According to MLWE (2012), about 80% of the population are engaged in agriculture and related activities, and 20% of the population are working in manufacturing and services.
In the Horn of Africa, rainfall is unpredictable, characterized by erratic and infrequent. In this area, climate change is very serious, and prolonged and frequent droughts hit the region, especially during the El Niño period, resulting in a decline in crop yields. For example, in 2015, El Niño led to a drought in Horn of Africa, where Ethiopia severely hungry, with 15 million of people needing immediate food aid (UNICEF, 2015). In Eritrea, the topography of the plateau and the southwest of the summer rainfall relatively more (June – September), Massawa and Assab around the eastern lowlands, receives very small rainfall between December and February (winter). The rainfall in this country is uneven and irregular. Annual rainfall in the central and Southern Highlands is above 500 mm, rainfall in the eastern lowlands is lower than 200 mm, but the highest annual rainfall (1000 mm) is recorded in the eastern cliffs of the forest – dominated region. In this study, the annual average temperature of the country varies, approximately 16°C in the Highlands around Asmara, and 30°c in the eastern and western lowlands around Massawa, Assab, Tesseney and Agordat (Ghebrezgabher, 2018). Eritrea faces a number of environmental problems, such as desertification, deforestation, soil erosion, overgrazing, which may cause climate change (Nyssen, 2004; Tekeste, 2007; MLWE, 2012; Ogbazghi and Bein, 2006). For example, Ghebrezgabher (2016a) said that the country's forest cover has lost 0.35% annually since the 1970s.
~ 3 ~
2.1.2 Climate Data Collection
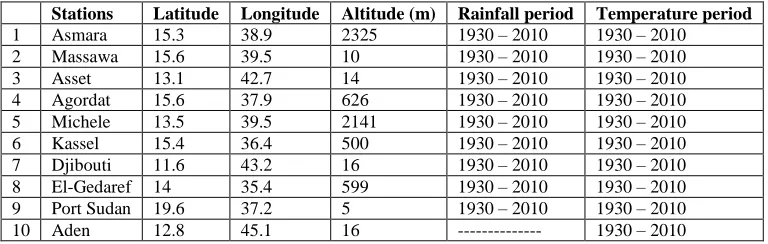
Rainfall data are considered more accurate and reliable, but there is no usable and reliability in the Sahel region, including Eritrea (Herrmann, 2005). In this study, temperature and precipitation data were used as proxies and 10 meteorological stations in the country and neighborhood were selected to analysis and assess the long-term climate change in Eritrea (Table 1). Monthly average surface temperature and precipitation data (1930 – 2010) were obtained from grid data for 0.25 degree resolution, version 3.02 in (http://climate.geog.udel.edu/~climate/html_pages/ download.html) (Figure 1). However, the grid precipitation
data estimated for Massawa station (longitude 39.25 and latitude 15.75) are of great significance in this study. Generally, the average annual rainfall in Massawa is the lowest (Ghebrezgabher, 2018), but according to grid data, the rainfall has been highest in the past eight decades. Therefore, the monthly average precipitation data of Massawa station (1930 – 1990) were obtained from the Koninklijk Netherlands Meteorologisch Instituut (KNMI) Climate Explorer (http://climexp.knmi.nl/getstations.cgi) and grid data (1991 – 2010), and the annual rainfall distribution was adjusted by means of linear regression.
Table 1 Stations with latitude, longitude, altitude, and rainfall and temperature periods
Stations Latitude Longitude Altitude (m) Rainfall period Temperature period
1 Asmara 15.3 38.9 2325 1930 – 2010 1930 – 2010
2 Massawa 15.6 39.5 10 1930 – 2010 1930 – 2010
3 Asset 13.1 42.7 14 1930 – 2010 1930 – 2010
4 Agordat 15.6 37.9 626 1930 – 2010 1930 – 2010
5 Michele 13.5 39.5 2141 1930 – 2010 1930 – 2010
6 Kassel 15.4 36.4 500 1930 – 2010 1930 – 2010
7 Djibouti 11.6 43.2 16 1930 – 2010 1930 – 2010
8 El-Gedaref 14 35.4 599 1930 – 2010 1930 – 2010
9 Port Sudan 19.6 37.2 5 1930 – 2010 1930 – 2010
10 Aden 12.8 45.1 16 --- 1930 – 2010
2.2 Methodology
2.2.1 Precipitation and Temperature data homogeneity test
For meteorological and climatic analysis and evaluation, reliable and homogeneous climatic data, such as rainfall and temperature data (Eaterling and Peterson, 1995), are needed, especially in decision-making, formulation and design of a good plan for environmental management and control. Therefore, monthly and yearly rainfall or temperature data from the weather stations must be homogeneous, since heterogeneity is biased to analyze climatic data, especially rainfall. In the time series, precipitation or temperature data may not be uniform at each station due to the quality of the instrument, the relocation of instruments, trees and buildings, and the changes in observation locations and the errors observed by the observers during the observation process. Recording data may affect data quality (Eaterling and Petersen, 1995). Different methods established to test the consistency of monthly or yearly rainfall (Eaterling and Peterson, 1995). In this study, we used the Rainbow Package version 2.2 to analyze the hydrological and meteorological frequency, and tested the uniformity of historical rainfall and temperature data sets of each station. We apply the probability of the normal distribution, the Weibull method parameter estimation of the maximum likelihood method and the threshold value is considered to be no/nil of all observations (Raes, 2006). A relative frequency analysis of climatic data has been taken, where the histogram is considered non – zero. As a result, we found that all stations were suitable for this study except for the precipitation data of the Aden station.
2.2.2 Linear Trend Analysis
Linear trend analysis relies on the relationship between independent variables and dependent variables. Linear trend analysis is one of the most common methods to evaluate climate change. Recently, some researchers used it in their research (Herrmann, 2005; Stergiou, 2016). In this study, meteorological data (temperature or precipitation)
and time are input variables, the trend of which depends on changes in annual precipitation or temperature data, although some researchers apply monthly (Gungbenro and Morakinyo, 2014). The linear polynomial regression of precipitation and temperature was completed with the help of original product 9.29 software. The formula is defined as:
Where Y is a dependent variable, x is an independent variable, and "b" and "a" are the slopes of lines and constant numbers, respectively.
2.2.3 Precipitation and Temperature Interpolation
~ 4 ~ (Irmak, 2010). In this study, the ArcGIS 9.3 interpolation distance weighting (IDW) method was applied, and IDW was a smooth surface, which depended on different points and weights. The IDW define as (Irmak, 2010):
∑
Where Zs is the value of interpolated at location ‘s’, Zsi is the observed value in each station i, ns is the total number of weather stations selected for interpolating and is the weight signed to interpolating from the closer location, which might be calculated by the following formula:
∑
Where d is the distance from the station to the unknown place to be interpolated, and P is the exponent of the distance, which is always a positive real number and N is a station. The power controls the significance of the closest points on the interpolated area, and the influence is less from distant points when P is higher. Although any real number can assign for P, usually, the value ranges between 0.5 and 3, in this study, P equal to 2.
2.2.4 Drought Index Assessment
Drought is a serious of environmental problems in the world, and it is the direct impact of climate change, such as the scarcity of rainfall and extreme evapotranspiration. Several factors may define droughts, including climate change, metrological data, hydrological and water cycles, atmospheric and agricultural factors or soil moisture (McKee, 1993; Rajsekhar, 2015). Although measuring drought indices is complex, researchers have established several techniques for estimating drought conditions. The Standardized precipitation index (SPI) and the Palmer Drought Index (PDI) are the most common indicators for the analysis of drought indices (WMO, 2012; Rajsekhar, 2015; AghaKouchak, 2015). In this study, the drought index was evaluated by SPI. Drought indices estimated from terrestrial satellite imagery or other methods. However, the most suitable and simplest method is SPI, depending on the precipitation data, and the actual and
monthly/yearly average precipitation (at least 30 years) for calculating the SPI. The SPI values range between > 2.00 and < -2.00 (McKee, 1993; WMO, 2012). According to McKee (1993), the value of SPI and the type of drought explained in table 2. The SPI applies to any time scale, depending on the purpose of the study (from March to 4 August). The limitation of the SPI is that it does not show the normal distribution of the month. The SPI defined as:
Where PA is annual mean precipitation and PLt is long-term annual mean precipitation and Sd refers to the long-term standard deviation.
Table 2 Value and description of SPI
SPI Values descriptions
> 2 Extremely wet 1.5 – 1.99 Very wet 1.0 – 1.49 Moderately wet 0.99 – -0.99 Near normal -1.0 – -1.49 Moderately dry -1.5 – -1.99 Severely dry < -2 Extremely dry
3 Results
3.1 Precipitation Trend Assessing
Figure 2 shows an annual average rainfall was declined from 1930 to 2010. In contrast, the highest annual rainfall was recorded in the early 1930s (415 mm) and 2001 (459 mm), and the lowest levels observed in 1984, 1990 and 2009, respectively, in 197.5 mm, 176 mm and 214.9 mm, and may be associated with severe droughts. Although the distribution of annual average rainfall has a certain fluctuation, the decline rate of this trend is -0.45/a. (1930-2010). Climate change was more significant in the 1930s-the 1960s (r =-0.394, p = 0.028) than in 1960s – 1990s and 1990s – 2010, where (r =-0.087, p = 0.647) and (R =-0.138, p = 0.561), respectively. In the long-term average precipitation changed insignificant (R =-0.2002 and P = 0.073). The country has had insufficient rainfall over the past eight decades.
1930 1940 1950 1960 1970 1980 1990 2000 2010 150 200 250 300 350 400 450 500 1930 1940 1950 1960 270 300 330 360 390 420
1960 1970 1980 1990 150 200 250 300 350 400 450
1992 1996 2000 2004 2008 200 250 300 350 400 450 500
Y = -0.45X + 1210.94 R = -0.2002
P re cipita tio n (mm ) Year Mean Annual Precipitation
Y = -1.997X + 4219.4 R = -0.39
P re ci p ita ti o n (m m ) Year
Y = -0.55X + 1396.03 R = -0.087
Year
Y = -1.3377X + 2997.54 R = -0.1382
Year
~ 5 ~
3.2 Temperature Trend Assessing
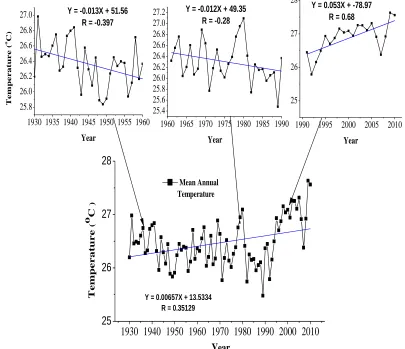
In Figure 3, the long-term trends and variations of the temperature of the three climatic phases are explained. The results showed that in the long term, the annual mean temperature increased significantly 99% (r = 0.351, p = 0.0013), and low temperature was recorded in the 1980s and the early 1990s, and the annual average temperature was lowest in 1989 (25.5oC). In contrast, over the past two decades, temperatures have risen with the highest temperature in 2009 (27.5 OC). In the long term, the annual average temperature increased significantly (1930 – 2010) at a rate of 0.007/a. Figure 3 also shows that the
temperature has significantly decreased in 1930 – 1960 and 1960 – 1990, while the temperature has increased significantly over the past two decades. In 1930-1960, the annual average temperature was dropped significantly level of 99% (R =-0.397, p = 0.0269), and increased at the 95% (r = 0.680, p = 0.0098) at 1990 – 2010. The annual average temperature decreased by 0.1oC between the first and second phases, and the second and third phases increased by 0.6oC. However, it has been raised by 0.5oC in the long term. Therefore, the temperature change in the first and last period is very serious, although the change is the opposite trend appeared.
1930 1940 1950 1960 1970 1980 1990 2000 2010
25
26
27
28
1930 1935 1940 1945 1950 1955 1960 25.8
26.0 26.2 26.4 26.6 26.8 27.0
1960 1965 1970 1975 1980 1985 1990 25.4
25.6 25.8 26.0 26.2 26.4 26.6 26.8 27.0 27.2
1990 1995 2000 2005 2010 25
26 27 28
Y = 0.00657X + 13.5334 R = 0.35129
T
em
perat
ure
(
o C
)
Year
Mean Annual Temperature
Y = -0.013X + 51.56 R = -0.397
T
em
perat
ure (
oC)
Year
Y = -0.012X + 49.35 R = -0.28
Year
Y = 0.053X + -78.97 R = 0.68
Year
Fig.3: Thetrend of annual mean temperature, based on climatic period (above), and long-term climate change (bottom) in Eritrea from 1930 to 2010.
3.3 Precipitation Spatial Interpolation Assessment
Figure 4 depicts the long-term and climatic cycles of Eritrea's spatial precipitation interpolation. Overestimation or underestimation is common in spatial interpolation, but it should not be close to the real image of the region. In the long term (1930 – 2010), the results showed that the central, Southern Highlands and eastern Cliffs received about 421 mm to 530 mm. The minimum rainfall (< 200 mm) is observed along the coastal area, Massawa, Assab and Danakil depression, with rainfall in the southwestern part of the country between 378 mm and 421 mm. The direct relationship was derived between rainfall distribution and altitude. Over the past eight decades, the country's highlands have had more precipitation than the lowlands. In this study, some regions underestimated, for example, the underestimation of the < 421 mm found in the eastern cliff,
~ 6 ~
Fig.4: The spatial precipitation interpolation of Eritrea based on climatic period (above), and long-term climate change (bottom) from 1930 to 2010.
3.4 Temperature Spatial Interpolation Assessment
The long-term spatial temperature interpolation (1930 – 2010) is explained in Figure 5. The results show that the temperature of Massawa, Assab, Danakil Depression and Western region is higher (about 29.89oC), but the middle and Southern Highlands are 17.58oC – 20.13oC. A reverse relationship is found between the temperature and the altitude. In other words, the temperature is reduced from the coast (Massawa port) to the Central Highlands or Asmara (capital), and vice versa. Figure 5 also shows the
relative temperature variations in the three climatic phases. Relatively, the lowest temperature recorded in 1960 – 1990, and the highest temperature recorded in 1990 – 2010. Over the past 81 years, the annual average temperature has increased from 29.9oC in the first phase to 30.12oC in the last, which increased by 0.2oC. High temperatures are recorded in the western, Danakil depression and coastal regions, from the second (1960 – 1990) and third (1990 – 2010) climatic periods. The temperature is serious from 1930 to 2010 in Eritrea.
~ 7 ~
3.5 Anomalies Analysis
Figure 6 explains the long-term temperature and precipitation anomalies. Anomaly is the difference between climate data and the long-term mean, which is suitable for evaluating the colder and warmer periods. Positive values indicate warmer temperatures and negative values as cooler climates/weather. In this study, climatic data anomalies
(temperature and precipitation) were estimated from 1930 to 2010. In Eritrea, the warm periods found in the 1930s and the past two decades. Relatively speaking, in 1966, 1969, 1984, 1990 and 2009, as well as the 1930s, 1961 and 2001, each recorded an extremely cool and warm weather conditions, respectively. Droughts usually occur in extremely cool environments.
1935 1950 1965 1980 1995 2010 -150
-100 -50 0 50 100 150
1935 1950 1965 1980 1995 2010
-1.0
-0.5
0.0
0.5
1.0
1.5
Precipitation
Anomaly
Year
Temperature
Anomaly
Year
Fig.6: Temperature and precipitation anomalies of the country from 1930 to 2010.
3.6 Drought condition analysis
Drought is naturally a regional and seasonal event. In Eritrea, the rainy season differs in the eastern, western and central Highlands. The eastern region received rainfall from December to February and the central and western regions in summer from June to September. Therefore, seasonal and regional droughts may vary between winter and summer, and between lowland and highland. However, the worst droughts occurred in summer, especially in the western and highland regions. Although drought assessment indicators of different scales have been established, the SPI is used to assess the drought in Eritrea
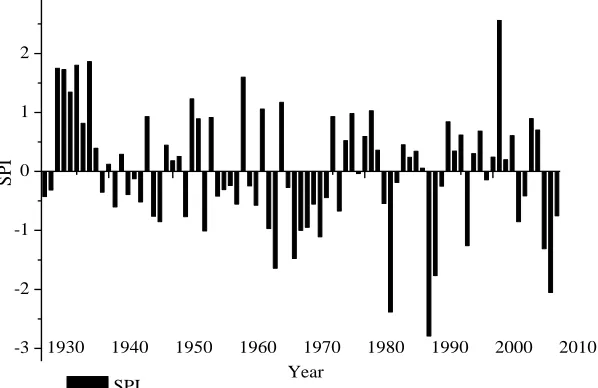
on the basis of long–term average annual rainfall. Figure 7 explains the drought in Eritrea based on the SPI value from 1930 to 2010. Relatively, in the 1930s, 1953/4 and 2001 and drying conditions observed in the 1960s, 1984, 1990, 1991 and 2009 took place. The country has experienced a normal drought in the past eight decades (1.5 to -1.0), and lower SPI occurred between the 1930s and the 1950s compared with the 1960s – 2010. During the El Niño period, droughts in the country were severe for every 6 to 7 years, for example, during the El Niño period, which had a severe drought in 1966, 1973, 1984, 1990/1 and 2008/9.
1930 1940 1950 1960 1970 1980 1990 2000 2010
-3 -2 -1 0 1 2
SPI
SPI Year
Fig.7: Drought condition of Eritrea based on SPI from 1930 to 2010
Discussion
According to MLWE (2012), in Eritrea, rainfall is variable in both distribution and quantity, with a prolonged drought, and the trend of annual average rainfall declines in a long time series. There was no significant decrease in precipitation between 1966 and 2010, although heavy
~ 8 ~ Eritrea. In this study, the annual average temperature trend decreased considerably in 1930 to 1960, but significantly increased since the 1970s (Midega, 2015; Gonzalez, 2012). Thus, it may be that climate change leads to inadequate food production and therefore poverty in the Horn of Africa, in addition, several organization and researchers say that the drought has a negative impact on food security in the Horn of Africa (MWLE, 2012; Ministry of Agriculture (MOA), 2004; Kayouli, 2006).
The IDW is suitable for analyzing the spatial distribution of rainfall and temperature in Eritrea. In the past eight decades, the average annual rainfall in lowland, coast, southeast Red Sea and northeast Red Sea is lower, and the average annual temperature is higher. In the long term, the country's highlands and southwestern regions are getting enough precipitation. The method is suitable for estimating the spatial distribution of precipitation and temperature in Eritrea (Kayouli, 2006; MOA, 2004; MLWE, 2012), moist and arid climatic conditions in upland and south-west, as well as lowland and desert areas. In Eritrea, the climate warming observed since 1965 is consistent with Dawelbait and Morari (2012).
Drought is a serious of environmental problems in East Africa, particularly in the Horn of Africa (AghaKouchak, 2015; Ghebrezgabher, 2016b), such as Ethiopia, Somalia, Eritrea and Djibouti. In this study, SPI was used to analyze and evaluate the drought condition of Eritrea in the long term (1930 to 2010). Droughts were found in the country and in the Sahel, especially serious in the El Niño time (Bhuvaneswari, 2013) in 1966, 1984, 1990 and 2009 (Brandt, 2014). The drought in 1973, 1984, 1990 and 2009 (Waal, 1991), had a negative impact on Ethiopia, including Eritrea. In the 1930s and the early 1950s, the impact of the drought was small, and Eritrea experienced nearly normal and extreme droughts from the 1960s to 2010.
Conclusions
The country's climate is affected by topography, from mountains to plains and depressions, dividing the country into highlands and lowlands. In this study, climate data are suitable for estimating the spatial distribution of rainfall and air temperature in the country and the study may be reliable. Relatively, high rainfall and low temperatures are recorded in upland and southwest and low precipitation and high temperature observations on the eastern lowlands and the western part of the border to the Sudan. Statistically, the annual average precipitation and temperature change trend declined and rose in the 1970s to 2010, respectively.in additions, extreme drought recorded in 1966, 1984, 1990 and 2009. Therefore, this article concludes that climate change and drought is serious environmental problems in Eritrea.
Acknowledgement
The Natural Science Foundation of China (41271024) supports this work. We would like to express our thanks to all members of the Institute of Glaciology and Eco-geography, College of Earth and Environmental Sciences, Lanzhou University for their constructive contributions, comments and suggestions to development this manuscript. We appreciate to Goush Fissehatsion and Wesley Cheruiyot from Lanzhou University for their language helping of the manuscript.
Reference
1. AghaKouchak, A. (2015). A multivariate approach for persistence-based drought prediction: Application to the 2010–2011 East Africa droughts. Journal of
Hydrology, 526, 127–135,
https://doi.org/10.1029/2009GL041365
2. Antwi, E.K., Boakye, J.D., Owusu, A.B., Loh, S.K., Mensa, R., Boafo, Y.A., Apronti, P.T. (2015). Community vulnerability assessment index for flood prone savannah agro ecological zone: Acase study of Wa West District, Ghana. Weather and Climate
Extremes, 10, 56–69,
https://doi.org/10.1016/j.wace.2015.10.008
3. Appelhans, T., Mwangomo, E., Hardy, D.R., Hemp, A., Nauss, T. (2015). Evaluating machine learning approaches for the interpolation of monthly air temperature at Mt. Kilimanjaro, Tanzania. Spatial
Statistics, 14, 91–113,
https://doi.org/10.1016/j.spasta.2015.05.008
4. Bhuvaneswari, K., Geethalakshmi, V., Lakshmanan, A., Srinivasan, R., Sekhar, N.U. (2013). The Impact of El Niño/Southern Oscillation on Hydrology and Rice Productivity in the Cauvery Basin, India: Application of the Soil and Water Assessment Tool. Weather and
Climate Extremes, 2, 39–47,
https://doi.org/10.1016/j.wace.2013.10.003.
5. Brandt, M., Romankiewicz, C., Spiekermann, R., Samimi, C. (2014). Environmental change in tine series – An interdisciplinary study in the Sahel of Mali and Senegal. Journal of Arid Environments, 105, 52-63, https://doi.org/10.1016/j.jaridenv.2014.02.019 6. Bryan, E., Deressa, T.T., Gbetibouo, G.A., Ringler, C.
(2009). Adaptation to climate change in Ethiopia and South Africa: options and constraints. Environmental science & policy, 12, 413 – 426, https://doi.org/10.1016/j.envsci.2008.11.002
7. Conway, D., & Schipper, E.L., (2011). Adaptation to climate change in Africa: Challenges and Opportunities identified from Ethiopia. Global Environment Change, 21, 227-237, https://doi.org/10.1016/j.gloenvcha.2010.07.013 8. Dawelbait, M., & Morari, F. (2012). Monitoring
desertification in a Savannah region in Sudan using Landsat images and spectral mixture analysis. Journal of Arid Environments, 80, 45 – 55, https://doi.org/10.1016/j.jaridenv.2011.12.011
9. Eaterling, D.R., & Peterson, T.C. (1995). The effect of artificial discontinuities on recent trends in minimum and maximum temperatures. Atmospheric Research, 37, 19-26, https://doi.org/10.1016/0169-8095(94)00064-K
10. Eludoyin, O.M. 2015. Assessment of daytime physiologic comfort, its perception and coping strategies among people in tertiary institutions in Nigeria. Weather and Climate Extremes, 10, 70–84, https://doi.org/10.1016/j.wace.2015.06.006
11. Gonzalez, P., Tucker, C.J., Syc, H. 2012. Tree density and species decline in the African Sahel attributable to climate. Journal of Arid Environments, 78, 55 – 64, https://doi.org/10.1016/j.jaridenv.2011.11.001
~ 9 ~ 13. Ghebrezgabher M.G., Yang T., Yang X., Wang X.,
Khan M. (2016a). Extracting and analyzing forest and woodland cover change in Eritrea based on Landsat data using supervised classification. The Egyptian Journal of Remote Sensing and Space Sciences, 19, 37-47, https://doi.org/10.1016/j.ejrs.2015.09.002 14. Ghebrezgabher M.G., Yang T., Yang X., (2016b).
Long-Term Trend of Climate Change and Drought Assessment in the Horn of Africa. Advances in Meteorology, Volume 2016, Article ID 8057641, http://dx.doi.org/10.1155/2016/8057641
15. Gottschalk, L., Krasovskaia, I., Dominguez, E., Caicedo, F., Velasco, A. (2015). Interpolation of monthly runoff along rivers applying empirical orthogonal functions: Application to the Upper Magdalena River, Colombia. Journal of Hydrology,
528, 177–191,
https://doi.org/10.1016/j.jhydrol.2015.06.029
16. Hegerl, G.C., Zwiers, F. W., Braconnot, P., Gillett, N.P., Luo, Y., Marengo Orsini, J.A., Nicholls, N., Penner, J.E., Stott, P.A. (2007). Understanding and Attributing Climate Change. In: Climate Change 2007: The Physical Science Basis. Contribution of Working Group I to the Fourth Assessment Report of the Intergovernmental Panel on Climate Change [Solomon, S., D. Qin, M. Manning, Z. Chen, M. Marquis, K.B. Averyt, M. Tignor and H.L. Miller (eds.)]. Cambridge University Press, Cambridge, United Kingdom and New York, NY, USA.
17. Hein, L., de Ridder, N., Hiernaux, P., Leemans, R., de Wit, A., Schaepman, M. (2011). Desertification in the Sahel: Towards better accounting for ecosystem dynamics in the interpretation of remote sensing images. Journal of Arid Environments, 75, 1164 -1172, https://doi.org/10.1016/j.jaridenv.2011.05.002
18. Herrmann, S.M., Anyamba, A., Tucker, C.J. (2005). Recent trends in vegetation dynamics in the African Sahel and their relationship to climate. Global Environmental Change, 15, 394 – 404, https://doi.org/10.1016/j.gloenvcha.2005.08.004 19. IPCC, (2001). Climate Change 2001.
https://www.ipcc.ch/graphics/speeches/robert-watson-july-2001.pdf
20. IPCC, (2014). Summary for policymakers. In: Climate Change 2014: Impacts, Adaptation, and Vulnerability. Part A: Global and Sectoral Aspects. Contribution of Working Group II to the Fifth Assessment Report of the Intergovernmental Panel on Climate Change [Field, C.B. V.R. Barros, D.J. Dokken, K.J. Mach, M.D. Mastrandrea, T.E. Bilir, M. Chatterjee, K.L. Ebi, Y.O. Estrada, R.C. Genova, B. Girma, E.S. Kissel, A.N. Levy, S. MacCracken, P.R. Mastrandrea, and L.L. White (eds.)]. Cambridge University Press, Cambridge, United Kingdom and New York, NY, USA, pp. 1-32.
21. Irmak, A., Ranade, P.K., Marx, D., Irmak, S., Hubbard, K.G., Meyer, G.E., Martin, D.L. 2010. Spatial Interpolation of Climate Variables in Nebraska. American Society of Agricultural and Biological Engineers, 53(6), 1759-1771.
22. Kayouli, C., Tesfai, T., Tewolde, A. (2006). Country Pasture/Forage Resource Profiles ERITREA. http://www.fao.org/ag/agp/agpc/doc/counprof/PDF%2 0files/Eritrea-English.pdf
23. Mahmood, R., Babel, M.S., JIA, S. (2015). Assessment of temporal and spatial changes of future climate in the Jhelum river basin, Pakistan and India. Weather and
Climate Extremes, 10, 40–55,
https://doi.org/10.1016/j.wace.2015.07.002
24. Masanganise, J., Chipindu, B., Mhizha, T., Mashonjowa, E., Basira, K. (2013). An evaluation of the performance of global climate models (GCMs) for predicting temperature and rainfall in Zimbabwe. International Journal of Scientific and Research Publications, 3:8, August 2013.
25. McKee, T.B., Doesken, N.J., Kleist, J. (1993). The Relationship of Drought Frequency and Duration to Time Scales. Eighth Conference on Applied Climatology, 17-22, January 1993, Anaheim, California.
26. Midega, C. A.O., Bruce, T.J.A., Pickett, J.A., Pittchar, J.O., Murage, A., Khan, Z.R. (2015). Climate-adapted companion cropping increases agricultural productivity in East Africa. Field Crops Research, 180, 118–125, https://doi.org/10.1016/j.fcr.2015.05.022
27. MLWE, (2012). Eritrea’s Five Years Action Plan. For the Great Green Wall Initiative (GGWI) Draft, Department of Environment, (2011 – 2015), (pp. 3 – 12), Asmara, Eritrea
28. MOA, (2004). National Report on the Implementation of the UNCCD. Asmara, Eritrea, October, 2004. 29. Nardelli, B.B., Droghei, R., Santoleri, R. (2016).
Multi-dimensional interpolation of SMOS sea surface salinity with surface temperature and in situ salinity data. Remote Sensing of Environment, 180, 392 – 402, https://doi.org/10.1016/j.rse.2015.12.052
30. Nyssen, J., Poesen, J., Moeyersons, J., Deckers, J., Haile, M., Lang, A. (2004). Human impact on the environment in the Ethiopian and Eritrean highlands— a state of the art. Earth-Science Reviews, 64, 273–320, https://doi.org/10.1016/S0012-8252(03)00078-3 31. Ogbazghi, W., & Bein, E. (2006). Assessment of
Non-Wood Forest Products and their Role in the Livelihoods of Rural Communities in the Gash-Barka Region, Eritrea. DCG Report No. 40, January 2006. 32. Ogungbenro, S.B., & Morakinyo, T.E. (2014). Rainfall
distribution and change detection across climatic zones in Nigeria. Weather and Climate Extremes, 5-6, 1–6, https://doi.org/10.1016/j.wace.2014.10.002
33. Pricope N.G, Husak G., Lopez-Carr D., Funk C., Michaelsen J. (2013). The climate-population nexus in the East African Horn: Emerging degradation trends in rangeland and pastoral livelihood zones. Global Environmental Change, 23, 1525–1541, https://doi.org/10.1016/j.gloenvcha.2013.10.002 34. Raes, D., Willems, P., Gbaguidi, F. (2006).
RAINBOW – a software package for analysis data and testing the homogeneity of historical data and testing the homogeneity of historical data sets, Proceedings of the 4th International Workshop on ‘Sustainable management of marginal drylands’, Islamabad, Pakistan, 27-31 (in press).
~ 10 ~ 36. Stergiou, K.I., Somarakis, S., Triantafyllou, G.,
Tsiaras, K.P., Giannoulaki, M., Petihakis, G., Machias, A., Tsikliras, A.C. (2016). Trends in productivity and biomass yields in the Mediterranean Sea Large Marine Ecosystem during climate change. Environmental
Development, 17, 57–74,
https://doi.org/10.1016/j.envdev.2015.09.001
37. Stringer, L.C., Dyer, J.C., Reed, M.S., Dougill, A.J., Twyman, C., Mkwambisi, D. (2009). Adaptations to climate change, drought and desertification: local insights to enhance policy in southern Africa. Environmental Science and Policy 12, 748-765, https://doi.org/10.1016/j.envsci.2009.04.002
38. Tekeste, M. Habtzghi, D.H., Stroosnijder, L. (2007). Soil strength assessment using threshold probability approach on soils from three agro-ecological zones in Eritrea. Biosystems Engineering, 98, 470 – 478, https://doi.org/10.1016/j.biosystemseng.2007.09.004 39. Terwilliger, V.J., Eshetu, Z., Huang, Y., Alexandre,
M., Umer, M., Gebru, T. (2011). Local variation in climate and land use during the time of the major kingdoms of the Tigray Plateau in Ethiopia and Eritrea.
Catena, 85, 130–143,
https://doi.org/10.1016/j.catena.2010.08.003
40. UNICEF, 2015. Ethiopia: Drought Crisis Immediate
Needs Overview. August 2015.
http://www.unicef.org/ethiopia/ETH_Drought_crises_ 2015_pitch_doc.pdf
41. Verdin J., Funk, C., Senay, G., Choularton, R. (2005). Climate science and famine early warning. Phil. Trans.
R. Soc. B, 360, 2155–2168,
https://doi.org/10.1098/rstb.2005.1754
42. Waal, A.D. (1991). Thirty Years of War and Famine in Ethiopia. Evil Days, New York, Human Rights Watch, an African Watch Report.
43. Whan, K., Zscheischler, J., Orth, R., Shongwe, M., Rahimi, M., Asare, E.O., Seneviratne, S.I. (2015). Impact of soil moisture on extreme maximum temperatures in Europe. Weather and Climate
Extremes, 9, 57–67,
https://doi.org/10.1016/j.wace.2015.05.001
44. WMO, (2012). Standardized Precipitation Index User Guide. No. 1090, CH-1211 Geneva 2, Switzerland. WMO’s, website. Causes of Climate Change, http://www.wmo.int/pages/themes/climate/causes_of_c limate_change.php
45. Yang, X., Yang, T., Ji, Q., He, Y., Ghebrezgabher, M.G. (2014). Regional-scale grassland classification using moderate-resolution imaging spectrometer datasets based on multistep unsupervised classification and indices suitability analysis, J. Appl. Remote Sens., 8(1), https://doi.org/10.1117/1.JRS.8.083548