R E S E A R C H
Open Access
Quality of experience evaluation of voice
communication: an affect-based approach
Abhishek Bhattacharya
1*, Wanmin Wu
2and Zhenyu Yang
1* Correspondence: abhat002@cis. fiu.edu
1School of Computing and
Information Sciences, Florida International University, Miami, FL 33199, USA
Full list of author information is available at the end of the article
Abstract
Voice communication systems such as Voice-over IP (VoIP), Public Switched Telephone Networks, and Mobile Telephone Networks, are an integral means of human tele-interaction. These systems pose distinctive challenges due to their unique characteristics such as low volume, burstiness and stringent delay/loss requirements across heterogeneous underlying network technologies. Effective quality evaluation methodologies are important for system development and refinement, particularly by adopting user feedback based measurement. Presently, most of the evaluation models are system-centric (Quality of Service or QoS-based), which questioned us to explore a user-centric (Quality of Experience or QoE-based) approach as a step towards the human-centric paradigm of system design. We research an affect-based QoE evaluation framework which attempts to capture users’ perception while they are engaged in voice communication. Our modular approach consists of feature extraction from multiple information sources including various affective cues and different classification procedures such as Support Vector Machines (SVM) and k-Nearest Neighbor (kNN). The experimental study is illustrated in depth with detailed analysis of results. The evidences collected provide the potential feasibility of our approach for QoE evaluation and suggest the consideration of human affective attributes in modeling user experience.
Introduction
The voice communication industry is undergoing a rapid phase change with technolo-gies such as cellular, mobile and Internet telephony replacing the conventional tele-phone networks. Service providers are faced with offering high communication quality under more heterogeneous and dynamic networking conditions. Effective evaluation of system performance is becoming critical, which will serve as an important instrument for quality monitoring and management.
Traditional evaluation methods are very system-oriented where Quality of Service (QoS) metrics have been the de facto standards for voice communication technologies.
Recently, there is a paradigm shift towards user-oriented methodologies with the introduction of human-centric computing in the systems area [1], and the concept of Quality of Experience(QoE) is gradually gaining popularity [2-4]. SinceQoE metrics are closely related to human perception, they could potentially serve as more valuable quality indicator from the user perspective.
The main challenge of how to evaluateQoE remains largely unsolved due to its com-plexity. Over the years, different meanings have been attached to the term [5-7].
Theoretical studies from various disciplines characterizeQoE as a multi-dimensional construct which involves both subjective and objective factors intertwined in the user interaction such as perception, emotion, behavior, need, context, system and network-ing [8-14]. In practice, system developers have applied QoE assessment techniques, ranging from user feedback [15,16],QoS-based estimation [17,18] to media quality ana-lysis [19,20]. Despite the value demonstrated, each approach has limitations and weak-nesses as elucidated in related work (Related work).
In this paper, we investigate the usability of affective computing in evaluatingQoE of voice communication. Affective computing deals with the analysis of human emotional variables naturally revealed during the user-system interaction. In the process, emo-tions have been shown to have strong association with user experience regarding inter-est, satisfaction, motivation and performance [21-24]. Using signal processing, linguistic analysis, and psycho-physiological techniques, automated emotion recogni-tion is feasible by aggregating affective cues from multi-modal user input such as facial expression, speech, body gesture, and neuroimaging [25-27]. Leveraging on these find-ings, affect-aware systems are emerging that dynamically adapt according to the change of user emotions in applications of user interface, health care, education, customer ser-vice, intelligent automobile, entertainment, information retrieval and social signal pro-cessing [28-33].
Guided by the above evidences, we hypothesize that QoE or the user perception of quality in voice communication is correlated to his/her affective behavior(e.g., pitch, voice, timing and articulation), which will vary across networking conditions. To the best of our knowledge, the analysis of affective behavior and its role in the QoE evalua-tion of voice communicaevalua-tion is an unexplored area. As an initial step, we focus on experimental user studies to record changes of user affect state and examine at what level QoE is reflected from these changes.
Audio
Signal
Affect Analysis
Framework
QoE
Estimation
QoS
Audio
Signal
Affect Analysis
Framework
QoE
Estimation
Network
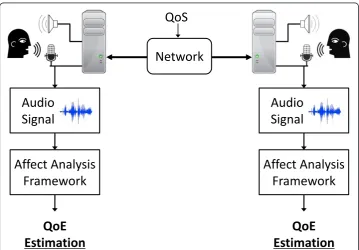
The general scheme of the experiment is given in Figure 1, which shows the network setting, the voice communication, the audio signal input, and the affect analysis frame-work that processes audio signals to produceQoE estimation.
Our study is based on the context of human-human voice communication. In a test session, two participants are engaged in natural conversation through a VoIP connec-tion mediated with varying QoS parameters (e.g., delay, loss rate, and bandwidth). During the conversation, the communication quality is tagged by user feedback (“Good“, “Average“and“Bad“). The conversation is saved and further processed by the affect analysis framework offline. The front end of the framework performs feature extraction to derive samples. The set of features are drawn from three major categories of affective signals involving acoustic, lexicaland discourse features as suggested by previous research in emotion detection [25,34-36]. The affective behavior is analyzed individually for each category as well as combined. A subset of samples are used to train classification modules. Then, the rest samples are used for performance testing. Finally, the accuracy analysis is provided by comparing the output of the affect analysis framework (i.e., QoE estimation) with the user tagged feedback.
Our contributions in this paper are the followings. Most of all, we provide a new affect-based methodology of QoE evaluation in voice communication. Different from previous approaches, we propose to assess quality directly from the user affective responses. Therefore, our method has the advantage of deriving subjective QoE mea-sures in an implicit and non-intrusive manner. The experimental results indicate very promising prospect of this approach. Regarding boarder impacts, as the communica-tion systems become more media-rich and interactive (e.g., spatial audio, 3D/immersive space), measuringQoE via indirect methods will become more challenging [4]. There-fore, our work represents an important step towards the understanding of QoE for the future generation of communication systems.
In the remainder of the paper, Related work reviews existing work on QoE evaluation in voice communication. Experimental design describes the methodologies and settings of the user study experiment. Affect analysis framework presents the details of the affect analysis framework. Results highlights the results and implications of affect-based approach on the prediction of QoE. The paper is concluded in Conclusions with discussion on future directions.
Related work
We classify available QoE evaluation methods of voice communication in three groups: (a)user feedback, (b)QoS-based estimation, and (c)media quality analysis.
User feedback
Click [15] is proposed where the user only needs to click the mouse whenever he/she feels dissatisfied with the quality. Compared with traditional user feedback, it is less intrusive: the user task is reduced from a multiple-choice decision to a dichotomous one, and the test can be performed “during“ user interaction instead of“after.” How-ever, One Click still requires direct user attention which poses cognitive overhead. For more interactive systems like gaming or 3D immersion, it implies that the user may have to pause his/her ongoing activity from time to time.
QoS-based estimation
A good amount of research has been done in this area [17,18,39-41], where QoE is estimated by modeling from the underlying QoS parameters. QoS-based methods are implicit and non-intrusive which makes them an appealing choice. However, these methods are essentially objective approximation of QoE due to lack of user engage-ment. Accordingly, they cannot cover all QoE dimensions that may affect user percep-tion and experience [15], and the discrepancy among the user populapercep-tion tend to be ignored [42]. For example, users have different sensitivity to delays under varying con-versational dynamics (e.g., various talk/silent spurt duration) [18]. It is hard to accom-modate such feature in QoS-based estimation. The correlation between QoS and QoE also becomes more intractable for advanced communication systems, which greatly complicates the modeling process [7]. Moreover, there are non-trivial technical details regarding its deployment in the field such as messaging overhead and traffic detection [43,44], and the buffer masking effect on the interaction betweenQoE and delay/loss [40].
Media quality analysis
Media quality analysis methods assess the quality by measuring the distortion of the signal based on certain analysis models like signal-to-noise ratio (SNR). More sophisti-cated ones attempt to incorporate human auditory perception such as Enhanced Bark Spectral Distortion (EBSD) and Perceptual Speech Quality Measure (PSQM) [45]. Simi-lar to QoS-based estimation, these methods do not require explicit user input. The state-of-the-art standard in this category is ITU-T P.862 [19], also known as the Perceptual Evaluation of Speech Quality (PESQ). The drawback of PESQis that it is double-ended: the algorithm requires both the original and the degraded signals to compute the quality difference [46]. Further, it fails to consider factors such as various listening levels, sidetone/talk echo, and conversational delay/interaction [15,17].
We argue that a suitable QoE evaluation method in voice communication should capture the subjectivemeasures from the user in a non-intrusivemanner. It is clear that none of the existing methods comprises of both characters. The contribution of this paper is the proposition of a new affect-based approach which opens such possibility.
Affect analysis framework
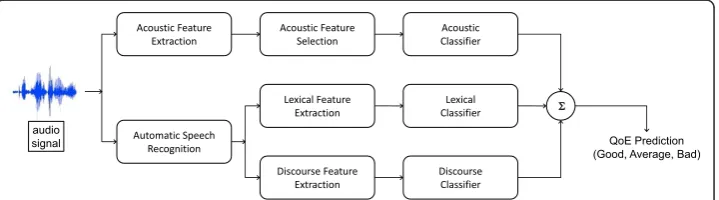
The importance and usage of acoustic features for automatic emotion detection has been well-studied [34]. However, acoustic-based methods are effective for posed expressions in staged scenarios but degrades in natural human interaction with sponta-neous expression [25]. The common wisdom is to incorporate acoustic features along with lexical and discourse features for performance enhancement [25,35]. Since we tar-get normal human-human voice communication, we include all these features in the framework. After feature extraction, the affective response is analyzed individually by the classification module of each category. In the last stage, the results are then com-bined to generate the final output of the framework (i.e.,QoE estimation).
We follow the general methodologies and technical justifications as presented in [36] for the design of the framework, but we independently completed the implementation and integration work. We briefly introduce each module of the framework in the fol-lowing sections as it is not our major focus of this research. An overview of the frame-work is presented in Figure 2.
Acoustic features
We consider 22 different acoustic attributes related to segmental and suprasegmental information of speech signals. These attributes are derived from turn-level statistics and transformations in the domains offundamental frequency, energy, duration, and formants.
•Fundamental Frequency(F0): the lowest frequency of the signal wave. We use sta-tistical functionals of mean, median, standard deviation, maximum, minimum, range (maximum-minimum) and linear regression coefficient.
• Energy (Er): computed as the Root Mean Square (RMS) of the signal, i.e.,
Er=
Nn=0x2n
N
a PCM frame of size N. Similarly, we use statistical functionals of
mean, median, standard deviation, maximum, minimum, range, and linear regression coefficient.
•Duration: computed by comparing various voiced and non-voiced regions in a tem-poral-domain analysis of the speech waveform. The individual attributes are speech-rate, duration of the longest voiced speech and ratio of voiced and unvoiced region.
• Formants: basically the resonance of human vocal tract. Formant location and bandwidth are used to identify phonetic property of human speech. We use the first and second formant frequencies (F1, F2), their corresponding bandwidths (BW1, BW2) and the mean.
Acoustic Feature Extraction
Automatic Speech Recognition
Lexical Feature Extraction
Discourse Feature Extraction Acoustic Feature
Selection
Lexical Classifier
Discourse Classifier Acoustic Classifier
6
QoE Prediction (Good, Average, Bad) audio
signal
The module of acoustic feature extraction was implemented based on the tool of openSMILE [47], an open-source software that can extract many low-level acoustic fea-tures and statistic functionals. The 22 acoustic attributes form the base feature set (denoted asBase). Generally, not all features are equally significant for affective analy-sis. Following the work of [36], we perform feature selection with an expectation to improve prediction accuracy by dropping off the least significant attributes. We employ theleave-one-out method for feature selection and thenearest neighborhoodrule for estimating accuracy. We generate two subsets from the base feature set, one has 10 best features (denoted as f10) and the other has 15 best features (denoted asf15). Lastly, we obtain another feature set by performing Principal Component Analysis (PCA) on the base feature set, which is denoted asPCA.
Lexical features
Lexical features here refer to language related information regarding the fact that peo-ple tend to choose specific words for various expressions (e.g.,“can’t“,“damn“, “bad“, and “great“) [9]. In our study, we adopt the notion of mutual information [48] to establish the correlation between words and different Qo E levels.
Denote the vocabulary V={V1, V2,,Vn} and the set of quality levelsQ={q1,q2, qm}. As mentioned earlier, we choose m = 3 (i.e., “Good“,“Average“, and “Bad“). The mutual information is given as:
I(v,q) = logPr
q|v Prq
for vÎ VandqÎ Q. Intuitively, if a word v is correlated with a quality levelq, then Pr{q|v}Pr{q} andI(v,q) is positive. If there is no correlation, then Pr {q|v} = Pr{q} and I(v,q) is zero. If v makesqless likely,I(v,q) is negative.
Given an utterance, the action for quality levelqkcan be calculated as:
ak= n
i=1
OiI(qk,vi) + log(qk)
where Oiis the likelihood that wordViis recognized in the utterance by the speech recognition module. For simplicity, we use a one-layer network where the order and sequence of words are not considered. Finally, we use {a0,a1,a2,a0,-a1,a1-a2,a2-a0}as the feature set for the lexical information. The intent of this module is to associate indicative words with respect to the different quality categories which will help for bet-ter prediction. From experimental voice data, we found that participants used words such as “Damn“, “Disgusting“ more frequently whenever they rated the quality as
“Bad.” This correlation is automatically captured by lexical module whereby these words will be marked as indicative for corresponding quality category to improve pre-diction accuracy.
indexed with the Linguistic Data Consortium catalogue and also coupled with a 125,000-word CMU pronunciation dictionary [51].
Discourse features
The value of discourse information for emotion recognition has been noted in the lit-erature, particularly combined with acoustic information to improve the accuracy [52,53]. In our study, we take a simplified approach by modeling only repetition, which is found to be the most important indicator of trouble in communication [35]. We choose from 1-word to 5-word repetitions and formulate the dimensions of discourse feature set as: number of 1-word repetition, number of 2-word repetitions, and like-wise. Moreover, we construct another repetition metric as the following:
R=
5
i=1
ri∗wi
whereriis the number ofi-word repetitions andwirepresents a proportional weigh-tage which assigns higher weight to the repetition of longer sequence of words (e.g., 5-word repetition).
Analysing experimental voice data, we found that participants used words such as
“not able to hear“,“no sound“,“pardon me“, and“please repeat“more frequently when they rated the quality as “Bad.” This correlation between the particular repetitive words and quality category label is automatically analyzed by the discourse module to improve prediction accuracy. The discourse feature extraction relies on the same auto-matic speech recognition module as described in the lexical features (Lexical features).
Classifiers
The classifiers form the core component of the framework, which is used to provide QoE prediction based on an input set of features extracted from previous feature extraction modules (shown in Figure 2). The original data set contains samples tagged with user quality feedback, which is divided into training set and testing set. For the initial training phase, samples of the training set are utilized to build a classifier. Dur-ing the testDur-ing phase, samples of the testDur-ing set are fed into the classifier (with user feedback removed) which will output QoE predictions. Then, the output is used to compare with the user feedback. Overall, 75% of the data samples are used for training and the rest 25% for testing.
Two basic types of classifiers are used here, namely Support Vector Machines(SVM) and k-Nearest Neighbors(kNN). SVM involves the construction of a set of hyperplanes by maximizing the separating distance between the nearest training data points among all classes. In contrast,kNN works by computing theknearest neighbors to the input sample based on a distance metric (by default, Euclidean) and using a majority vote among the neighbors to determine the class label of the sample. Our rationale for choosing SVM and kNN classifiers are mainly due to their effectiveness and perfor-mance benefit. Though we test various classification methods, our framework does not depend on any one particular technique.
with the radial basis function (RBF) kernel. To identify the optimal values of C (cost) and Υ(kernel parameter), we applycross-validationwith iteratively refined grid-search method [30]. The notations of the four different SVM derivatives used in our study are given as follows.
•SVM: uses fixed training and testing sets.
• SVM-5CV: divides the data into five randomly chosen segments of equal size and run five times with each run comprising of four segments for training and one seg-ment for testing (5-fold cross-validation).
•SVM-5WCandSVM-10WC: employs 2-layer hierarchical SVM model that trains 5 and 10 bottom-layer weak classifiers (5WCand10WCrespectively) on different subset of the training set and the output of each is used to train a top-layer meta-classifier.
ForkNN classifier, we trained two derivatives. Their notations are given as follows.
•kNN: similar to that ofSVM withk= 10.
•kNN-5CV: similar to that ofSVM-5CVwith an iterative number of nearest neigh-bors fromk= 1 to 15.
Since we incorporate multiple affective sources (i.e., acoustic, lexical, discourse) in our framework, we need aggregation scheme to produce a single output. One simple method is to employ feature-level fusion which merges all features from different sources into a large feature vector as the input to a single classifier. In contrast, deci-sion-levelfusion takes results from multiple classifiers to compute a single value. We take the second scheme and calculate the average of results from each classifier as the final output. As simple as it is, such method achieves pretty good performance [54,55]. For software, we use the tools of libSVM [56] for SVM classifiers and Weka eweka for kNN classifiers.
Experimental design
We designed the user study experiment for the examination of the following research hypothesis:
H: The user perception of voice communication quality is correlated to his/her affec-tive response, which will vary across networking conditions.
The main purpose of the experiment was to collect two types of data: audio signal of user conversation and the user quality feedback. For that purpose, we engaged two participants in natural conversation through a VoIP connection. During thetest, we tuned the QoS parameters of delay, loss rate and bandwidth to simulate various net-working conditions. We expect that the affect state of user as reflected from his/her voice will change accordingly, as well as his/her subjective perception of the communi-cation quality. Thus, we recorded the voice conversation and asked the user to rate the quality. The collected data were used for training and testing by the affect analysis fra-mework in the next stage (Related work).
Networking
the experiment, no other person was allowed inside the room to avoid any psychologi-cal influence on the participants.
We configured a third computer (with similar hardware settings and the same oper-ating system) to be used as a layer-2 bridge. The bridge computer had two network interface cards to connect with the two VoIP end computers. We installed the Linux brctl utility on the bridge computer to form a LAN: (VoIP end computer 1) ↔(bridge computer) ↔(VoIP end computer 2). All physical connections were based on dedi-cated wired lines with no interference from external network traffic. To simulate var-ious networking conditions, we instrumented the traffic flow between the two VoIP end computers by applying dummynet [57] on the bridge computer. The dummynet software allows us to tune the network condition with different delay, loss rate and bandwidth settings.
Voice channel
Each VoIP end computer was equipped with a Logitech headset with speaker/micro-phone for voice capturing, playback, and recording. We used the library of PortAudio [58] to record audio signals from the microphone into wav files that can be further processed by the feature extraction modules. For simplicity, each end only records its local signal for QoE evaluation. The interplay between local and remote signals would be an interesting topic for future research. We deployed PJSIP [59] as the VoIP soft-ware with G.711 codec. It is an open-source, comprehensive, and highly portable sys-tem with a small memory footprint. Although PJSIP contains lots of features, it is console-based and the basic command set is very simple. After a few minutes’ instruc-tion, all participants were capable of operating it. To facilitate the experiment, we auto-mated the communication and session management process for call initiation, connection, and recording, so that two end users only need to press a few keys to launch a test session.
Sample collection
We organized each test session based on a maximum 15-min run. The limit here was chosen basically due to our observation that it was not natural to engage two strangers in a phone conversation for over-stretched duration. Thus, to improve the efficiency of every test we divided a run into multiple 20-s intervals. Timescale of each interval is an important issue for QoE evaluation which is justified in Timescale. Each interval corresponded to a fixed setting of QoS parameters. We adopted the approach of One-Click [15] in the sense that at the end of each interval a console prompt was shown to ask for user input of quality. Different from OneClick, we employed a trichotomous or 3-point scale decision ofquality levels: “Good“, “Average“, and “Bad“. Although this experimental methodology still bears some intrusiveness, it is unavoidable in the initial study since we need user feedback for training and testing the affect analysis frame-work. The complete establishment of the framework will eventually eliminate the need of user feedback.
to the end user. Overall, one test run provided 90 samples (i.e., 45 samples from each end).
Timescale
It has been recognized that user perception of speech quality varies under different temporal scale [46]. For example, in short-term test (≈30 seconds) the beginning por-tion (at least >8 seconds) of the speech sample carries the greatest weight in the overall rating of MOS (primary effect) [60], while in long-term test (≥ 60 seconds) the last portion carries the greatest weight (recency effect) [61]. Regarding its psychological merit of human memory mechanism, these findings give us the guideline for deciding the timescale of test interval. Because user feedback is requested at the end of each interval, we should choose short duration for each interval to leverage on primary effect (but not too short). On the other hand, since the QoS parameters are fixed in one interval, there is no need to apply long duration due to the recency effect. Consid-ering previous research results and the possible interference to the user, we chose 20 s as the fixed timescale for each test interval.a
QoS classes
We employed delay (d), bandwidth (b) and loss rate (l) as the basic QoS parameters. For notation, each networking configuration is denoted as a tuple of <d,b,l>. Because the space of possible configurations isquite large, we applied a selection procedure to pick the most “distinctive“value set. In the pilot experiment, we performed the empiri-cal study to pick up a meaningful range for each parameter. First, we set the best con-figuration as gle50 ms, 100 Kbps, 0.06>. Then the worst configuration of each parameter was determined incrementally while keeping the other two as the best until the quality became intolerable. In such a way, the worst delay was set as 1200 ms, worst bandwidth 52 Kbps, and worst loss rate 0.3. Next, we picked 5 values from each parameter range evenly and aligned them together from best to worst and generated 5 Q o S classes.
•C1: <d= 50 ms,b= 100 Kbps, l= 0.06>
•C2: <d= 300 ms,b = 88 kbps,l= 0.12>
¢
d
1,
b
1,
l
1²
feedback
1¢
d
2,
b
2,
l
2²
…
¢
d
n,
b
n,
l
n²
¢
d
3,
b
3,
l
3²
test session
¢
d
,
b
,
l
²
:
d
–
delay,
b
–
bandwidth,
l
–
loss rate
feedback:
Good
/
Average
/
Bad
feedback
2feedback
3feedback
n•C3: <d= 600 ms,b = 76 kbps,l= 0.18>
•C4: <d= 900 ms,b = 64 kbps,l= 0.24>
•C5: <d= 1200 ms,b= 52 kbps, l= 0.3>
For further validation, we asked a few graduate students to run MOS-based test to rate the quality for each configuration. The test was done in a random and blind way (i.e., the students were not aware of the configuration). The average rating resultscon-firmed clearly the quality difference between each configuration.
Participants
We recruited 15 participants from two mid-level undergraduate classes, namely, Java Programming and Computer Networks [1]. We found that selecting students from same classes provided better conversation control, for example, the familiarity and the common interest (details in Conversation). All students were proficient with English language (6 native, 7 advanced and 2 intermediate speakers). Among them, 11 were male and 4 were female, between 18-38 years of age (M= 25.54, SD= 3.38). They had a mean of 3.67 years of using VoIP service and all claimed to have been using at least one VoIP service in the past (with the most popular being Skype followed by GTalk).
For better control of the test (more in Conversation) and regarding the difficulty of accommodating each participant’s schedule, in each test session a graduate student was assigned to play one VoIP end with another undergraduate student at the other end (i.e., the real participant). So there were totally 15 test sessions. For statistic valid-ity, the samples from the graduate student were discarded. Participation in the experi-mental study was considered as a benefit by the students and no monetary compensation was involved, since the conversation topics were chosen from course materials as discussed later.
Questionnaire
Before the experiment, each participant was introduced with the experimental details following IRB required procedures. Then he/she was asked to complete an Entry Ques-tionnaire at the beginning of the study for collecting background/demographic infor-mation, and their previous experience with VoIP if any. Exit Questionnaires were also provided at the end of each session to elicit subjective experience of the user for the entire audio conversation. The questionnaire gathered information on the subjective quality perception and the evaluation criterion, as well as the participant’s view of the importance of affective feedback regarding the usability and ethical outcome (for IRB purposes). Some of the questions are listed below:
Q: What is your overall perception of the system? Q: Did the system perform as per your expectation?
Q: Were you able to interact with the system without any problems?
Q: Did you feel any external or environmental influence during the experiments? Q: Did you expect any more help from the system?
Conversation
topics. However, the cultural and emotional influence of the topic on each user would be hard to predict and may interfere with his/her experience. The ITU recommenda-tion also suggests that the content should be “neither so interesting nor so disagreeable or boring” [63]. To make the communication more controllable, we decided to give quiz-like conversation formed using course-related materials with low-level difficulty. The graduate student (actually the TA of the class) presented some questions and dis-cussed with the student. This kind of conversation can be easily engaged and the topic is neutral. Moreover, to avoid over-burdening the participants, we embedded some brief comments on general topics or short riddles from time to time to provide cogni-tive relief.
It is observed that in some cases the conversation itself might have invoked emo-tional responses that are not related to communication quality perception. In the experiment, we attempted to reduce this kind of effect by preferring neutral conversa-tional content as described. However, in the real scenario, people do engage with heated conversational dialog among themselves. In our preliminary experiment, we tried to filter out“emotional noise” from the perspective of conversational content by considering lexical and discourse features such as salient words and repetitions. Note that, such drawback is inherent in any type of subjective assessment including MOS. This challenging issue deserves further study which is the focus of our future work.
Results
In this section we present the experimental results of our study based on test sessions collected from 15 subjects. One finding of interest is the performance of QoE predic-tion where we compared the output from the affect-based framework with the user feedback (both on a 3-point scale of quality levels). We also highlight other results and implications regarding the interaction between QoS setting, user feedback and quality prediction.
Performance of estimation
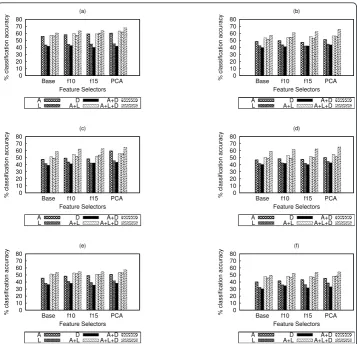
We conducted a comprehensive study of estimation accuracy along three dimensions as introduced in Affect analysis framework: (1) different classifiers of SVM and kNN, (2) different combinations of affective sources (acoustic: A, lexical: L and discouse: D), and (3) different feature selection schemes (Base, f10, f15, and PCA), which are shown in Figure 4. The overall findings are summarized as follows: (a) combining other affec-tive sources with acoustic features consistently improves the performance where the best results appear from the aggregation of all sources (A + L + D), (b) considering single source, QoE prediction based on acoustic source is more accurate than the other two whereas the performance of lexical source is slightly better than that of dis-course source, and (c) the performance impact of different feature selection schemes is less noticeable in kNN classifiers than SVM classifiers.
performance is achieved with SVM 5-fold cross-validation and PCA-based feature selection, which gives an accuracy of 67.9%.
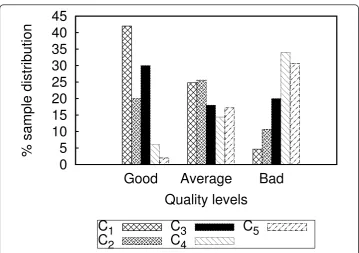
QoS distribution
We next examine the distribution of QoS classes among various user quality ratings. Recall that, each conversation interval is initialized by applying a particular QoS class (i.e., C1, C2, C5, QoS Classes) to set the networking condition and a quality rating is
recorded from the user feedback at the end of theinterval. Figure 5 shows the
0 10 20 30 40 50 60 70 80
Base f10 f15 PCA
% classification accuracy
Feature Selectors (a) A L D A+L A+D A+L+D 0 10 20 30 40 50 60 70 80
Base f10 f15 PCA
% classification accuracy
Feature Selectors (b) A L D A+L A+D A+L+D 0 10 20 30 40 50 60 70 80
Base f10 f15 PCA
% classification accuracy
Feature Selectors (c) A L D A+L A+D A+L+D 0 10 20 30 40 50 60 70 80
Base f10 f15 PCA
% classification accuracy
Feature Selectors (d) A L D A+L A+D A+L+D 0 10 20 30 40 50 60 70 80
Base f10 f15 PCA
% classification accuracy
Feature Selectors (e)
A
L A+LD A+L+DA+D
0 10 20 30 40 50 60 70 80
Base f10 f15 PCA
% classification accuracy
Feature Selectors (f)
A
L A+LD A+L+DA+D
Figure 4Classification accuracy for different combinations of affective sources (A = Acoustic, L = Lexical, D = Discourse), feature selection schemes (Base, f10, f15, PCA) and different classification techniques of (a) xtitSVM, (b)SVM-5WC, (c)SVM-10WC, (d)SVM-5CV, (e)kNN, and (f)kNN-5CV.
Table 1 Classification accuracy with different feature sets versus varying classifiers from the combination of all affective sources (A+L+D)
Classifier Model Base f10 f15 PCA
SVM 57.3 61.1 62.5 65.7
SVM-5WC 58.7 62.3 62.7 64.8
SVM-10WC 58.9 61.5 62.4 65.2
SVM-5CV 60.6 63.7 64.1 67.9
kNN 49.7 52.8 53.1 54.3
distribution of the five different QoS classes with respect to the user feedback for
“Good“,“Average“, and“Bad“ quality ratings. As seen, the highest portion of“Good“ quality rating is associated with QoS class C1(42.0%), and the overall trend is
decreas-ing from C1 toC5. However, quite interestingly the results also show that C3 contri-butes morefor “Good“ quality rating (30.0%) in comparison with C2 (20.0%). In a
similar way,C4 takes the highest distribution for“Bad“quality rating (34.0%) which is more than C5 (30.67%). For the“Average” case, the quality rating is more evenly dis-tributed across all QoS classes. Although more rigorous study is still needed, the find-ing of our preliminary study does imply that the correspondence between different quality ratings and networkQoS classes does not always bear a close coherent relation-ship. This seems to validate our previous observation that solely QoS-based estimation is not sufficient for QoE prediction as discussed in related work.
Correlation in QoS classes
From another angle, the results of correlation between the user quality feedback and the quality prediction are given for each QoS class in Table 2 using different calcula-tion methods (Pearson, Kendall and Spearman). It is observed that different network QoS classes have varied correlation impact: QoS classes of C1andC5demonstrate the highest correlation, C2andC4 stay as the intermediate cases, whileC3 has the lowest correlation. The implication wecan draw here is that QoE prediction tends to be more accurate if the underlying networking condition is either very good or very bad, and becomes less accurate for mid-range networking conditions. The finding also suggests that we should be more careful to apply QoS-based estimation. The usage of such methods need to take into account of different QoS contexts (e.g., extreme vs. average conditions).
0
5
10
15
20
25
30
35
40
45
Good
Average
Bad
% sample distribution
Quality levels
C
1
C
2
C
3
C
4
C
5
Implication of quality ratings
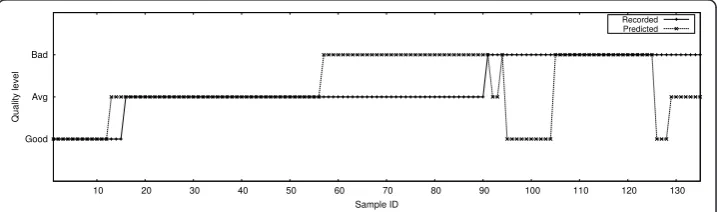
Finally, we examine the interaction between user quality ratings and the predictions made by the affect analysis framework. We refer to the results of SVM-5CVonly since it is the classifier of the best performance as observed in Section fsubsec:accuracy. The testing samples are plotted in Figure 6 which shows the values of user quality rating as well as the prediction. For better visualization, the testing samples are ordered with respect to the user quality ratings from“Good“,“Average“, to“Bad.”
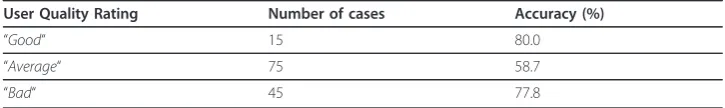
Table 3 summarizes the number of user ratings in each quality level and the corre-sponding prediction accuracy. Some of the observations from the table are as follows: (a) though the number of“Good“ quality ratings are low but it still has a high degree of prediction accuracy (80%), (b) the number of“Bad“ quality ratings are much more in number with a comparable degree of prediction accuracy (77.78%), and (c) the
“titAverage”quality ratings have a relatively low degree of accuracy (58.67%) compared to the other two but it has the most number of cases. The study shows that quality rating of “Average“ seems to be more ambiguous than the ratings of”Good“and “Bad.” The reason may be that people tend to rate“Average“more frequently across different network conditions (also shown in other studies as well).
Conclusions
We have presented a user study experiment to evaluate an affect-based approach of QoE evaluation in voice communication, which represents a new and unexplored area. The purpose of the study is to examine how user affective behavior changes with the communication quality as mediated through different network QoS conditions, and how such changes can be detected and used to predict QoE from the user perspective. We evaluated the effectiveness of this approach by using classification techniques based on SVM and kNN to discriminate different quality perceptions and compare with user feedback. The accumulated evidence supports our initial hypothesis of
Table 2 Correlation tests of the quality prediction from the testing samples
Selection Pearson Spearman Kendall
C1 0.8068 0.7856 0.784
C2 0.5424 0.5338 0.507
C3 0.1026 0.0871 0.0752
C4 0.5572 0.4766 0.4743
C5 0.7321 0.7319 0.7325
Overall 0.5697 0.5351 0.5608
Good Avg Bad
10 20 30 40 50 60 70 80 90 100 110 120 130
Quality level
Sample ID
Recorded Predicted
exploiting affective responses as the predictor of subjective experience of quality due to its correlation with human cognitive perception. Our best performance achieves a pre-diction accuracy of 67.9%. Although we refrain from claiming that our methodology can cover the entire spectrum of QoE evaluation factors, our study provided contribu-tory illustrations for affective information to be considered as a relevant indicator. Since our work represents the first attempt in this area, a cross comparison with related existing approaches will be difficult. For example, our system is not directly comparable to QoS-based estimation methods because the latter provides objective measures. The QoE estimation will be the same for one single QoS setting which ignores the variation of the user group. We are aware that our present study still has certain limitations such as the potential emotional influence. It seems likely that in some cases the conversation itself might have invoked emotional responses that are not related to communication quality perception. We are presently working on this aspect to filter out the“emotional noise.”
We plan to continue our current research along the following possible directions in the future: (a) to study other affective cues (e.g., laughter and sigh) on the subjective quality of experience, (b) to integrate other discourse related attributes (e.g., rephrase, reject and ask over) in the present framework for further evaluation, (c) to improve the implementation for real-time processing, and (d) to investigate an integration of both subjective and objective QoE evaluation methods. Finally, our testing method applies QoS settings to the communication channel in a random fashion, which could be improved by following real Internet traces to simulate a more realistic testing environ-ment [64,65].
Endnote
a
The ITU-T recommendation for the subjective assessment of sound quality also sug-gests the clip duration from 15 to 20 s, and the minimum number of participants in an experiment to be between 10 and 20 [63].
Acknowledgements
This study is supported by the National Science Foundation (NSF) under CSR-1116023. The presented views are those of authors and do not represent the position of NSF.
Author details
1
School of Computing and Information Sciences, Florida International University, Miami, FL 33199, USA2Department of Computer Science, University of Illinois at Urbana-Champaign, Urbana, IL 61801, USA
Authors’contributions
AB carried out the framework-experiment design, implementation, experimental data collection and analysis, and manuscript drafting phases of the above work. WW participated in the high-level design, manuscript drafting, and the analysis phase of the work. ZY was involved with the design, experimental analysis, and manuscript editing phase of the work. All authors read and approved the final manuscript.
Competing interests
The authors declare that they have no competing interests.
Table 3 Correlation tests of the quality prediction from the testing samples
User Quality Rating Number of cases Accuracy (%)
“Good“ 15 80.0
“Average“ 75 58.7
Received: 21 November 2011 Accepted: 20 March 2012 Published: 20 March 2012
References
1. Jaimes A, Sebe N, Gatica-Perez D (2006) Human-centered computing: a multimedia perspective. ACM international conference on Multimedia. MULTIMEDIA‘06, New York http://doi.acm.org/10.1145/1180639.1180829
2. Jain R (2004) Quality of experience. Multimedia IEEE 11
3. Tasaka S, Yoshimi H, Hirashima A, Toshiro N (2008) The effectiveness of a QoE-based video output scheme for audio-video ip transmission. ACM international conference on Multimedia. MM‘08, New York http://doi.acm.org/10.1145/ 1459359.1459395
4. Ebrahimi T (2009) Quality of multimedia experience: past, present and future. ACM international conference on Multimedia. MM‘09, New York http://doi.acm.org/10.1145/1631272.1631275
5. Subjective audiovisual assessment methods for multimedia experience. Tech. rep., ITU-T Rec (1998) 911
6. Beauregard R, Corriveau P (2007) User experience quality: a conceptual framework for goal setting and measurement. International conference on Digital human modeling. ICDHM’07, Springer-Verlag, Berlin http://portal.acm.org/citation. cfm?id=1784074.1784114
7. Wu W, Arefin A, Rivas R, Nahrstedt K, Sheppard R, Yang Z (2009) Quality of experience in distributed interactive multimedia environments: toward a theoretical framework. ACM international conference on Multimedia. MM‘09, New York http://doi.acm.org/10.1145/1631272.1631338
8. Forlizzi J, Battarbee K (2004) Understanding experience in interactive systems. Conference on Designing interactive systems: processes, practices, methods, and techniques. DIS‘04, New York http://doi.acm.org/10.1145/1013115.1013152 9. Csikszentmihalyi M (1990) Flow: The psychology of Optimal Experience. Harper and Row
10. Varela F, Thompson E, Rosch E (1992) The Embodied Mind: Cognitive Science and Human Experience. The MIT Press 11. Hobbs D, Stuart B (1982) Sociology and the human experience. Wiley
12. Abowd G, Mynatt E, Rodden T (2002) The human experience [of ubiquitous computing]. Pervasive Computing, IEEE 1 13. Davis FD, Bagozzi RP, Warshaw PR (1989) User acceptance of computer technology: a comparison of two theoretical
models. Manag Sci 35(8)http://www.jstor.org/stable/2632151
14. Venkatesh V, Morris MG, Davis GB, Davis FD (2003) User acceptance of information technology: toward a unified view. MIS Quarterly 27(3)http://www.jstor.org/stable/30036540
15. Chen KT, Tu CC, Xiao WC (2009) OneClick: a framework for measuring network quality of experience. INFOCOM 2009 IEEE
16. ITU (1996) ITU-T Recommendation P.800:Methods for subjective determination of transmission quality. Geneva 17. Chen KT, Huang CY, Huang P, Lei CL (2006) Quantifying Skype user satisfaction. Proceedings of the 2006 conference on
Applications, technologies, architectures, and protocols for computer communications. SIGCOMM‘06, New York 18. Sat B, Wah BW (2007) Playout scheduling and loss-concealments in voip for optimizing conversational voice
communication quality. ACM International conference on Multimedia. MULTIMEDIA‘07, New York http://doi.acm.org/ 10.1145/1291233.1291260
19. ITU (2001) Perceptual evaluation of speech quality (PESQ): An objective method for end-to-end speech quality assessment of narrow-band telephone networks and speech codes. Geneva
20. ITU (2005) ITU-T Recommendation G.107. The E-model, a computational model for use in transmission planning. Geneva
21. Nahl D (2004) Measuring the affective information environment of web searchers. American society for information science and technology 41http://dx.doi.org/10.1002/meet.1450410122
22. Nahl D (1998) Learning the Internet and the structure of information behavior. J Am Soc Inf Sci 49http://portal.acm.org/ citation.cfm?id=288129.288148
23. Tenopir C, Wang P, Zhang Y, Simmons B, Pollard R (2008) Academic users’interactions with sciencedirect in search tasks: affective and cognitive behaviors. Inf Process Manage 44http://portal.acm.org/citation.cfm?id=1314720.1315078 24. Kracker J (2002) Research anxiety and students’perceptions of research: an experiment. Part I: Effect of teaching
Kuhlthau’s ISP model. J Am Soc Inf Sci Technol 53http://portal.acm.org/citation.cfm?id=507286.507289
25. Zeng Z, Pantic M, Roisman G, Huang T (2009) A survey of affect recognition methods: audio, visual, and spontaneous expressions. Pattern Analysis and Machine Intelligence, IEEE Transactions on 31
26. Kapoor A, Picard RW (2005) Multimodal affect recognition in learning environments. ACM international conference on Multimedia. MULTIMEDIA‘05, New York http://doi.acm.org/10.1145/1101149.1101300.
27. Pelachaud C (2005) Multimodal expressive embodied conversational agents. ACM international conference on Multimedia. MULTIMEDIA‘05, New York http://doi.acm.org/10.1145/1101149.1101301.
28. Calvo R, D’Mello S (2010) Affect detection: an interdisciplinary review of models, methods, and their applications. IEEE Trans Affect Comput 1
29. Arapakis I, Jose JM, Gray PD (2008) Affective feedback: an investigation into the role of emotions in the information seeking process. ACM SIGIR conference on Research and development in information retrieval. SIGIR‘08, New York 30. Arapakis I, Konstas I, Jose JM (2009) Using facial expressions and peripheral physiological signals as implicit indicators of
topical relevance. ACM international conference on Multimedia. MM‘09, New York
31. Vinciarelli A, Pantic M, Bourlard H, Pentland A (2008) Social signal processing: state-of-the-art and future perspectives of an emerging domain. ACM international conference on Multimedia > MM‘08, New York http://doi.acm.org/10.1145/ 1459359.1459573
32. Vinciarelli A, Pantic M, Bourlard H (2009) Social signal processing: Survey of an emerging domain. Image Vision Comput 27:1743–1759http://dl.acm.org/citation.cfm?id=1621144.1621310. doi:10.1016/j.imavis.2008.11.007.
33. Curhan JR, Pentland A (2007) Thin slices of negotiation: predicting outcomes from conversational dynamics within the first 5 minutes. J Appl Psychol 92(3):802–811http://www.sciencedirect.com/science/article/pii/S0021901007670058 34. Cowie R, Douglas-Cowie E, Tsapatsoulis N, Votsis G, Kollias S, Fellenz W, Taylor J (2001) Emotion recognition in
human-computer interaction. Signal Processing Magazine, IEEE 18
36. Lee CM, Narayanan S (2005) Toward detecting emotions in spoken dialogs. IEEE Transactions on Speech and Audio Processing 13(2)
37. Knoche H, Meer HGD, Kirsh D (1999) Utility curves: mean opinion scores considered biased. International conference on Quality of Service. IWQoS’99
38. Watson A, Sasse MA (1998) Measuring perceived quality of speech and video in multimedia conferencing applications. ACM international conference on Multimedia. MULTIMEDIA‘98, New York http://doi.acm.org/10.1145/290747.290755 39. Markopoulou A, Tobagi F, Karam M (2002) Assessment of VoIP quality over Internet backbones. INFOCOM 2002.
Twenty-First Annual Joint Conference of the IEEE Computer and Communications Societies. Proceedings. IEEE 1 40. Wu CC, Chen KT, Huang CY, Lei CL (2009) An empirical evaluation of VoIP playout buffer dimensioning in Skype,
Google talk, and MSN Messenger. International workshop on Network and operating systems support for digital audio and video. NOSSDAV‘09, New York
41. Graubner M, Mogre PS, Steinmetz R, Lorenzen T (2010) A new QoE model and evaluation method for broadcast audio contribution over IP. Internatio nal workshop on Network and operating systems support for digital audio and video. NOSSDAV‘10, New York http://doi.acm.org/10.1145/1806565.1806581
42. Chen KT, Wu CC, Chang YC, Lei CL (2009) A crowdsourceable QoE evaluation framework for multimedia content. ACM international conference on Multimedia. MM‘09, New York http://doi.acm.org/10.1145/1631272.1631339
43. Baset SA, Schulzrinne HG (2006) An analysis of the skype peer-to-peer internet telephony protocol. IEEE International Conference on, Computer Communications
44. Bonfiglio D, Mellia M, Meo M, Rossi D, Tofanelli P (2007) Revealing skype traffic: when randomness plays with you. Proceedings of the 2007 conference on Applications, technologies, architectures, and protocols for computer communications. SIGCOMM‘07, New York http://doi.acm.org/10.1145/1282380.1282386
45. Falk T, Chan WY (2006) Single-Ended speech quality measurement using machine learning methods. Audio, Speech, and Language Processing, IEEE Transactions on 14(6)
46. Rix A, Beerends J, Kim DS, Kroon P, Ghitza O (2006) Objective assessment of speech and audio quality - technology and applications. IEEE Trans Audio Speech Language Process 14(6)
47. Eyben F, Wöllmer M, Schuller B (2010) OpenSMILE: the munich versatile and fast open-source audio feature extractor. ACM international conference on Multimedia. MM‘10, New York http://doi.acm.org/10.1145/1873951.1874246 48. Gorin A, Levinson S, Miller L, Gertner A, Ljolje A, Goldman E (1990) On adaptive acquisition of language. Acoustics,
Speech, and Signal Processing, 1990. ICASSP-90., 1990 International Conference on 1
49. Woodland P, Odell J, Valtchev V, Young S (1994) Large vocabulary continuous speech recognition using HTK. Acoustics, Speech, and Signal Processing, 1994. ICASSP-94., 1994 IEEE International Conference on, Volume ii. II/125 -II/128 2 50. Vertanen K Baseline wsj acoustic models for htk and sphinx: training recipes and recognition experiments. 51. English gigaword linguistic data consortium, Philadelphia.http://www.ldc.upenn.edu/Catalog/CatalogEntry.jsp?
catalogId=LDC2003T05
52. Ang J, Dhillon R, Krupski A, Shriberg E, Stolcke A (2002) Prosody-based automatic detection of annoyance and frustration in human-computer dialog. ICSLP
53. Interactions ICM, Arunachalam S, Gould D, Andersen E, Byrd D, Narayanan S (2001) Politeness and frustration language. Eurospeech
54. Kittler J, Hatef M, Duin R, Matas J (1998) On Combining Classifiers. IEEE Transactions on Pattern Analysis and Machine Intelligence 20(3)
55. Tax DMJ, van Breukelen M, Duin RPW, Kittler J (2000) Combining multiple classifiers by averaging or by multiplying? Pattern Recognit 33(9)http://www.sciencedirect.com/science/article/B6V14-40961WK-7/2/
9624dda26ddc086458febdde9f819862
56. Chang CC, Lin CJ LIBSVM: a library for support vector machines.http://www.csie.ntu.edu.tw/cjlin/libsvm
57. Rizzo L (1997) Dummynet: a simple approach to the evaluation of network protocols. SIGCOMM Comput Commun Rev 27http://doi.acm.org/10.1145/251007.251012
58. PortAudio: Portable Cross-Platform Audio I/O.http://www.portaudio.com
59. PJSIP: Open source SIP stack and media stack for presence, instant messaging, and multimedia communication.http:// www.pjsip.org
60. Gray P, Massara R, Hollier M (1997) An experimental investigation of the accumulation of perceived error in time-varying speech distortions. Audio Engineering Society Convention 103http://www.aes.org/e-lib/browse.cfm?elib=7191 61. Rosenbluth JH (1998) Testing the quality of connections having time varing impairments. ITU-T del cont COM12-D64 62. Woodruff A, Aoki PM (2004) Conversation analysis and the user experience. ACM SIGCHI workshop on exploring
experience methods across disciplines
63. ITU (2003) ITU-T Rec. BS.1284-1: General methods for the subjective assessment of sound quality. Geneva 64. CMU pronounciation dictionary.http://www.speech.cs.cmu.edu/cgi-bin/cmudict
65. Hall M, Frank E, Holmes G, Pfahringer B, Reutemann P, Witten IH (2009) The WEKA data mining software: an update. SIGKDD Explor Newsl 11http://doi.acm.org/10.1145/1656274.1656278
doi:10.1186/2192-1962-2-7
Cite this article as:Bhattacharyaet al.:Quality of experience evaluation of voice communication: an affect-based