A Study on Naive Bayes Text Classification
Algorithm Based on Position Weighting
1Yonghe Lu
School of Information Management Sun Yat-sen University
Guangzhou, China [email protected]
2Jinghuang Chen
School of Information Management Sun Yat-sen University
Guangzhou, China
3Jianhua Chen
School of Information Management Sun Yat-sen University
Guangzhou, China
Abstract—The Naive Bayes algorithm in text
classification has the limitation of the hypothesis: each attribute is independent in the algorithm. Attribute weighting is an effective method to improve Naive Bayes algorithm, and different positions of feature words in a document have different impacts on text classification. Therefore, in this paper, we introduce the position weighting values into Naive Bayes algorithm and we propose Position-Bayes algorithm. In order to get a higher text
classification precision, Particle swarm
optimization (PSO) algorithm is used to optimize the position weighting values. The experimental results show that compared with Naive Bayes algorithm, Position-Bayes algorithm has better performance in the text classification precision in different dimensions.
Keywords—Naive Bayes algorithm; text classification; position weighting; particle swarm optimization algorithm
I. INTRODUCTION
Text classification is the process of automatically classifying specific text according to its content into one or more predefined text categories [1]. These classification algorithms include Naive Bayes, KNN, Support Vector Machine (SVM), Decision Tree, Neural Network and so on.Among them, Naive Bayes algorithm has the advantages of faster classifying and higher classification precision, and has been mainly used in spam filtering [2], text classification [3][4], credit evaluation of financial industry [5][6], face recognition [7], traffic modeling [8] and other fields.
However, Naive Bayes algorithm is based on the assumption of “conditional independence”. In fact, there are correlations among feature attributes. Therefore, many scholars have improved Naive Bayes algorithm.
Firstly, improving the methods of feature selection makes the feature attributes more independent. For example, Y. Zhang et al. improved Naive Bayes classification algorithm by merging the related feature words to make the feature attributes more independent [9]. Y. Zhang and L. Zhang removed
redundant correlated feature words by using associated feature algorithm, which improved the performance of Naive Bayes classification algorithm [10].
Secondly, improving Naive Bayes classification algorithm makes it reflect the correlations among the attributes or weaken the impact of the “conditional independence” hypothesis on text classification. For instance, Friedman et al. proposed TAN (Tree Augmented Naive Bayes) tree-model to make Naive Bayes contain the dependencies among attributes [11]. Bai et al. clustered the word clusters according to the probability distributions of the feature words in the training set, and then established the ordered subsequences by calculating the mutual information among the words and the clusters to improve the accuracy of Naive Bayes classification algorithm [12]. Lee extracted strongly correlated keywords and calculated the prior probability of keywords to improve the performance of Naive Bayes classification algorithm in the field of text classification [13]. Y. Chen et al. constructed the three weighting values including discrimination, representativeness and word frequency, which improved the Naive Bayes algorithm, and the experiments on Uyghur corpus show that the improved algorithm can reach a higher classification precision [14]. L. Jiang et al. proposed a new model LWNBTC to reduce the effect of the attributes dependency on text classification by locally weighting method [15].
Because the existing methods do not consider the impacts of the positon of feature attributes in documents on text classification, we propose a position-weighted Naive Bayes classification algorithm, also called “Position-Bayes”, to reduce the impact of the "conditional independence" hypothesis of Naive Bayes algorithm, and the position weighting values of each feature attribute are calculated by Particle Swarm Optimization (PSO) algorithm. Finally, our experimental results show that the performance of Position-Bayes algorithm is better than Naive Bayes algorithm.
II. POSITION-BAYES ALGORITHM
Vol. 3 Issue 1, January - 2017 document. Some scholars have introduced the
positions of sentences into information extraction and have improved the performance of information extraction [16]. Considering the different posteriori probability density of each category which is caused by the difference of the position of the feature words in documents, we propose a position weighting method to improve the Naive Bayes text classification algorithm, and the details are as follows.
Let 𝑊={𝑊1, 𝑊2,… …, 𝑊𝑛} represent n different characteristic attributes, n represent the number of feature dimensions in the text classification, C={𝐶1, 𝐶2,
……, 𝐶𝑚} represent a categories set, m represent the number of categories, wi represent a specific value of
Wi, and X={𝑤1, 𝑤2,……, 𝑤𝑛}represent an instance of a document. And the procedures are as follows.
Step 1: Divide the words of an article into k
segments according their positions, and initialize the weighting value of each segment. The value of k is based on the specific length of an article or specific scene. The corpus used in this paper is Reuters Corpus and we set kas 10. According to (1) and (2), we divide the words of a document into ksegments:
𝑛𝑢𝑚(𝑝𝑜𝑠𝑖𝑡𝑖𝑜𝑛) = 𝐹 (𝑝𝑜𝑠𝑖𝑡𝑖𝑜𝑛−1
𝑙𝑒𝑛𝑔𝑡ℎ × 100 𝑘⁄ ) (1)
𝐹𝑤(𝑝𝑜𝑠𝑖𝑡𝑖𝑜𝑛) = 𝑝𝑜𝑠[𝑛𝑢𝑚(𝑝𝑜𝑠𝑖𝑡𝑖𝑜𝑛)] (2)
Where 𝑝𝑜𝑠𝑖𝑡𝑖𝑜𝑛 represents the position of the feature word. For example, if the feature word 𝑡 is the 5th word in the document, 𝑝𝑜𝑠𝑖𝑡𝑖𝑜𝑛 will be set as 5. 𝑙𝑒𝑛𝑔𝑡ℎ represents the length of the document. In this paper, we use the number of words to measure the length of the document. For example, if there are 150 words after word segmentation in the document, 𝑙𝑒𝑛𝑔𝑡ℎ will be set as 150.
And𝐹( ) is a rounded down function, such as F (1.6) = 1, F (0.1) = 0. Equation (1) is used to calculate the value of segment where the feature word appears in the document. It can be deduced that when k = 10, if the feature word appears at the top 10% in the document, the value of position is 10% of 𝑙𝑒𝑛𝑔𝑡ℎ, so 𝐹(𝑝𝑜𝑠𝑖𝑡𝑖𝑜𝑛−1
𝑙𝑒𝑛𝑔𝑡ℎ × 100 𝑘⁄ ) is 0; if position is between top
10% and top 20% (including 20%),
𝐹(𝑝𝑜𝑠𝑖𝑡𝑖𝑜𝑛−1
𝑙𝑒𝑛𝑔𝑡ℎ × 100 𝑘⁄ ) is 1; and so on. Therefore, the values corresponding to 1st segment to 𝑘th segment are 0, 1, 2, ..., 𝑘 −1, respectively.
Where 𝑝𝑜𝑠[ ] is a k-dimension array containing position weighting adjusted values in the document which is divided into 𝑘 segments, and its indices are from 0 to 𝑘 − 1. It can be deduced that 𝑝𝑜𝑠[0] represents the position weighting adjusted value of the 1st segment in the document, 𝑝𝑜𝑠[1] represents the position weighting adjusted value of the 2nd segment, ..., and 𝑝𝑜𝑠[k-1] represents the position weighting adjusted value of the 𝑘th
segment. And the values of the array 𝑝𝑜𝑠[ ] need to be optimized by Particle Swarm Optimization algorithm.
Step 2: Calculate the adjusted value of position weighting of each feature word corresponding to each document. The adjusted value of position weighting of the feature word 𝑊𝑖 in a document 𝑑𝑘 is calculated according to (3):
𝐷𝑜𝑐_𝑃𝑤(𝑑𝑘, 𝑊𝑖)= ∑ 𝐹𝑤(𝑃𝑜𝑠𝑖𝑡𝑖𝑜𝑛(𝑗,𝑖)) 𝑚(𝑊𝑖,𝑑𝑘)
𝑗=1 (3)
Where 𝑚(𝑊𝑖, 𝑑𝑘) is the frequency of the feature attribute 𝑊𝑖 appearing in the document 𝑑𝑘 . 𝑃𝑜𝑠𝑖𝑡𝑖𝑜𝑛(𝑗,𝑖) represents the value of the position where the feature attribute 𝑊𝑖 appears for the jth time in the document 𝑑𝑘. For example, the position where 𝑊𝑖 appears for the 2nd time in the document 𝑑𝑘 is 8th, then 𝑃𝑜𝑠𝑖𝑡𝑖𝑜𝑛(2,𝑖)= 8.
Step 3: Calculate the adjusted value of position weighting of each feature attribute in the training set and the testing set. The adjusted values of position weighting of feature attribute 𝑊𝑖 in the category 𝐶𝑗 of the training set and in the testing document X are calculated respectively as (4) and (5):
𝑇𝑟𝑎𝑖𝑛_𝑃𝑤(𝐶𝑗, 𝑊𝑖) = ∑ (𝐷𝑜𝑐_𝑃𝑤(𝑑𝑘, 𝑊𝑖)) 𝑀(𝑊𝑖,𝐶𝑗)
𝑘=0 (4)
𝑇𝑒𝑠𝑡_𝑃𝑤(𝑊𝑖)= 𝐷𝑜𝑐_𝑃𝑤(𝑋, 𝑊𝑖) (5) Where𝑀(𝑊𝑖, 𝐶𝑗) is the number of documents with feature attribute 𝑊𝑖in the category 𝐶𝑗 of the training set, and the category of 𝑑𝑘 is 𝐶𝑗. 𝑇𝑟𝑎𝑖𝑛_𝑃𝑤(𝐶𝑗, 𝑊𝑖) is the adjusted value of position weighting of feature attribute 𝑊𝑖 in the category 𝐶𝑗 of the training set. 𝑇𝑒𝑠𝑡_𝑃𝑤(𝑊𝑖) is the adjusted value of position weighting of feature attribute 𝑊𝑖 in the test document
X.
Step 4: Add the values of position weighting of each feature attribute in the training set and the testing set to the Naive Bayes classification algorithm, and classify the documents in the testing set. The classification result of the document X can be calculated by the improved Naive Bayes classification algorithm according to (6):
𝐶 ∗= 𝑎𝑟𝑔 𝑚𝑎𝑥𝐶
𝑗∈ 𝐶 (∏ (𝑃(𝑤𝑖|𝐶𝑗) ∗ 𝑃(𝐶𝑗) ∗ 𝑛
𝑖=1
𝑇𝑟𝑎𝑖𝑛_𝑃𝑤 (𝐶𝑗, 𝑊𝑖) ∗ 𝑇𝑒𝑠𝑡_𝑃𝑤(𝑊𝑖))) (6)
III. THE OPTIMIZATION OF THE POSITION WEIGHTING VALUES
In order to find the optimal position weighting values, we use Particle Swarm Optimization algorithm to make an iterative calculation, and the details are as follows.
The velocity of the particle i is denoted as
Vi=(vi1,vi2, …,viD), the position of the particle i is
denoted as Xi=(xi1,xi2, …,xiD), and the best position
where the particle i has been is denoted as Pi=(pi1,pi2, …,piD), also called pbest. The best position where all the
also called gbest. All particles have a fitness value
calculated by the fitness function. For the particles of each generation, the velocity and position of their dth dimension can be calculated according to (7) and (8):
𝑣𝑖𝑑 = 𝑤 × 𝑣𝑖𝑑+ 𝑐1× 𝑟𝑎𝑛𝑑() × (𝑝𝑖𝑑− 𝑥𝑖𝑑) + 𝑐2× 𝑅𝑎𝑛𝑑() × (𝑝𝑔𝑑− 𝑥𝑖𝑑) (7)
𝑥𝑖𝑑= 𝑥𝑖𝑑+ 𝑣𝑖𝑑 (8)
Where w represents inertia weight, 𝑐1 and 𝑐2 are acceleration constants, and rand() and Rand() are two random values which vary from 0 to 1. In this paper, the number of dimensions of the particles is set as 10, respectively corresponding to the position weighting values of 10 segments. For example, the first dimension of the particle represents the position weighting value of the feature words in the first segment (that is 𝑝𝑜𝑠[0]), the second dimension of the particle represents the position weighting value of the feature words in the second segment (that is 𝑝𝑜𝑠[1]), and so on. 𝑐1 and 𝑐2 are set as 2, the number of particles are set as 30, and the number of algorithmic iterations is 30.
In this paper, the fitness function is set as the precision of text classification in order to find the better position weighting value of each feature word.
𝐹𝑖𝑡𝑛𝑒𝑠𝑠() =𝑇
𝑁 (8)
Where T is the number of documents which are correctly classified in testing set, and N is the number of all documents contained in testing set.
IV. EXPERIMENTS AND ANALYSIS
A. Experimental Environment
The environment of the experiment is Win7 64x 4GB Memory. And the text classification platform used in the experiment is based on the development of Java and environment of Eclipse, which integrates all the processes and common algorithms about text classification [17]. In this paper, Position-Bayes algorithm is compared with the Naive Bayes algorithm in the same experimental environment except for the classification algorithm by using control variate method.
B. Experimental Procedures
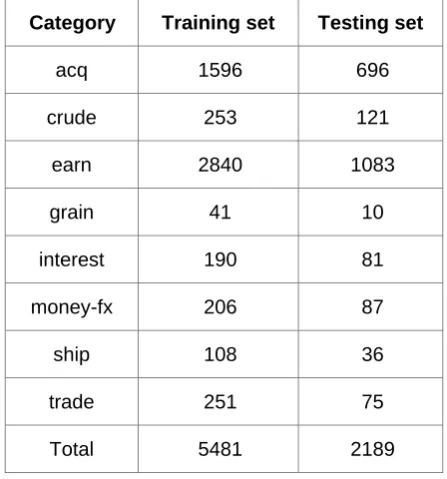
The corpus used in this paper is Reuters-21578 Corpus, and we select eight categories for text classification. They are acq, crude, earn, grain, interest, money-fx, ship and trade. The corpus is divided into testing set and training set according to the ratio of 1 to 2, and the detail distribution of the number of documents in each category is shown in Table I.
TABLE I. THE CATEGORIES DISTRIBUTION OF REUTERS-21578CORPUS
Category Training set Testing set
acq 1596 696
crude 253 121
earn 2840 1083
grain 41 10
interest 190 81
money-fx 206 87
ship 108 36
trade 251 75
Total 5481 2189
The experimental procedures are as follows.
Step 1: Word segmentation. The word segmentation module used in the experiment is ICTCLAS2013 developed by Chinese Academy of Sciences. The indexing module is Lucence.
Step 2: Feature selection. In this paper, chi-square test feature selection algorithm is used in the experiment. The number of dimensions are initialized as 100, and then the number of dimensions of each experiment is increased by 100 on the previous experiment until the precision drops.
Step 3: Feature weighting calculation. The method TF-IDF is used to calculate the feature weighting values in the experiment.
Step 4: Text classification. We use Position-Bayes algorithm and Naive Bayes algorithm respectively to classify the documents and calculate the classification precision.
C. Results and Analysis
Vol. 3 Issue 1, January - 2017
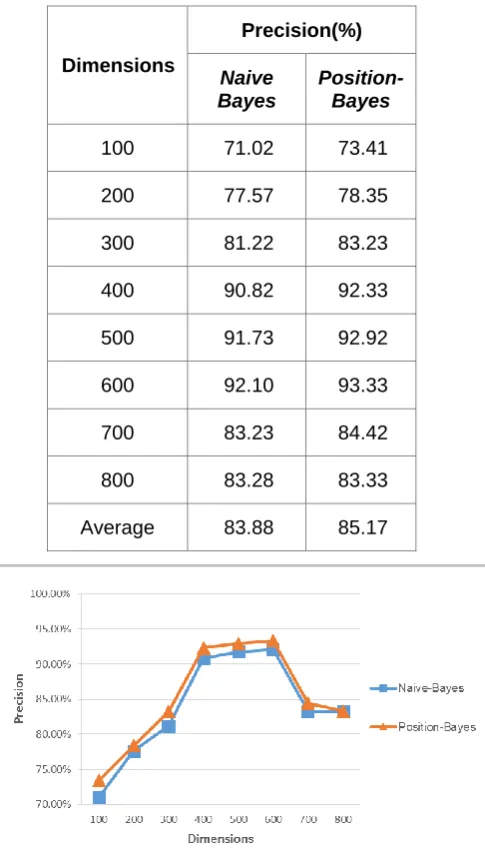
TABLE II. THE CLASSIFICATION PRECISIONS OF TWO ALGORITHMS IN
DIFFERENT DIMENSIONS
Dimensions
Precision(%)
Naive Bayes
Position-Bayes
100 71.02 73.41
200 77.57 78.35
300 81.22 83.23
400 90.82 92.33
500 91.73 92.92
600 92.10 93.33
700 83.23 84.42
800 83.28 83.33
Average 83.88 85.17
Fig. 1. The trend of classification precision with the increasing of dimensions
Fig. 2. The comparison of the precisions of Position-Bayes and Naive Bayes
Then we use paired sample t-test for the above results by SPSS in order to test whether it is statistically significant or not. The confidence level is set as 0.95 and the results are as follows.
TABLE III. PAIRED SAMPLE T-TEST RESULTS OF THE PRECISIONS OF
TWO ALGORITHMS
t df Sig.
(two-sided)
Native- Bayes —
Position-Bayes -5.167 7 0.001
According to the Table III, the value of Sig. is 0.001 which is less than 0.05, so the experimental results are statistically significant. Therefore, the classification precisions of Position-Bayes are significantly different from those of Naive Bayes, and the performance of Position-Bayes is better than that of Naive Bayes.
After the optimization of PSO, when the classification precision is the highest, the position weighting value of each segment are shown in Table IV and Table V. In order to make the data be a unified comparison, all the values are processed by the function (9).
𝑓(𝑥) = 𝑥/𝑚𝑎𝑥 (9)
Where 𝑥 is the position weighting value of each segment and 𝑚𝑎𝑥 is the maximum value among all the position weighting values in the same dimensions. Processed by the function, all the values are in the range of 0 to 1. The segment 1 represents the top 10% of the document, the segment 2 represents the top 10% to 20% of the document, and so on. In different dimensions, the position weighting values of the front and the latter segment are relatively stable. The position weighting values of the 1st and the 2nd segment are relatively bigger, the values of the 9th and the 10th segment are relatively smaller, and the fluctuation of the position weighting values of segment 3rd to segment 8th is relatively larger.
TABLE IV. THE POSITION WEIGHTING VALUES OF SEGMENT 1TO 5 IN
DIFFERENT DIMENSIONS Segments
Dimensions
1 2 3 4 5
100 1 1 1 0.804 0.462
200 0.985 1 0.322 0.466 0.536
300 1 1 0.659 1.00 0.447
400 1 0.849 0.553 0.504 0.872
500 1 1 0.46 0.582 0.718
600 1 1 0.632 0.779 0.837
700 1 1 0.459 0.663 0.321
800 1 1 1 1 1
TABLE V. THE POSITION WEIGHTING VALUES OF SEGMENT 6 TO 10 IN
DIFFERENT DIMENSIONS Segments
Dimensions
6 7 8 9 10
100 0.297 0.411 0.129 0.507 0.391 200 0.386 0.841 0.861 0.257 0.577 300 0.58 1.00 0.211 0.305 0.494 400 0.205 0.464 0.239 0.421 0.32 500 0.382 0.707 0.303 0.16 0.476 600 0.46 0.607 0.291 0.352 0.281 700 0.344 0.448 0.897 0.276 0.247
800 1 1 1 0.404 0.543
Average 0.48 0.68 0.49 0.34 0.42
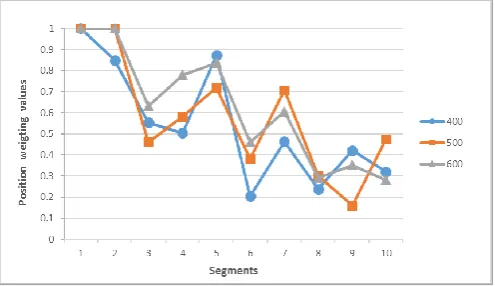
The classification precisions of 400, 500 and 600 dimensions are relatively higher and more stable, so we can observe further the position weighting values of 400, 500 and 600 dimensions, and the trends of the values are shown in Figure 3. Under the condition of 400, 500 and 600 dimensions, the fluctuation trends are similar and the position weighting values of the same segment are close to each other. As the position of segment becomes close to the end, the position weighting values become a downward trend. So, it can be concluded that the feature words in the top 20% of the document are more representative and contain more important information of the document, and they need to be assigned the higher weighting values.
Fig. 3. The trend of the position weighting values in the dimensions of 400, 500, and 600
V. CONCLUSIONS
Naive Bayes algorithm is a commonly used and has a good performance of text classification. In this paper, we propose a position-weighted Naive Bayes classification algorithm to reduce the impact of the "conditional independence" hypothesis of Naive Bayes algorithm, and use PSO algorithm to find the optimal position weighting values of each segment. According to the experimental results, it can be
concluded that compared with Naive Bayes algorithm, the improved Position-Bayesalgorithm can do better in text classification and improve the precision of text classification. What’s more, it can be deduced that the feature words in the top 20% of the document are more representative and contain more important information of the document, and they need to be assigned the higher weighting values, which can improve the precision of text classification.
ACKNOWLEDGMENT
This research is supported by National Natural Science Foundation of China (Grant No. 71373291), and Science and Technology Planning Project of Guangdong Province, China (Grant No. 2016B030303003).
REFERENCES
[1] Y. Yang, X. Liu. A re-examination of text categorization methods.International ACM SIGIR Conference on Research and Development in Information Retrieval. ACM, pp. 42-49, 1999.
[2] X. Shi, Y. Lin, Z. Chen. Mail Filtering Based on the Risk Minimization Bayes.Computer Science,vol. 29, no. 8, 50-51. 2002.
[3] M. M. Drugan, M. A. Wiering. Feature selection for bayesian network classifiers using the mdl-fs score.International Journal of Approximate Reasoning,vol. 51, no. 6, pp. 695-717, 2010.
[4] X. Zhou. Text classification model of uyghur based on improved bayes.Journal of Computational Information Systems,vol. 9, no. 11, 4319-4327, 2013.
[5] X. Li, C. Guo, K. Chen. Bayesian network consumer credit scoring models based on minimum overall risk rule. Application Research of Computers, vol. 26, no. 1, pp. 50-53, 2009.
[6] X. Wang. Study of Bayesian Network Classification Models and Its Application in Credit Scoring. Computer & Digital Engineering, vol. 38, no. 8, pp. 107-109, 2010.
[7] Y. Zeng, D. Feng, D. Fu. Face recognition algorithm of binary image by smallest risk Bayesian method. Computer Engineering and Design, vol. 32, no. 10, pp. 3511-3513, 2011.
[8] D. Wu, P. Chen. Bayesian minimum hazard control model of traffic accident. Journal of Traffic and Transportation Engineering, vol. 7, no. 6, pp. 266, 2007.
[9] Y. Zhang, J. Chen, Z. Xiong. Improved Naive Bayes Text Classification Algorithm. Journal of Guangxi Normal University : Natural Science Edition, vol. 25, no. 2, pp. 206-209, 2007.
Vol. 3 Issue 1, January - 2017 [11] N. Friedman, G. Dan, M. Goldszmidt.
Bayesian network classifiers.Machine Learning,vol.
29, no. 2, pp. 131-163, 1997.
[12] L. Bai, H. Huang, S. Liu, Q. Yan. Naive Bayes Classifier Based on Bootstrap Average. Computer Engineering, vol.33, no. 15, pp. 190-192, 2007.
[13] L. H. Lee, D. Isa, W. O. Choo, W. Y. Chue. High relevance keyword extraction facility for bayesian text classification on different domains of varying characteristic.Expert Systems with Applications, vol.39, no. 1, pp. 1147-1155, 2012.
[14] Y. Chen, A. Halidan, D. Yiliyaer, A. Yaliqin. Uyghur text classification based on weighted
improved Bayes. COMPUTER ENGINEERING AND DESIGN, vol. 35, no. 6, pp. 1999-2003, 2014.
[15] L. Jiang, Z. Cai, H. Zhang, D. Wang. Naive Bayes text classifiers: a locally weighted learning approach.Journal of Experimental & Theoretical Artificial Intelligence,vol. 25, no. 2, pp. 273-286, 2013.
[16] J. Liu, Y. Tan, J. Li, N. Yuan. Automatic Extraction Method of Chinese Text Theme Based on Multi-Factor. COM PUTER TECHNOLOGY AND DEVELOPMENT, vol. 20, no. 7, pp. 72-75, 2010.