Effect of Different Conditioning Methods on the Properties
of Hosiery Yarn and Knitted Fabric
Uzair Hussain, SameeIrshad, WardahAnam, HammadAbbasi, Faheem Ahmed, Abdul Jabbar
National Textile University, Yarn Manufacturing, Faisalabad, Punjab PAKISTAN
Correspondence to:
Uzair Hussain email: [email protected]
ABSTRACT
The research reports the results and investigations made on 20/1 cotton hosiery yarn and knitted fabric to evaluate the effect of different conditioning methods on the mechanical and comfort properties of yarn and fabric, namely, bursting strength, moisture management, thermal conductivity, air permeability, skewness, stiffness, and pilling. The fibers spun on a ring spinning system were investigated as yarn according to ASTM standards. From the results it is concluded that the knitted fabric made from machine conditioning has better mechanical and comfort properties than fabric made through unconditioned and room conditioned yarns.
Keywords: yarn conditioning, knitted fabric, hosiery yarn conditioning, knitted fabric properties
INTRODUCTION
The project focused on the effect of room conditioning and vacuum conditioning of cotton hosiery yarn and compared the mechanical and comfort properties of yarn and knitted fabric. Cotton is a soft, staple fiber that grows around the seeds of the cotton plant. Today it is the most used textile fiber in the world. Its current market share is 56 percent for all fibers used for apparel and home furnishings and sold in the U.S [1]. Another contribution is attributed to nonwoven textiles and personal care items. It is generally recognized that most consumers prefer cotton personal care items to those containing synthetic fibers. World textile fiber consumption in 1998 was approximately 45 million tons. Of this total, cotton represented approximately 20 million tons [2]. The global cotton production and consumption figures will continue to rise to a further 2.0 million tonnes by the end of the 2013-14 season in major cultivation countries. World cotton production in 2013-14 season is projected at 25.5 million tonnes and world cotton mill use is expected to remain around 23.5 million tonnes [3].The earliest evidence of using cotton is from India, and the date assigned to this fabric is 3000 B.C. There were also
in South America. Even though cotton fiber had been known already in South America, the large scale cotton cultivation in Northern America began in the 16th century with the arrival of colonists to southern parts of the United States. The largest rise in cotton production is connected with the invention of the saw-tooth cotton gin by Eli Whitneyin 1793[4].With this new technology, it was possible to produce more cotton fiber, which resulted in big changes in the spinning and weaving industry, especially in England.Cotton and viscose fibers are hygroscopic, that is, they have the ability to absorb moisture from the environment where they are kept [5]. Therefore, as the relative humidity of the environment increases, the amount of moisture absorbed by these fibers rises, which results in some changes in the physical properties of the yarns made of these fibers. On the other hand, moisture levels of yarns decrease due to modern machinery with high production speed. For example, cotton yarns contain 4-6 % moisture when they have been produced on a spinning machine [6]. The decreases in moisture levels of the yarns are likely to bring about some difficulties in the processing steps; also yarns with lower moisture content than the standard value result in monetary loss in sale. Therefore the moisture content of yarns must be increased to the standard levels so that their physical properties can be improved [7,8].
In the textile industry, applications such as conditioning, heat setting, relaxing, and shrinking are carried out in order to overcome these problems. The process carried out with the aim of increasing moisture content of the yarns is called conditioning. The conditioning process has been performed via
various methods, such as conditioning in
machines. Heat setting and relaxation are also vacuum steaming processes which are carried out at high temperatures, and they increase the resistance of high twist yarns, multiply yarns, and synthetic filament yarns to untwisting and snarling problems which occur at their unwinding from packages. Therefore, all these processes are called vacuum steaming, and in this study the effects of vacuum steaming on the properties of 100 % cotton yarns were been examined [9]. There are two different types of vacuum steaming carried out with saturated steam in a vacuum environment: direct and indirect. In the direct system, the steam obtained in a separate tank is directly placed into the steaming chamber. In the indirect system, there is only one steaming chamber and the steam is obtained by heating the water bath with heaters at the bottom of the chamber. The temperature of the environment can be adjusted to the desired level by means of electrical heaters. Only a few studies were performed about the effects of vacuum steaming on the mechanical properties of yarns. Since the wet tenacity value of cotton yarn is higher than its dry tenacity value, these limited numbers of studies are concerned with cotton yarn, except for one study performed with 67 % PES - 33 % viscose yarns [10]. We chose 100 % cotton yarns for this study.
MATERIALS AND METHODS
The properties of cotton used for the production of yarn are given in Table I.
TABLE I. Properties of Cotton Used.
Sr. No.
Parameters Units Values
1 Micronaire μg/inch 4.3
2 Strength g/tex 29.6
3 Length mm 27.7
4 Uniformity % 82.5
5 Short Fiber
Index(SFI)
% 21.4
6 Elongation % 5.1
7 Rd value - 70.1
8 +b value - 9.5
9 Trash content - 9.14
10 Neps per gram /gram 210
Hosiery yarn was produced on the ring spinning system. The machinery details along with model and manufacturing company name of the spinning system from blow room to winding department are given in
Table II. The chemicals and auxiliaries used for the scouring and bleaching of samples are given in Table III. Fabric processing equipment used is given in
Table IV. Testing of samples was carried out using the equipment given in Table V. After producing the yarn, different conditioning methods were applied. Properties of those yarns are given in Table VI.
Knitted fabric was produced on single jersey weft knitting machine. Courses per inch and wales per inch were also measured. The stitch length was also measured of each sample. Machine specifications used are shown in Table VII. Specifications of fabric produced are given in Table VIII. Fabric was scoured and bleached in a single bath. Processing recipe and conditions are given in the Table IX.
TABLE II. Yarn and Fabric Production Equipment.
Sr. No.
Machine Make
1. Blow room Truetzschler, Rieter (B-11, B-60)
2. CARD Crossroll
(MK4-Tendom), Truetzschler (TC-7)
3. Draw Frame Breaker: Toyoda (DX-8)
Finisher: Rieter (RSB D30)
4. Simplex Toyoda (FL 200)
5. Ring Frame Toyoda (RY 5)
6. Winding 21-C with Uster Quantum
7 Yarn Conditioning Xorella
8. AC Plant LUWA
9. Knitting Machine Fukuhara Japan
strength tester. The liquid moisture management properties were evaluated by AATCC TM 195-2009 using moisture management tester M-290 SDL Atlas, UK. Pilling of the fabric was measured by using an ICI Pilling Tester BS-5811.Air permeability of the fabric was measured according to ASTM D737 – 04 (2008). The stiffness of the fabric was measured according to ASTM D1388 – 08. The Skewness of the fabric was measured according to ASTM D 3882 – 99 (2006).Thermal conductivity of the samples was found using sweating guarded hotplate using standard test method for testing ISO 11092- 1993, ASTM F1868, and GB 11048. Moisture content of the yarn was measured by moisture meter DELMHORST.
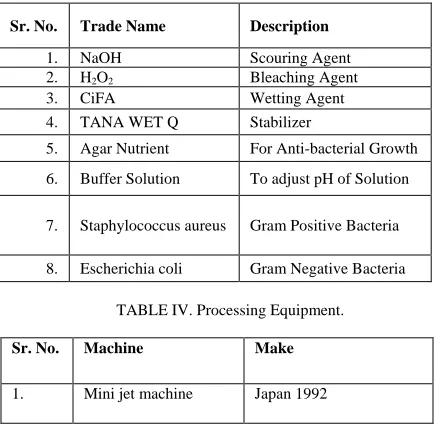
TABLE III. List of Chemicals/Auxiliaries.
TABLE IV. Processing Equipment.
Sr. No. Machine Make
1. Mini jet machine Japan 1992
TABLE V. Testing Equipment.
Sr. No. Equipment Purpose
1 Moisture Meter
Determination of Moisture of Fabric
2 Shirley Stiffness Tester
Determination of Stiffness of Fabric
3 Air Permeability Tester
Determination of Air Permeability of Fabric
4 Bursting Strength Tester
Determination of Bursting Strength of fabric
5
Moisture Management Tester
Determination of Moisture Management of the Fabric
6
Sweating Guarded Hot Plate
To Determine Thermal Conductivity of Fabric
7 ICI Pilling Tester BS-5811
Determination of Pilling of Fabric
8
As per (ASTM D3882 – 99)
Determination of Skewness of Fabric Measuring Stick,
Flat Surface, Fabric Inspection Table (Optional)
TABLE VI. Yarn Properties.
Sample
Yarn Properties
U% CVm IPI CLSP
Un Conditioned 11.8 3.39 180 2322 Room
Conditioned 12.55 3.17 278 2359 Machine
Conditioned 12.47 4.14 273 2367 Sr. No. Trade Name Description
1. NaOH Scouring Agent 2. H2O2 Bleaching Agent 3. CiFA Wetting Agent 4. TANA WET Q Stabilizer
5. Agar Nutrient For Anti-bacterial Growth
6. Buffer Solution To adjust pH of Solution
7. Staphylococcus aureus Gram Positive Bacteria
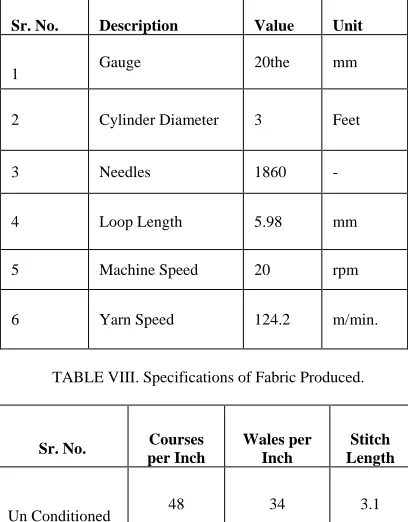
TABLE VII. Machine Specifications for Fabric Production.
Sr. No. Description Value Unit
1 Gauge 20the mm
2 Cylinder Diameter 3 Feet
3 Needles 1860 -
4 Loop Length 5.98 mm
5 Machine Speed 20 rpm
6 Yarn Speed 124.2 m/min.
TABLE VIII. Specifications of Fabric Produced.
Sr. No. Courses per Inch
Wales per Inch
Stitch Length
Un Conditioned 48 34 3.1
Room
Conditioned 50 32 3.02
Machine
Conditioned 50 36 3.2
TABLE IX. Processing Recipe and Conditions.
Sr. No. Description Value Unit
1 NaOH 5 g/l
2 Stabilizer 2 g/l
3 H2O2 8 g/l
4 Wetting Agent 1 g/l
5 Temperature 90-95 o C
6 Duration 1 Hr.
RESULTS AND DISCUSSION
CLSP of machine conditioned yarn is greater than the room conditioned and the unconditioned yarn, because of uniform moisture absorption during machine conditioning. The more the moisture mores, the greater will be the strength, hence more will be the CLSP value of the yarn. That is why the CLSP of room conditioned yarn is greater than the un conditioned yarn.
Uniformity percentage of fresh cone yarn is less than the room and machine conditioned yarn due to less moisture absorption in the fresh cone yarn. The more the moisture more will be the weight of the yarn; hence the more will be the U% of the yarn. In case of room conditioned yarn uneven moisture absorption occurs; hence more will be IPI values. In unconditioned yarn, the IPI values are comparatively less. The yarn test results are shown in Table VI.
Moisture content of room conditioned yarn is greater than the machine conditioned and the unconditioned yarn, because of uniform moisture absorption during machine conditioning at the outer surface of the cone absorbs more moisture and the inner surface absorb less moisture. The more the moisture absorption, the more will be the moisture content that is why the moisture content of room conditioned yarn is greater than the unconditioned yarn. The results are shown in
Figure 1.
FIGURE 1.Cone Moisture Content Test.
TABLE X. Air Permeability Test Results.
Serial # Un Conditioned
Room Conditioned
Machine Conditioned
1 197 157.6 197
2 177.3 177.3 197
3 187.15 187.15 177.3
Air Permeability
(mm/sec)
187.15 174.016 190.433
The test result comparisons are shown in Figure 2.
FIGURE 2. Air permeability test result comparisons.
Pilling of unconditioned fabric is greater than the room conditioned and the machine conditioned fabric, because of less moisture absorption in unconditioned fabric, which results in more hairiness. The more the moisture, the less will be the hairiness.
Hence the pilling of the fabric will be greater. In the ICI pilling scale, higher values indicate less pilling and lower values mean high pilling. The ICI Pilling Tester results are shown in Table XI.
TABLE XI. Pilling Test Results.
Sample Pilling Intensity
Un Conditioned 3 Moderate
Room 4 Slight
Machine 4 Slight
The graphical representation of the pilling test is shown in Figure 3.
FIGURE 3. Pilling Test Results.
Bursting strength of machine conditioned fabric is greater than the room conditioned and the unconditioned fabric, because of high strength due to uniform moisture absorption during machine conditioning. The more the moisture, the more will be the strength; hence the more will be the bursting strength of the fabric. That is why bursting strength of room conditioned fabric is greater than the unconditioned fabric. The results are shown in Table XII.
TABLE XII. Bursting Strength Results.
Sr. No. Un
Conditioned
Room Conditioned
Machine Conditioned
1 467 361 284
2 413 340 283
3 438 349 281
Bursting
Strength 439.33 350 282.667
(kPa)
The graphical representations of the results are shown in Figure 4.
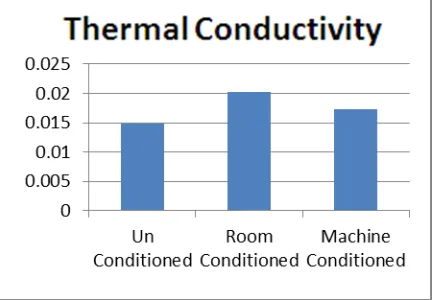
Thermal conductivity of room conditioned fabric is greater than the machine conditioned and the unconditioned fabric, because air permeability of room conditioned fabric decreases due to less porosity in the fabric. Whereas thermal conductivity of machine conditioned fabric is greater than the un conditioned fabric due to less porosity as compare to un conditioned fabric. The more the Rct(Thermal resistance) value, the more will be the insulation and the less will be the air permeability; hence the more will be thermal conductivity. Rct values of the samples are shown in Table XIII.
TABLE XIII. Rct Values of the Samples.
Sample Rct
Un Conditioned 0.01486
Room Conditioned 0.02031
Machine Conditioned 0.01733
Graphical representations of the Rct values of the samples are shown in Figure 5.
FIGURE 5. Thermal Conductivity Test Results.
Moisture Management Content of machine conditioned fabric is greater than the room conditioned and the unconditioned fabric due to the uniform structure of the knitted fabric and even moisture distribution. In machine conditioning due to high pressure and temperature the moisture is evenly penetrated in the cone and hence the swelling of the fibers is uniform. That is why the fabric made from machine conditioning yarns has uniform structure and moisture can easily move through it. Fabric made
through unconditioned yarn also has uniform structure, but as hairiness is more, so moisture can easily move through the fabric. That is why it has good moisture management content, but lower than fabric made through machine conditioned yarn. Fabric made through room conditioned yarn has low moisture management content value, because of uneven distribution of moisture during conditioning. The outer layer received more moisture; hence fibers swelled; but inside the cone the moisture cannot evenly penetrate, so the yarn swelling is not uniform. That is why the fabric structure is not uniform and moisture cannot move through it. Hence it has low moisture management content values as compared to unconditioned and machine conditioned fabric. The results are shown in Figure 6.
FIGURE 6. Moisture Management Test.
Machine conditioned fabric has low stiffness because of low snarling and twist setting due to even moisture distribution. In unconditioned fabric, the stiffness is more because of low moisture distribution. The results are shown in Table XIV.
TABLE XIV. Stiffness Test Results.
Sr. # Conditioned Un Conditioned Room Conditioned Machine
1 4.5 3.95 3.1
2 5.35 4.75 3.3
3 5.15 5.2 4.1
4 6.05 6.05 4.7
Stiffness 5.2625 4.9875 3.8
FIGURE 7. Stiffness Test Results.
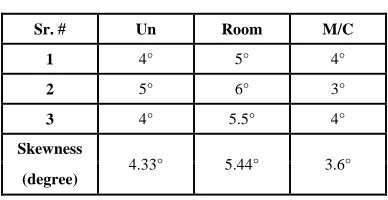
Skew is a fabric condition resulting when filling yarns or knitted courses are angularly displaced from a line perpendicular to the edge or side of the fabric.
Skewness of the machine conditioned fabric is less as compared to unconditioned and room conditioned fabric, because of twist setting in the machine conditioned fabric. In machine conditioning the moisture is evenly distributed, so the swelling of the fibers occurs uniformly and hence snarling decreases which results in less skewness. In room conditioning the outer layer of the cone received more moisture, but the inner part cannot get the same moisture, so uneven moisture distribution occurs which results in uneven yarn strength and hence uneven fabric structure, which causes the yarn more swelled at one place and less at another. When knitted fabric is made, the loop formation is not uniform because of non uniformity in the yarn. So due to the non uniform structure of the fabric the skewness is greater as twist setting occurs at some places but at most of the places snarling occurs. The Results are shown in
Table XV.
TABLE XV. Skewness Results.
Sr. # Un Room M/C
1 4° 5° 4°
2 5° 6° 3°
3 4° 5.5° 4°
Skewness
4.33° 5.44° 3.6° (degree)
The graphical representation of the results is shown in Figure 8.
FIGURE 8. Skewness Test Comparison.
CONCLUSION
• Room conditioned yarn will have higher
moisture content value due to more absorption of moisture on the cone surface.
• More uniform moisture absorption will have more uniformity in yarn shape; more will be the porosity of the fabric and hence more will be the value of Air Permeability. Uneven distribution of moisture lowers the value of AP (Air permeability).
• The more uniform the moisture is absorbed, the more will be the CLSP of the yarn. That is the reason unconditioned fabric has low bursting strength.
• Less moisture absorption results in more hairiness; hence the more will be the pilling of the fabric. Machine and Room conditioned fabric have almost the same effect for pilling.
• The rise in the value of Rct (Thermal resistance) results in increased insulation, which decreases the value of AP (air permeability) hence thermal conductivity increases. Machine conditioning increases the thermal resistance.
• Machine conditioning ensures the uniform shape of yarn and uniformity of the structure of knitted fabric; hence moisture management content of machine conditioned fabric is greater than the room conditioned and the unconditioned fabric.
• Even moisture distribution results in twist setting of the yarn, which reduces snarling effect. So machine conditioned fabric has low stiffness because of low snarling and twist setting.
REFERENCES
[1] Cotton for Nonwovens”: A Technical
Guide, Cotton Incorporated (Online)
Available
http://www.cottoninc.com/textile[Accessed 5 June 2013]
[2] Lawrence H. Shaw; “Cotton’s Importance in the Textile Industry", Symposium, Lima, Peru, May 12, 1998
[3] Razi Syed “Global cotton output, consumption figures continue to rise” October 2013,
(Online) Available: http://www.dailytimes.com.pk/default.asp?pa
ge=2013%5C10%5C20%5Cstory_20-10-2013_pg5_16 [Accessed 2 Nov 2013] [4] Kadolph, S.J., Langfold, A.J.: Textiles, 8th
edition, Prentice-Hall, 1998.
[5] Adanur S., 1995, “Wellington Sears Handbook of Industrial Textiles”, Technomic Publishing Co. Inc. Lancaster.-Basel., pp: 589.
[6] Özdemir O. and Dayık M., 2011, “Conditioning of Cotton Yarns and Studies Performed in This Field”, Textile Marathon, Vol: 4 (July-August), pp: 41-57.
[7] Özdemir Ö. and Şardağ, S., 2004, “Yarn Conditioning and New Methods”, Tekstil&Teknik, June, pp: 248- 260.
[8] Özdemir Ö. and Şardağ S., 2005, “Vacuum Steaming Processes Applied to Yarns, Its Application Fields and Improvements”, Journal of Engineering Sciences, Pamukkale University Engineering College, Vol.11, No. 2, pp: 239-248.
[9] Şardağ S., 2008, “A Study About Vacuum Steaming Processes of Yarns and Their Effects on Yarn Properties”, Doctorate Thesis, Uludağ University, Bursa,pp: 1, 95, 105-109, 158-160, 192-194.
[10] Şardağ S., Özdemir Ö. and Kara I., 2003, “The Effects of Heat Setting on The Properties of Polyester/ Viscose Blended Yarns”, Fibres& Textiles in EasternEurope, Vol. 15, No. 4 (63), pp: 50-53.
AUTHORS’ ADDRESSES Uzair Hussain
SameeIrshad WardahAnam HammadAbbasi Faheem Ahmed Abdul Jabbar