~ 364 ~ WWJMRD 2017; 3(12): 364-368
www.wwjmrd.com International Journal Peer Reviewed Journal Refereed Journal Indexed Journal UGC Approved Journal Impact Factor MJIF: 4.25 e-ISSN: 2454-6615
Shivam Srivastava School of Electrical
Engineering, VIT University, Tamil Nadu, India
G.K. Rajini School of Electrical
Engineering, VIT University, Tamil Nadu, India
Correspondence: Shivam Srivastava School of Electrical
Engineering, VIT University, Tamil Nadu, India
A Case Study: EEG Based BCI System for
Automation
Shivam Srivastava, G.K. Rajini
Abstract
Brain Computer Interface (BCI) system have shown a remarkable progress in recent years. The BCI has a vast potential in the field of medical science for enhancing the standard of living for the disabled people. Brain Computer Interface (BCI) is categorized as one of the communication network used to make an interface between human intellect and computer to control and function the external devices without having any physical contact of the body part. This offers the easy operations and also very helpful for elderly and specially-abled individuals. This is useful for persons who cannot run the peripheral devices using regular muscular body parts. The proposed system intends to control and actuate home appliances (like electric bulb, fan etc.) employing the use of Steady State Evoked Potentials (SSVEP) based BCI Systems. Subject is made to face a set of stimuli generated through MATLAB code on a Monitor where each stimulus is assigned a specific frequency responsible for actuating the electric bulb. Human concentration Level which can be categorized under non-invasive technique of brains signal measurement. This concentration is being measured by NeuroSky Headset. Concentration level values ranges from 1 to 100. Concentration means user's level of mental attention which occurs during strong meditation and focused (but stable) mental activity. So, to get concentration values subject should observe the object (or focus onto the object). For demonstration purpose here is used one electric bulb for its actuation and switching operation.
Keywords: SSVEP, Fast Fourier Transform, Electroencephalography
Introduction
During the past few years, EEG based BCI has been widely been investigated. This technology is being used as a medium for communication for people affected by severe cerebral palsy, head trauma, multiple sclerosis, amyotrophic lateral scleroses (ALS) [1]. Electroencephalography (EEG) is the electrophysiological monitoring technique to record electrical characteristics of human brain. It is typically a noninvasive [2], technique in which the brain signals are acquired through electrodes placed on the scalp.
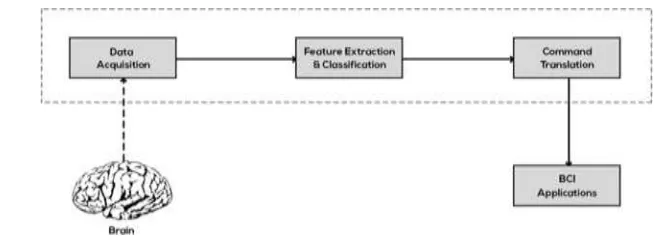
Fig. 1: Block Diagram of principle BCI based system
In particular, the approach based on EEG for DOA evaluation have been advanced rapidly. The EEG signals which imitate the brain’s activities have been widely used for research and diagnosis, especially for measuring the awareness level of patients [3]. The EEG signals are recorded as a feeble potential by placing the electrodes on the scalp and analyze to establish a
~ 365 ~
BCI system. The research is based on recording and analyzing EEG brain activity and identifying EEG patterns associated with mental states [4]. A BCI system is majorly divided into the data acquisition and feature detection and classification. The feature detection and classification are necessary to translate the signals into commands for various applications, here we are doing automation of room lights. This is described in figure – 1.
Various Electrophysiological activities have been studied in the past, e.g., steady-state visual evoked potentials (SSVEP), slow cortical potentials (SCP), and P300 evoked potentials and μ and β rhythms [5]. SSVEP are brain signals induced when the subject concentrates at a stimuli flickering at a certain frequency. Brain signals of the same frequency or its harmonics are generated. In a study by Herrmann [6], subjects presented with flickering lights from frequency 1 to 100 Hz were observed to develop resonance at frequencies 10, 20, 40 and 80Hz. The results resembled to those acquired during the study of cat visual cortex. This suggested that SSVEP’s were caused due to resonance occurring in the cortical. Steady State Visually Evoked Potentials (SSVEP) is the most commonly used due to various advantages.
The main advantages of SSVEP are (i) easy setup of the instruments, (ii) minimum training requirement for the subjects, and (iii) high information transfer rate (ITR) [7]. The creation of visual stimuli plays an important role in BCI. Here, we have attempted a pair of checkerboard flickering stimuli, flickering at two different frequencies responsible for different kind of actuation. The flickering frequencies selected are 7.5 Hz and 10 Hz as they are seen to evoke strong SSVEP [8]. The stimuli have been created using the conventional frame based method. The
data have been acquired and validated through Fast Fourier Transform (FFT) technique.
Methodology
Visual Stimuli generation
The Psychophysics toolbox (PTB) of MATLAB has been used to present the stimuli. This toolbox is open source, which has various functions to create stimuli for neuroscience research. The PTB displays images by the
process of double buffering. Double buffering is the process in which one buffer is used to display the content while in the other the content is being drawn. A call has to be made to switch the buffers when needed. Each time the buffers are swapped, it refers to one frame period. The refresh rate refers to the number of frames generated by a monitor per second. The frame period for a monitor having a refresh rate of 60 Hz is 16.67 ms. In this study, a monitor of 60 Hz refresh rate was used. We have used the conventional frame based stimulus design technique. We have selected the flickering frequency as 7.5Hz and 10 Hz. The shape of the stimuli used is square.
(𝑓, 𝑖) = 𝑠𝑞𝑢𝑎𝑟𝑒 [2𝜋𝑓 (𝑖)] R (1)
Where 𝑓 is the frequency, 𝑖 is the frame index and R is the refresh rate of the monitor [9].
In order to create a flicker of 7.5 Hz implies that the stimuli the frame should reverse every 4 frames. Hence, in 1/60th of a second, the stimulus sequence is – [ 1 1 1 1 0 0 0]. Here 1 is used to represent the black color and 0 is used to represent the white color. Similarly, based on this technique a 10 Hz frequency is also created.
Data Acquisition
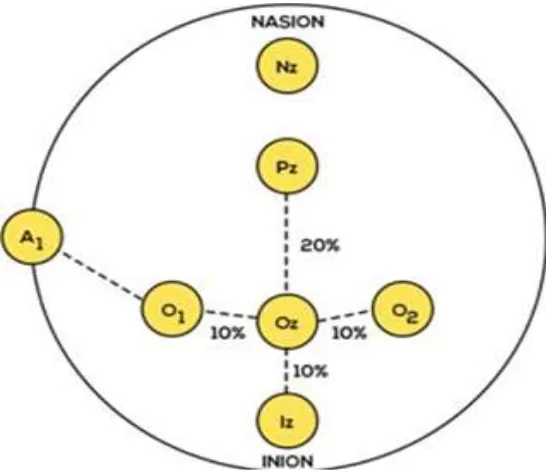
The electrode placement was carried out according to the international 10-20 electrode placement. TruScan 32 Data acquisition was used. Multichannel data acquisition has been performed. The sampling rate of the device is
256 Hz. Four Tin Electrodes were placed at sites 𝑂𝑧, 𝑂1,
𝑂2, 𝑃𝑧 as per the 10-20 system on the scalp of the user. The scalp was first cleaned with the Nuprep Skin Prep Gel. After this Ten20 conductive paste was used to stick the electrode on the scalp. It was taken care that the paste was not excess at it would lead to weak signal acquisition due to unwanted impedance. A micropore tape was used to secure the electrodes. All high power systems like air – conditioners were turned off during the time of acquisition to avoid electromagnetic interference.
~ 366 ~
Signal Analysis
Subject is made to face a monitor where a pair of flickering stimuli is displayed with two different flickering frequencies one at 7.5 Hz and the other at 10 Hz. Subject has to focus on only one stimuli at a time until the data acquisition is done. A MATLAB program was made to analyze the data. The data was then filtered using the
Butterworth filter available in the signal processing toolbox to remove high frequency noise. FFT of this data was carried out to check for the frequency peaks.
Each frequency peak is responsible for actuation of light bulb (one for switching it ON and the other to turn it OFF).
Fig. 3: System Flowchart
Figure- 3 shows generic block diagram of the proposed system. The subject has to face a screen where a pair of stimuli is generated through MATLAB one is 7.5 Hz and the other is 10 Hz. The
7.5 Hz is responsible for switching ON the electric bulb whereas the 10 Hz frequency is for turning it OFF. ARM7 controller is used as a robotic module
which receives commands from MATLAB and generates respective interrupt signals [10]. These interrupts signals provide command to the electric bulb and performs the operation required.
Results and Discussions
The FFT analysis was performed during the signal acquisition to ensure proper data acquisition.
Figure – 4 shows the FFT analysis for THE subject who was instructed to focus his attention on the flickering stimuli. It can be observed that the peak at 7.469 Hz (~ 7.5Hz) has amplitude which is very much greater than the amplitude at other frequencies. The presence of peaks at harmonics and sub harmonics is in good agreement with the previously conducted studies.
~ 367 ~
Simililarly, the FFT analysis for 10 Hz frequency is shown in figure-5. It can be observed that the peak at 9.969(~10 Hz) has an amplitude which is very much greater than the amplitude at other
frequencies. Again, the presence of harmonics and sub harmonics is in good agreement.
Fig.5: FFT analysis of subject for flickering stimuli showing peak at 9.969 Hz and at certain sub harmonics
Hence, as per observation and expectation the
7.5 Hz frequency is observed to switch ON the electric bulb by sending the appropiate operations from MATLAB code to the ARM7 controller and the 10 Hz frequency resulted in switching OFF the electric bulb.
Conclusion
Utilization of EEG signal are of significant information in the research field in order to help
specially abled people. Brain controlled appliances and its applications are a bit slow but a very reliable method for physically challenged person. The proposed system showed very high accuracy in terms of application to control the state of the electric bulb. However, the stability and accuracy is highly dependent on the subject’s state of mind while involved in the application as the complete system is based on the signals generated by the brain waves so in order to have a perfect operation the subject needs to have a
proper training before the actual operation. Basically, a BCI that uses brain signal elicited due to mental task (e.g. imagination and problem solving) require subject to undergo training [11].
Acknowledgement
We are very thankful to our Vellore Institute of Technology University for providing the enhanced facility and resources in order to work for this project and complete it successfully.
References
1. Lee, PL, Wu, CH, Hsieh, JC, & Wu, YT (2005). Visual evoked potential actuated brain computer interface: a brain-actuated cursor system. Electronics letters, 41 (15), 832-834.
~ 368 ~
3. Quan Liu, 1 Yi-Feng Chen,2 Shou-Zen Fan,3 Maysam F. Abbod,4 and Jiann-Shing Shieh5. EEG Signals Analysis Using Multiscale Entropy for Depth of Anesthesia Monitoring during Surgery through Artificial Neural Networks. Hindawi Publishing
Corporation Computational and Mathematical
Methods in Medicine.
4. Saadat Nasehi, 2 Hossein Pourghassem. An Optimal EEG-based Emotion Recognition Algorithm Using Gabor Features. Wseas Transactions On Signal Processing
5. Zhu, D., Bieger, J., Molina, GG, & Aarts, RM (2010). A survey of stimulation methods used in SSVEP-based BCIs Computational intelligence and neuroscience, 2010.
6. Christoph S. Herrmann (2001). Human EEG responses to 1–100 Hz flicker: resonance phenomena in visual cortex and their potential correlation to cognitive phenomena. Exp Brain Res, 137:346–353. DOI 10.1007/s002210100682
7. Yijun Wang, Xiaorong Gao, Bo Hong ,Chuan Jia, Shangkai Gao(2008) Brain Computer Interfaces Based on Visual Evoked Potentials.IEEE Engineering in Medicine and Biology Magazine:64
71.doi:10.1109/MEMB.2008.923958
8. Yangsong Zhang, Peng Xu*, Tiejun Liu, Jun Hu, Rui Zhang, Dezhong Yao Multiple Frequencies Sequential
Coding for SSVEP-Based Brain- Computer
Interface,plosone journal.
9. Wang, Y., & Jung, T. P. (2010). Visual stimulus design for high-rate SSVEP BCI. Electronics letters, 46(15), 1057-1058.
10. Nikhil R. Folane R. M. Autee, EEG Based Brain Controlled Wheelchair for Physically Challenged People. International Journal of Innovative Research in Computer and Communication Engineering.
11. Muhammad Shaufil Adha, Norlaili Mat Safri and Mohd Afzan Othman. Real-Time Target Selection
Based On Electroencephalogram (EEG) Signal.