Pattern Recognition Based Discrimination
of Ethanol Concentration Using ZnO
Thick-Film Gas Sensor for the Detection
and Warning of Drunken Driving
AMBARISH G. MOHAPATRA
Silicon Institute of Technology, Silicon Hills, Patia, Bhubaneswar,
Orissa – India
Email: [email protected]
BIRANCHI N. RATH
Silicon Institute of Technology, Silicon Hills, Patia, Bhubaneswar,
Orissa – India
Email: [email protected]
ABSTRACT—
DUI (Driving under the influence) is a synonymous term that represents the criminal offense of operating a motor vehicle while being under the influence of alcohol. Semiconductor oxides such as SnO2, TiO2, and ZnO have been more successfully employed as sensing materials compare to organic semiconductors for the detection of ethanol gas concentration. This work investigates the fabrication and characterization of the thick-film gas sensor based on Zinc Oxide on an Alumina substrate. The sensor exhibits excellent ethanol sensing characteristics at temperatures between 175 °C to 300 °C and the characteristics of the sensor for different concentration of the ethanol gas has been successfully studied using Principal Component Analysis (PCA), Linear Discriminant Analysis (LDA), Fuzzy C-Mean algorithms. This system can be used to detect alcoholic driving for automotive safety applications. The system is designed to detect the exact concentration of ethanol gas using virtual instrumentation software and data acquisition hardware. This work presents the data analysis results of 230 samples of each concentration levels of ethanol gas using PCA, LDA and Fuzzy C-Mean algorithms. The overall system can be tested with the engine ignition system for automotive safety and warning applications in the prevention of a crash during drunken driving.
Keywords-Principal Component Analysis (PCA); Linear Discriminant Analysis (LDA); Fuzzy C-Mea; Engine ignition System; Zinc Oxide Thick film sensor; Driving under the influence (DUI); Virtual Instrumentation.
I. INTRODUCTION
Driving under the influence (DUI) (drinking and driving, and drink-driving) is the act of operating any motorized machinery after or during the consumption of alcohol or other drugs. DUI is synonymous term that represents the criminal offense of operating a motor vehicle while being under the influence of alcohol or drugs or a combination of both. It is a criminal offense in most countries. This system will detect and display ethanol concentration in the LabView front panel. The sensor is a thick film based zinc oxide gas sensor. The sensor is having an inner heating coil which is heated up to a temperature range of 75°C to 300°C. The use of resistive, adsorption-based sensors has been increasing over the past few years for the purposes such as detection of smoke, oxidizing or reducing gases (O2, CO, Ethanol, CH4, CO2, etc) and humidity [1]. A large number of
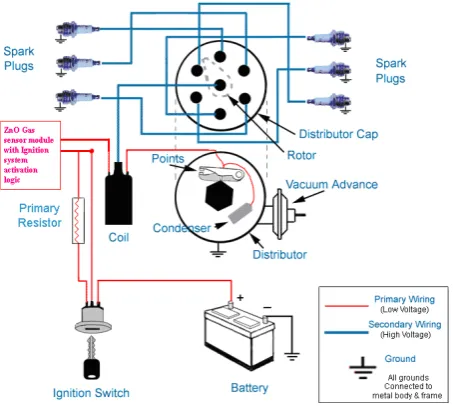
Analysis (LDA) and Fuzzy C-Mean algorithm. This sensor can easily be implemented as an engine ignition system during drunken driving [Figure 1].
Figure 1: Zinc Oxide Gas Sensor used for detection and warning of DUI and engine ignition system.
A. Principal Component Analysis (PCA)
PCA is a useful mathematical tool of reorganizing the information in a dataset and is a common technique for finding patterns in data of high dimension. It has been widely used in modeling the statistics of multi-dimensional datasets. PCA data may be expressed and presented in such a way as to highlight their similarities and dissimilarities. It is a simple, non-parametric method for extracting relevant information from confusing data sets. In the vector space, PCA identifies the major directions and the corresponding strengths of variation in the data. It achieves this by computing the eigen-vectors and eigen-values of the covariance matrix of the dataset which discover new variable in the data called “Principal Component”, keeping only a few eigen-vectors corresponding to the largest eigen-values. PCA can be also used as a tool to reduce the dimensions of the dataset while retaining the major variation of the data.
B. Linear Discriminant Analysis (LDA)
Linear Discriminant Analysis (LDA) is a well-known method for dimensionality reduction and classification that projects high-dimensional data onto a low dimensional space where the data achieves maximum class separability. More formally it gives independent features relative to which the data is derived. The derived features in LDA are linear combinations of the original features, where the coefficients are from the transformation matrix. The optimal transformation in classical LDA is obtained by minimizing the within-class distance and maximizing the between-class distance simultaneously, thus achieving maximum class discrimination. The optimal transformation is readily computed by solving generalized Eigen value problem.
C. Fuzzy C-means (FCM)
Clustering and partitioning algorithm of fuzzy data can be done by another clustering technique i.e. Fuzzy C- means. The basic idea of fuzzy clustering is to divide the data into fuzzy partitions that data are overlapped with another. The FCM is based on fuzzy partitioning such that a data point can belong to all groups with different membership value between 0 and 1. It is an iterative algorithm and the aim is to find clusters centers which are based on minimization of the following objective function:
N i C j j i m ijm
x
c
J
1 1
2
,
1
m
Where m is any real number greater than 1 which is a weighting coefficient denoting the fuzziness of the cluster.
ijis the degree of membership of xi in the cluster j,xi is the ith of d-dimensional measured data, cj is the d
-dimension center of the cluster, and
x
i
c
j denotes the Euclidian distance between xi and cj.II. ZnO SENSOR PREPARATION
ZnO has been traditionally employed as a gas sensor by making use of change in resistivity on exposure to the relevant gas. We employed ZnO thick-films prepared on an alumina substrate for sensing ethanol. The substrate was an alumina tube about 2cm long. Electrodes were wound over it using nichrome wires. Thick film preparation method was very simple and inexpensive. First, the commercial ZnO powder was reduced to a very fine powder by constant grinding for about an hour. A paste of it was then prepared by simply adding few drops of distilled water. Finally the thick film was made by applying the paste of the grinded commercial ZnO powder over an alumina tube (substrate) containing the electrodes using a fine paint brush. Care was taken to apply a smooth coating such that no air gaps or cracks were present between the coating and the electrodes. The sample was then dried in the air for 24 hours and finally annealed at 300°C for 2 hours. The coating that we got was very smooth and had good adherence with the alumina tube after annealing. Finally a coiled nichrome wire was inserted through the tube to act as a heater. The complete structure of the thick film over the alumina substrate is shown in the Figure 1.
Figure 2: Zinc Oxide Gas Sensor with heating coil arrangement
III. EXPERIMENTAL PROCEDURE
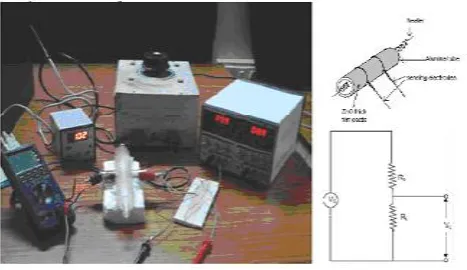
In the system we have used a Zinc Oxide based thick-film sensor with its arrangement, Internal Heating Coil, Data Acquisition hardware and software, Digital temperature recorder, Power supply Unit, Power source for heating coil. Gas sensing characteristics of ZnO thick-film sensor were measured with a testing glass chamber, sensor holder, RTD, heating coil arrangement, temperature controller, National Instruments data acquisition software and hardware module, digital temperature detector, required circuitry. The sensor was tested for ethanol vapor in the temperature range of 75°C to 300°C range. 100 p.p.m. of ethanol was injected by micropipette into the testing chamber. The working temperature of the sensor was adjusted by changing the voltage across the heater side. The working circuit shown in the Figure-3 is used to monitor the output voltage across the load resistor, corresponding voltage across the sensor and the resistance of the gas sensor in dry air as well as in test gas to measure the concentration level.
Figure 3: Experimental setup and circuit for ZnO thick-film gas sensor measurement
Figure 4: Experimental setup with heating coil at 250°C
Figure 5: Glass chamber with inlet, outlet and emergency valve at the top
IV. RESULTS AND DISCUSSIONS
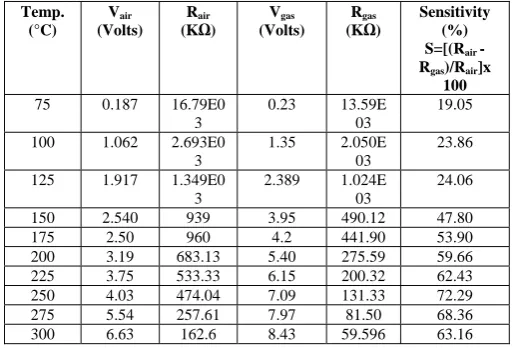
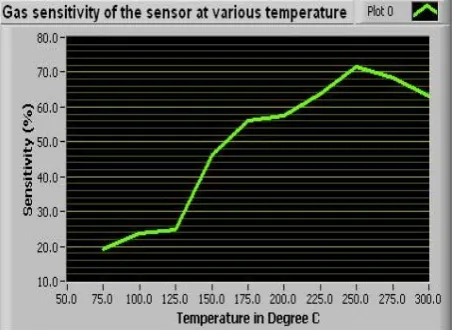
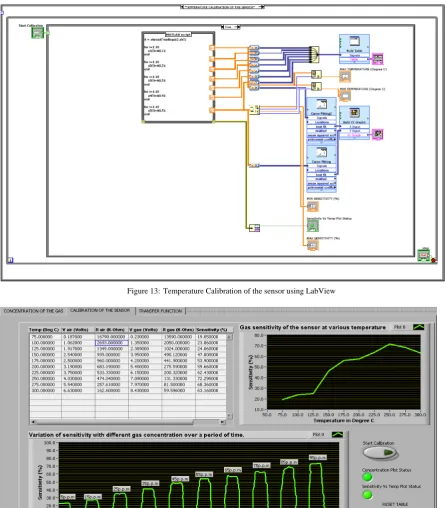
From Table-I. Vair and Vgas are the voltage obtained across the load resistor RL. The gas sensitivity, S, was determined as (Rair – Rgas)/Rair .Where Rair is the resistance of the gas sensor in the dry air while Rgas is that of the sensor in the test gas. The sensor resistance can be found out from the simple formula: RS (sensor in air or gas) = RL*(VS- VL)/ VL, where VS is the source voltage (here 10 volts) and VL is the load voltage which we are measuring directly as Vair and Vgas. As soon as ethanol gas was introduced into the sensing chamber, the electrical resistance (Rgas) of the thick film sensor started to decrease as compared to what was in dry air (Rair). It is clear that the resistance of the sensor was in the 160 KΩ to 17 MΩ range in the dry air and was in the 60 KΩ to 15 MΩ range for ethanol at 75-300°C. The sensor responses can also be affected by the slight change of temperature. In Figure 8, we have shown the sensitivity measured at different temperatures. It should be noticed that at 250°C the sensor shows highest sensitivity which is around 75%.Above this temperature the sensitivity starts decreasing.
TABLE I. SENSITIVITY OF THE GAS SENSOR AT DIFFERENT TEMPERATURE RANGES AT 100P.P.M CONCENTRATION
Temp. (°C)
Vair
(Volts) Rair
(KΩ) (Volts) Vgas Rgas
(KΩ) Sensitivity (%) S=[(Rair
-Rgas)/Rair]x
100
75 0.187 16.79E0
3
0.23 13.59E 03
19.05
100 1.062 2.693E0
3
1.35 2.050E 03
23.86
125 1.917 1.349E0
3
2.389 1.024E 03
24.06
150 2.540 939 3.95 490.12 47.80 175 2.50 960 4.2 441.90 53.90
200 3.19 683.13 5.40 275.59 59.66
225 3.75 533.33 6.15 200.32 62.43
250 4.03 474.04 7.09 131.33 72.29
275 5.54 257.61 7.97 81.50 68.36
increased. The response time for the sensor was also calculated. The rise time defined as the time required for the conductance to reach 90% of the equilibrium value after the gas is injected. The fall time is the time needed by the sensor to acquire 10% of the above the original value in air after the gas is removed.
Figure 6: Calibration of Ethanol Gas sensor and sensitivity curve at different concentration levels
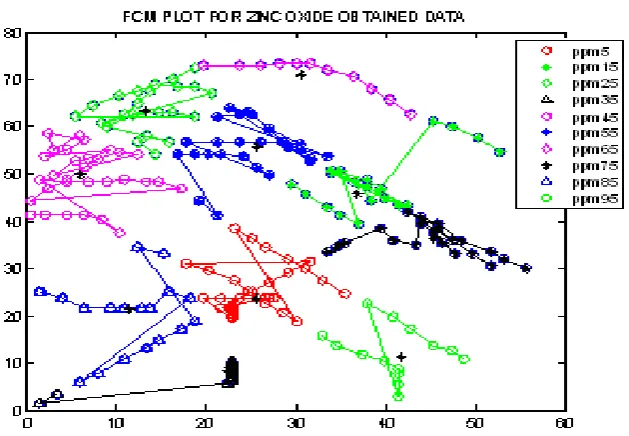
In Figure 6, we display the variation in voltage of the sensor at the different concentration ranging from 5 to 95 p.p.m at 250°C. The sensor data has been analyzed using Principal Component Analysis (PCA), Linear Discriminant Analysis (LDA), Fuzzy C-Mean algorithms on different p.p.m label of ethanol concentrations. The plots clearly points out the existence of distinct clusters of the gas sensor patterns with respect to the ideal concentration data. Principle component analysis has been widely used in modeling the statistics of a set of multi-dimensional data [8]. By using these techniques the sensor data may be expressed and presented in such a way as to highlight their similarities and differences. It can be noted from the PCA [Figure-8], LDA [Figure-9], Fuzzy C-Mean [Figure-10] plots that the formations of clusters for samples belonging to a particular concentration are more distinct with normalized than data without normalization. The rise time of the gas sensor was measured [Figure-6] to be about 30 sec while the fall or recovery time of the sensor was observed to be 10 sec. From the sensitivity curve [Figure-7] the temperature for maximum sensitivity is found out (T=250°C).
-40 -30 -20 -10 0 10 20 30 40 -0.2 -0.15 -0.1 -0.05 0 0.05 0.1 0.15 0.2 PCA1=99.7603% P C A 2 = 0 .2 396 %
PCA PLOT FOR ZINC OXIDE OBTAINED DATA
ppm5 ppm15 ppm25 ppm35 ppm45 ppm55 ppm65 ppm75 ppm85 ppm95
Figure 8: PCA plot for different concentrations 5 to 95 p.p.m
0 10 20 30 40 50 60 70 80
-40 -30 -20 -10 0 10 20 30
LDA PLOT FOR ZINC OXIDE OBTAINED DATA ppm5 ppm15 ppm25 ppm35 ppm45 ppm55 ppm65 ppm75 ppm85 ppm95
Figure 9: LDA plot for different concentrations 5 to 95 p.p.m
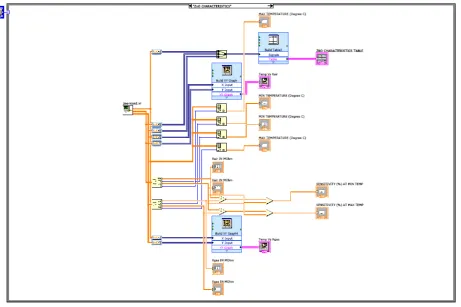
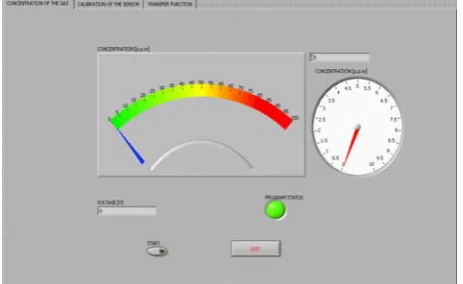
concentration. Data acquisition hardware and software are used for signal processing of the sensor data. The gas concentration [Figure-15] and temperature characteristics [Figure-14] were calculated using National Instruments Data acquisition software (LabView).
Figure 11:ZnO Characteristics study using LabView
Figure 13:Temperature Calibration of the sensor using LabView
Figure 15:Concentration of Ethanol Gas and output voltage from the sensor
The overall system contains a Zinc-Oxide thick-film sensor and engine ignition logic for enable and disable of engine at drunken conditions. The device controls the operation of a vehicle as follows:
When the key is turned a voice prompts the driver to prepare to give a breath test.
The driver has over 50 seconds to provide a deep lung breath sample.
The breath sample is analyzed in 15 - 30 seconds. Allows 6-8 second resample as needed.
After test completion, a voice either prompts the driver to start the car or lets him/her know it will not start (a lockout condition).
If a retest is failed, a voice instructs the driver to pull over and shut off the car.
If this instruction is ignored, the horn sounds and the lights blink until the car is shut off.
VI. CONCLUSION
Zinc Oxide thick-films sensor fabricated was used to monitor gas concentrations with fast response time and excellent sensitivity. The sensor exhibits excellent ethanol sensing characteristics with highest sensitivity at the temperatures of 250 °C. Also sensitivity for the different concentration of the gas over a period of time was observed and the rise and the fall time for sensing were measured to be 30 and 10 seconds respectively using data acquisition technique. The overall system can monitor different gases like carbon dioxide, carbon monoxide and other toxic gases. Appearance-based methods are widely used in pattern recognition systems. Within this paradigm, PCA, LDA and FCM are some of the classification techniques have been demonstrated and found drastic result for the detection of ethyl alcohol concentration at different p.p.m label by using zinc oxide gas sensor which has been tested for the detection and warning of DUI.
ACKNOWLEDGEMENT
The authors thank Dr. R. N. Pal, Silicon Institute of Technology, Orissa-India and his team for their assistance with tests and their system development insights. We also thank Proff. A.K. Tripathy, Silicon Institute of Technology, Orissa for his assistance in the research work in the laboratory.
REFERENCES
[1]. Liewhiran, C., Camenzind, A., Teleki, A., Pratsinis, S.E., Phanichphant S, High Performance Ethanol Sensor for Control Drunken
Driving Based on Flame-made ZnO Nanoparticles , 2nd IEEE International Conference on Nano/Micro Engineered and Molecular Systems, 2007 (NEMS '07).
[2]. Liewhiran, C., Phanichphant, S.,Fabrication of various thickness of flame-made nano zinc oxide thick film and its response to ethanol,
2nd IEEE International conference on Nanoelectronics, 2008. INEC 2008.
[3]. Lei Chen, Shuang Yang, Ying Xi, Based on ZigBee wireless sensor network the monitoring system design for chemical production
process toxic and harmful gas, International Conference on Computer, Mechatronics, Control and Electronic Engineering (CMCE), 2010.
[4]. Zhao Zikai; Hui Guohua; An Electronic Nose System Based on an Array of Carbon Nanotubes Gas Sensors with Pattern Recognition
Techniques, 4th International Conference on Bioinformatics and Biomedical Engineering (iCBBE), 2010.
[5]. Seong Kyun Oh; Young Tae Byun; Seok Lee; Hyung Seok Kim; Multi-sensor system for air quality monitoring in building and
surroundings, IEEE International Conference on Information and Communication Technology Convergence (IEEE ICTC-2010). Lotus, A. F.; Kang, Y. C.; Ramsier, R. D.; Chase, G. G.; Investigation of the physical and electronic properties of indium doped zinc oxide nanofibers synthesized by electrospinning, Journal of Vacuum Science & Technology B: Microelectronics and Nanometer-Structures.
[6]. Bhattacharyya, N., Bandyopadhyay, R., Bhuyan, M., Tudu, B., Ghosh, D., and Jana, A., 2008, “Electronic nose for black tea
classification and correlation of measurements with "Tea Taster" marks,” IEEE Trans. Instrum. Meas., 57(7), pp. 1313-1321.
[7]. Hongsith, N.; Choopun, S.; “Enhancement of Ethanol Sensing Properties by Impregnating Platinum on Surface of ZnO Tetrapods”,
Sensors Journal, IEEE Volume: 10 , Issue: 1
[8]. Santhaveesuk, T.; Wongratanaphisan, D.; Choopun, S.; “Enhancement of Ethanol Sensing Properties by Alloying With ZnO
[9]. Liewhiran, C.; Camenzind, A.; Teleki, A.; Pratsinis, S.E.; Phanichphant, S.; “High Performance Ethanol Sensor for Control Drunken Driving Based on Flame-made ZnO Nanoparticles”, 2nd IEEE International Conference on Nano/Micro Engineered and Molecular Systems, 2007. NEMS'07.
[10].Hamada, Y.; Watanabe, K.; Kobayashi, K.; Kurihara, Y.; “Development of contact-type alcohol checking system”,
Proceedings of SICE Annual Conference 2010.
[11].Ramanath, T.S.; Sudharsan, A.; Udhayaraj, U.F.; “Drunken driving and rash driving prevention system”, 2nd International Conference