Growth and Development in Preterm Infants Fed Long-Chain
Polyunsaturated Fatty Acids: A Prospective, Randomized Controlled Trial
Deborah L. O’Connor, PhD*; Robert Hall, MD‡; David Adamkin§, MD; Nancy Auestad, PhD*;
Marcella Castillo, PhD
储
; William E Connor, MD¶; Sonja L. Connor, MS, RD¶; Kathleen Fitzgerald, PhD‡;
Sharon Groh-Wargo, MS, RD#; E. Eugenie Hartmann, PhD**; Joan Jacobs, MA*; Jeri Janowsky, PhD¶;
Alan Lucas, MD‡‡; Dean Margeson, MAS*; Patricia Mena, MD
储
; Martha Neuringer, PhD¶;
Mirjana Nesin, MD§§; Lynn Singer, PhD
储储
; Terence Stephenson, MD¶¶; Joanne Szabo, MD##;
Vance Zemon, PhD*** on behalf of the Ross Preterm Lipid Study
aABSTRACT. Objectives. A randomized, masked,
con-trolled trial was conducted to assess effects of supple-menting premature infant formulas with oils containing the long-chain polyunsaturated fatty acids, arachidonic acid (AA; 20:4n6), and docosahexaenoic acid (DHA; 22: 6n3) on growth, visual acuity, and multiple indices of development.
Methods. Infants (Nⴝ470) with birth weights 750 to 1800 g were assigned within 72 hours of the first enteral feeding to 1 of 3 formula groups with or without long-chain polyunsaturated fatty acids: 1) control (Nⴝ144), 2)
AAⴙDHA from fish/fungal oil (N ⴝ 140), and 3)
AAⴙDHA from egg-derived triglyceride (egg-TG)/fish oil (Nⴝ143). Infants were fed human milk and/or Simi-lac Special Care with or without 0.42% AA and 0.26% DHA to term corrected age (CA), then fed human milk or NeoSure with or without 0.42% AA and 0.16% DHA to 12 months’ CA. Infants fed exclusively human milk to term CA (EHM-T;Nⴝ43) served as a reference.
Results. Visual acuity measured by acuity cards at 2, 4, and 6 months’ CA was not different among groups. Visual acuity measured by swept-parameter visual-evoked potentials in a subgroup from 3 sites (45 control, 50 AAⴙDHA [fish/fungal]; 39 AAⴙDHA [egg-TG/fish]; and 23 EHM-T) was better in both the AAⴙDHA (fish/
fungal; least square [LS] means [cycle/degree]ⴞstandard error [SE; octaves] 11.4 ⴞ 0.1) and AAⴙDHA (egg-TG/ fish; 12.5ⴞ0.1) than control (8.4ⴞ0.1) and closer to that of the EHM-T group (16.0ⴞ0.2) at 6 months’ CA. Visual acuity improved from 4 to 6 months’ CA in all but the control group. Scores on the Fagan test of novelty
pref-erence were greater in AAⴙDHA (egg-TG/fish; LS
means ⴞ SE, 59.4 ⴞ 7.7) than AAⴙDHA (fish/fungal; 57.0ⴞ7.5) and control (57.5ⴞ7.4) at 6 months’ CA, but not at 9 months’ CA. There were no differences in the Bayley Mental Development Index at 12 months’ CA. However, the Bayley motor development index was higher for AAⴙDHA (fish/fungal; LS meansⴞSE, 90.6ⴞ 4.4) than control (81.8ⴞ4.3) for infants<1250 g. When Spanish-speaking infants and twins were excluded from the analyses, the MacArthur Communicative Develop-ment Inventory revealed that control infants (LS meansⴞSE, 94.1ⴞ 2.9) had lower vocabulary compre-hension at 14 months’ CA than AAⴙDHA (fish/fungal) infants (100.6ⴞ 2.9) or AAⴙDHA (egg-TG/fish) infants (102.2 ⴞ 2.8). There were no consistent differences in weight, length, head circumference, or anthropometric gains.
Conclusion. These results showed a benefit of sup-plementing formulas for premature infants with AA and DHA from either a fish/fungal or an egg-TG/fish source from the time of first enteral feeding to 12 months’ CA.
Pediatrics 2001;108:359 –371; premature infants, docosa-hexaenoic acid, arachidonic acid, long-chain polyunsatu-rated fatty acids, infant formulas.
ABBREVIATIONS. AA, arachidonic acid; DHA, docosahexaenoic acid; SD, standard deviation; CA, corrected age; EPA, eicosapen-taenoic acid; egg-TG, egg-derived triglyceride; SSC, Similac Special Care; SDAY 1, study day 1; EHM-T, exclusively human milk-fed to term CA; PC, phosphatidylcholine; PE, phospha-tidylethanolamine; RBC, red blood cells; NEC, necrotizing entero-colitis; SAE, serious and/or unexpected adverse event; VEP, visual evoked potential; EEG, electroencephalogram; S:N, signal to noise ratio; ANCOVA, analysis of covariance; LS means, least square means; SE, standard error.
W
hether or not formulas designed for the
premature infant should be supplemented
with long-chain polyunsaturated fatty
ac-ids, including arachidonic acid (AA; 20:4n-6) and
docosahexaenoic acid (DHA; 22:6n-3) has become
one of the most controversial issues in infant
nutri-tion today. Several lines of logic suggest that
prema-From the *Ross Products Division, Abbott Labs, Columbus, Ohio; ‡Chil-dren’s Mercy Hospital, Kansas City, Missouri; §University of Louisville and Kosair Children’s Hospital, Louisville, Kentucky;储INTA Univ de Chile, Santiago, Chile; ¶Oregon Health Sciences Univ, Portland, Oregon; #Metro-Health Medical Center, Cleveland, Ohio; **Hunter College, New York, New York; ‡‡Institute of Child Health, London, United Kingdom; §§Weill Med-ical College, Cornell University, New York, New York;储储Rainbow Babies & Children’s Hospital, Cleveland, Ohio; ¶¶University of Nottingham, Not-tingham, United Kingdom; ##Arkansas Children’s Hosp, Little Rock, Ar-kansas; and ***Yeshiva Univ, Bronx, New York.
aThe Ross Preterm Lipid Study group also included: R Carroll and B Meyer
(The Children’s Mercy Hospital); P Radmacher and S Rafail (Kosair Chil-dren’s Hospital); A Blanco Gomez (INTA Univ de Chile); P Fisher and S Escoe (Oregon Health Sciences Univ); R Arendt and M Davillier (Metro-Health Med Ctr and Rainbow Babies and Children’s Hosp); K Kennedy (Institute of Child Health); J Putis (Leeds General Infirmary); S Newell (St James’ Hospital, Leeds); S Carlisle (Arkansas Children’s Hospital); C Broestl, C Downs, Q Liang, P Pollack, W Qiu, and D Smart (Ross Products Division); J Deeks, S Sullivan, R Tressler (Abbott Labs); S Buckley (Yeshiva University); and J Gordon and L Garcia-Quispe (Hunter College); D Pin-chasik (Weill Medical College).
Received for publication Jun 2, 2000; accepted Feb 9, 2001.
Reprint requests to (D.L.O.) Hospital for Sick Children, 555 University Ave, Toronto, Ontario, Canada, M5G 1X8. E-mail: deborah㛭l.o’connor@ sickkids.on.ca
ture infants fed formulas without AA and DHA may
be at increased risk of slower development related to
suboptimal blood and tissue levels of these fatty
acids compared with the term infant. First, DHA
accumulates in the brain and retina most rapidly
during the last intrauterine trimester and during the
early months after birth,
1,2implying that the
physi-ologic requirement for DHA is highest during the
perinatal period. Clandinin et al
1reported that
⬃
80%
of intrauterine AA
⫹
DHA accumulation occurs
dur-ing the last trimester of pregnancy. Second, the
phys-iologic supply of preformed AA
⫹
DHA to the
pre-mature infant is limited by early termination of
maternal-to-fetal transfer of these fatty acids. Third,
supply may also be limited by immature de novo
synthesis of AA
⫹
DHA from their dietary essential
precursor fatty acids, linoleic (18:2n-6) and
␣
-linole-nic (18:3n-3) acids, respectively. It has been shown
that premature infants are capable of de novo
syn-thesis of AA
⫹
DHA,
3,5but it is not clear whether
synthesis can meet the physiologic requirements for
tissue accretion of these long-chain polyunsaturated
fatty acids.
6Furthermore, the impact of standard
treatment modalities in the neonatal intensive care
unit (eg, drugs, oxygen therapy) and negative energy
balance on these biosynthetic pathways is unknown.
Results of randomized, controlled trials with
pre-mature infants fed formulas containing DHA in the
absence of AA have been interpreted to suggest more
rapid maturation of retinal function,
7visual
func-tion,
8 –10and neurodevelopment.
11–12However, there
are also reports of slower growth in preterm
in-fants
10,13,14and lower scores on a test of infant
lan-guage development in term infants
15fed formulas
containing DHA without AA. As early nutrition and
growth can be a significant predictor of later
devel-opment,
16,17it is difficult to judge whether early
improvements in visual and neurodevelopment are
sufficient to warrant the feeding of DHA at the
ex-pense of slower growth.
Carlson et al
18hypothesized that combined
addi-tion of AA and DHA to formulas would offset the
observed negative impact of DHA on growth. To our
knowledge, only the study by Vanderhoof et al
19is of
sufficient power (able to detect
ⱖ
0.5 standard
devi-ation [SD] difference between groups) to test this
hypothesis, although, arguably it may not have been
of sufficient duration. It is particularly important that
such studies feed both AA and DHA and examine
growth until at least 4 months’ corrected age (CA)
and ideally after, because it is in this period that
growth decelerated in previous studies
10,14where a
low eicosapentaenoic acid (EPA) source of DHA was
fed. Furthermore, no studies to date, including that
of Vanderhoof et al,
19have examined the impact of
feeding AA- and DHA-containing formula to
prema-ture infants until 12 months’ CA, the recommended
duration of formula feeding for term infants not fed
human milk.
20In addition, no studies have examined
the impact of feeding AA
⫹
DHA beyond 2 months’
CA as part of a nutrient-enriched feeding regimen
specifically designed for premature infants. Lucas et
al
21demonstrated that the use of a nutrient-enriched
formula to 9 months’ CA resulted in greater linear
growth and weight gain among premature infants
than a formula designed for the term infant.
Further-more, none of the studies to date attempted to
con-trol for the potentially confounding effects of home
environment and maternal intelligence on early
in-fant development.
22Therefore, we conducted a comprehensive,
ran-domized, controlled trial with adequate power and
duration to assess the suitability and possible
bene-fits of supplementing nutrient-enriched formulas
de-signed for premature infants with oils containing
AA
⫹
DHA to 12 months’ CA.
MATERIALS AND METHODS Study Sample Selection
Four hundred seventy preterm infants (⬍33 weeks’ gestational age) with birth weights of 750 to 1805 g were enrolled between October 1996 and January 1998 from neonatal intensive care units in Cleveland, Ohio (N⫽48); Kansas City, Missouri (N⫽84); Little Rock, Arkansas (N⫽24); Nottingham and Leeds, United King-dom (N⫽85); Louisville, Kentucky (N⫽74); Portland, Oregon (N⫽88); New York, New York (N⫽16); and Santiago, Chile (N⫽
51). To assess the impact of study feeding on early feeding toler-ance, infants were to be enrolled within 72 hours of the first enteral feeding (including trophic feeds or water). To broaden recruit-ment beyond the healthiest of infants in the nursery, infants could be enrolled as long as enteral feeding was initiated by the 28th day of life. Singleton and twin births and small-for-gestational age infants were allowed to participate. Infants with serious congen-ital abnormalities that could affect growth and development or who had undergone major surgery before randomization were not eligible to participate. Other exclusion criteria included periven-tricular/intraventricular hemorrhage greater than Grade II, ma-ternal incapacity (including mama-ternal cocaine or alcohol abuse during pregnancy or at time of enrollment), liquid ventilation, asphyxia resulting in severe and permanent neurologic damage, or uncontrolled systemic infection at the time of enrollment.
Experimental Design
After informed written consent from at least 1 parent or guard-ian, infants were randomized to 1 of 3 study formula groups with or without added long-chain polyunsaturated fatty acids; 1) con-trol, 2) AA⫹DHA (fish/fungal oil), and 3) AA⫹DHA (egg-de-rived triglyceride [egg-TG]/fish oil). The centrally computer-gen-erated randomization schedule was stratified for site, gender, and birth weight stratum (750 –1250 g and 1251–1800 g) using a ran-dom permuted blocks algorithm. After ranran-domization, partici-pants were fed human milk and/or the assigned inhospital pre-term formula (modified version of Similac Special Care ready-to-feed [24 kcal/fl oz]; SSC) with or without AA- and DHA-enriched oils until term CA. At term CA, infants were transitioned to an assigned postdischarge nutrient-enriched formula (modified ver-sion of NeoSure powder [22 kcal/fl oz]) with and without the same sources of AA⫹DHA and/or human milk to 12 months CA. The modified versions of SSC and NeoSure used for both control and AA⫹DHA-containing formulas in the present study differed from the commercial versions of these products in that they con-tained nucleotides (mean⫽84.6 and 80.5 mg of free nucleotides/L for SSC and NeoSure, respectively), had a modified whey to casein ratio (approximately 50:50), and contained-carotene (0.60 and 0.50 mg/L for SSC and NeoSure, respectively) and natural vitamin E (RRR␣-tocopherol; 40.2 and 33.0 IU/L for SSC and NeoSure, respectively). The NeoSure product also contained a higher pro-portion of lactose (75% vs 50% carbohydrate).
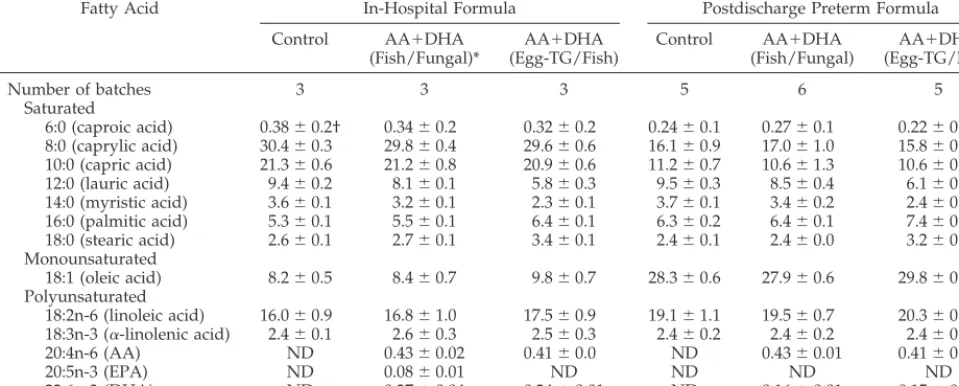
The fatty acid composition of study formulas is found in Table 1. Formulas provided the dietary essential fatty acids, linoleic and
formula and 0.44% and 0.16% for the NeoSure formula. In one of the AA⫹DHA-supplemented groups, fungal oil and low-EPA fish oil (DHA to EPA ratio ⬃3.5:1) were added to both SSC and NeoSure to provide AA and DHA, respectively. The EPA content was 0.08% of fatty acids in the SSC study formula, but was un-detectable in the NeoSure study formula. In the other AA⫹ DHA-supplemented group, egg-TG/fish provided both AA and DHA and low-EPA fish oil provided additional DHA in the SSC formula only. The EPA content was undetectable in these formulas.
During the planning phase, it was apparent that most infants in the participating neonatal intensive care units were neither exclu-sively formula nor human milk-fed, but rather fed a combination of formula and human milk. Hence, the study was designed to accommodate human milk feeding. At the time of first enteral feeding (study day 1 [SDAY 1]), infants could be 1) exclusively human milk-fed, 2) exclusively formula-fed, or 3) fed a combina-tion of human milk and formula. There were no protocol restric-tions that limited the amount or duration of human milk feeding. Whenever study infants were fed formula (eg, were being weaned from human milk), the protocol required the infant be fed the assigned study formula unless there was a medical indication to do otherwise. Infants who discontinued the assigned study feed-ing before 12 months’ CA did not have subsequent blood samples drawn and were not administered the Fagan Test of Infant Intel-ligence. As planned a priori, a reference group consisting of in-fants exclusively human milk-fed until term CA (EHM-T) was identified from the pool of infants randomized to the 3 study formula groups. Exclusive human milk feeding was defined as
⬍100 mL/kg birth weight formula for the total duration of their initial hospital stay and ⬎80% of all feedings as human milk (fortified or unfortified) at term CA.
Demographic Data
Neonatal, perinatal, and family characteristics of enrolled in-fants were obtained from medical records or parental report. The HOME Inventory23was administered as an in-office questionnaire to the biological mother (if she was living in the home) to assess the quality and quantity of cognitive, social, and emotional sup-port available to each infant in the home environment. The verbal scale of the Wechsler Adult Intelligence Scale-Revised (WAIS-R),24 serving as a proxy of maternal intelligence, was individually administered to the biological mother (if living in the home) or primary caregiver at the 9-month CA visit.
Blood Fatty Acid Analyses
If blood was drawn at SDAY 1 and at hospital discharge as part of routine clinical practice, then additional blood was drawn for
determination of the fatty acid composition of plasma and the phosphatidylcholine (PC) and phosphatidylethanolamine (PE) membrane fractions of red blood cells (RBCs). Furthermore, an attempt was made to obtain blood from all study infants who remained on human milk and/or study formulas at 4 and 12 months’ CA for blood fatty acid analyses. Blood samples were processed and frozen at⫺70°C, and shipped on dry ice to a central laboratory (Analytical Research and Services, Ross Products Divi-sion, Columbus, OH) for analysis.25
Growth
Weight, length, and head circumference of infants were mea-sured according to standardized procedures26 at SDAY 1 (⫾ 7 days) and at term (⫾7 days), 2 (⫾7 days), 4 (⫾7 days), 6 (⫾7 days), 9 (⫾7 days) and 12 (⫾ 10 days) months’ CA. At each assessment, infants were weighed at least once in-hospital and twice after hospital discharge using an electronic or double-beam balance accurate to either⫾10 g (in-hospital) or⫾20 g (postdis-charge). Recumbent length was measured to the nearest 0.1 cm using a length board with a fixed headboard and a movable footboard (Ellard Length Board, Seattle, WA). Head circumference was measured with a nonstretchable tape measure (InserTape, Ross Products Division, Columbus, OH).
In-Hospital Feeding Tolerance and Clinical Problems The percentage of infants who had enteral feedings withheld for at least 1 day, the percentage of infants who had enteral feedings withheld because of gastric residuals, and the number of days to reach full enteral feeding (100 kcal/kg/d) were deter-mined by reviewing the medical records for each infant for each day of initial hospitalization. Likewise, the incidence of suspected necrotizing enterocolitis (NEC), confirmed NEC (roentgenograph-ic, surgical or postmortem evidence of pneumatosis, intra-abdom-inal free air or gas in the portal tract, or perforation), suspected systemic infection, confirmed systemic infection (positive blood culture), and chronic lung disease (supplemental oxygen beyond 1-month postnatal or 36 weeks’ CA) were extracted from medical records.
Serious and/or Unexpected Adverse Events (SAEs) A SAE was defined as any event that occurred during the clinical trial that resulted in death or was life-threatening, dis-abling, required hospital admission, or required intervention to prevent permanent impairment. This definition excluded nonlife-threatening emergency department visits. During the initial hos-pitalization period, the site research teams were instructed not to
TABLE 1. Fatty Acid Composition of the Study Formulas
Fatty Acid In-Hospital Formula Postdischarge Preterm Formula
Control AA⫹DHA (Fish/Fungal)*
AA⫹DHA (Egg-TG/Fish)
Control AA⫹DHA (Fish/Fungal)
AA⫹DHA (Egg-TG/Fish)
Number of batches Saturated
3 3 3 5 6 5
6:0 (caproic acid) 0.38⫾0.2† 0.34⫾0.2 0.32⫾0.2 0.24⫾0.1 0.27⫾0.1 0.22⫾0.1 8:0 (caprylic acid) 30.4⫾0.3 29.8⫾0.4 29.6⫾0.6 16.1⫾0.9 17.0⫾1.0 15.8⫾0.6 10:0 (capric acid) 21.3⫾0.6 21.2⫾0.8 20.9⫾0.6 11.2⫾0.7 10.6⫾1.3 10.6⫾0.6 12:0 (lauric acid) 9.4⫾0.2 8.1⫾0.1 5.8⫾0.3 9.5⫾0.3 8.5⫾0.4 6.1⫾0.4 14:0 (myristic acid) 3.6⫾0.1 3.2⫾0.1 2.3⫾0.1 3.7⫾0.1 3.4⫾0.2 2.4⫾0.2 16:0 (palmitic acid) 5.3⫾0.1 5.5⫾0.1 6.4⫾0.1 6.3⫾0.2 6.4⫾0.1 7.4⫾0.1 18:0 (stearic acid) 2.6⫾0.1 2.7⫾0.1 3.4⫾0.1 2.4⫾0.1 2.4⫾0.0 3.2⫾0.9 Monounsaturated
18:1 (oleic acid) 8.2⫾0.5 8.4⫾0.7 9.8⫾0.7 28.3⫾0.6 27.9⫾0.6 29.8⫾0.4 Polyunsaturated
18:2n-6 (linoleic acid) 16.0⫾0.9 16.8⫾1.0 17.5⫾0.9 19.1⫾1.1 19.5⫾0.7 20.3⫾0.4 18:3n-3 (␣-linolenic acid) 2.4⫾0.1 2.6⫾0.3 2.5⫾0.3 2.4⫾0.2 2.4⫾0.2 2.4⫾0.2 20:4n-6 (AA) ND 0.43⫾0.02 0.41⫾0.0 ND 0.43⫾0.01 0.41⫾0.02
20:5n-3 (EPA) ND 0.08⫾0.01 ND ND ND ND
22:6n-3 (DHA) ND 0.27⫾0.04 0.24⫾0.01 ND 0.16⫾0.01 0.15⫾0.02 ND indicates none detected.
* The purveyors of the fish, fungal, and egg-TG oils were Mochida International (Tokyo, Japan), Suntory Ltd (Osaka, Japan), and Eastman Chemicals Co (Kingsport, TN), respectively.
include SAEs (other than infant death) which were expected in the natural history of the preterm infant but to include SAEs that, in the opinion of the investigator, could be, or were associated with the use of the study product.
Each SAE was reviewed and assigned an ␣-numeric organ system and severity score by a neonatologist (P Pollack, MD, Ross Products Division, Columbus, OH) masked to study feeding groups. Main categories included: 1) death; 2) pulmonary central, autonomic (eg, apnea, sudden cyanosis); 3) pulmonary parenchy-mal (eg, pneumonia, respiratory syncytial virus, asthma, wheez-ing); 4) other serious nonpulmonary disease (eg, diarrhea, dehy-dration, emesis, fever, sepsis); and 5) definitely unrelated to study feeding (eg, laser therapy for retinopathy, hernia repairs).
Visual Acuity
Behavioral Acuity
Behavioral visual acuity was assessed using the Teller Acuity Card Procedure (Vistech Inc, Dayton, OH)27at 2, 4, and 6 months’ CA (⫾7 days) after formal training and certification of each tester (primary tester and back-up). One of every 4 study infants, plus a small cohort of nonstudy infants (N⫽184), was tested by 2 trained testers at each site to determine reliability. Tester agreement was within 0.59 and 0.50 octaves (1 line on a Snellen eye chart) for 95% and 78% of tests, respectively.
Visual Evoked Potential (VEP) Acuity
Visual acuity at 4 and 6 months’ CA (⫾7 days) was estimated using a VEP procedure28,29 at the Kansas City, New York, and Portland sites only. The electroencephalogram (EEG) was re-corded using 3 gold-cup EEG electrodes placed along the midline of the head with the active site at Oz, referenced to the vertex (Cz) and grounded midway between these 2 locations (Pz). An ENFANT recording system (Neuroscientific Corp, Morrisville, PA) was used to generate the visual stimuli, record the electro-physiological signals, and store the data (gain⫽20K, bandpass⫽ 0.5–100 Hz). Black and white (100% contrast) horizontal square-wave gratings (ie, black and white stripes) using a swept-parameter technique were presented on the stimulus display (noninterlaced frame rate ⫽ 59.9809 Hz, mean space-average luminance 100 cd/m2; Nokia RGB monitor, Raleigh, NC) and contrast-reversed at 7.4976 Hz.28,29Infants were seated on a par-ent’s lap in a darkened room at a distance of 114 cm from the stimulus display. At this distance, the screen subtended a visual angle of 10⫻10 degrees.
A discrete Fourier transform was performed on each 1-second epoch of the EEG. The sine and cosine components of the second harmonic response for each corresponding epoch (either 5 or 10 sweeps) were vector-averaged to yield a mean response. Ampli-tude and phase values were derived from these means. The Tcirc-squared statistic was used to estimate a 95% confidence circle about the mean vector and obtain a signal-to-noise ratio (S:N).29,30 Acuity was estimated by linear interpolation between 2 adjacent points to a S:N⫽1 (1 point with S:N⬎1 and the other point with S:N⬍1).
General Developmental Level
The Bayley Scales of Infant Development31 (Psychological Corp, San Antonio, TX) was administered by a single, certified tester at each site (except where there was a turnover of study staff) at 12 months’ CA (⫾10 days) to assess cognitive and motor development (Mental Developmental Index; Psychomotor Devel-opmental Index; respectively). After a centralized training session, testers videotaped sessions in which they administered the Bayley to 12 months’ CA nonstudy infants. A tester was considered certified when s/he had administered 3 sessions in which there was 80% agreement with the central tester (Dr R Arendt, Cleve-land, OH) on items for the Mental Developmental Index and Psychomotor Development Index. One out of approximately ev-ery 10 study infants (N⫽41) was videotaped during the admin-istration of the Bayley and these videotapes were scored centrally, independent of the site tester. The average percent agreement on scoring between site testers and the central testers was 91% (range, 71%–100%) and 93% (range 73%–100%) for the mental and motor development indices, respectively.
Information Processing
The Fagan Test of Infant Intelligence32(Infantest Corporation, Cleveland, OH) was administered at 6 and 9 months’ CA (⫾7 days) to infants who remained on study feeding at the time of the clinic visit by trained and certified testers. Novelty preference, a measure of visual recognition memory, was computed by deter-mining the percent of total looking time spent looking at a novel versus familiar face stimuli during the test phase. In addition, the mean duration of individual looks, construed as a measure of efficiency of information processing, was computed for the familiarization period, an abbreviated time during the familiariza-tion period and during the paired comparison procedure test period.11,12,33
Language
The vocabulary checklist from the infant version of the MacArthur Communicative Development Inventories,34 a stan-dardized parent-report instrument, was completed at 9 months’ CA (⫾7 days) and 14 months’ (⫾10 days) CA. This checklist of words was used to provide information about each child’s vocab-ulary comprehension (words the child understands) at 9 and 14 months’ CA, and vocabulary production (words the child says) at 14 months’ CA. Percentile scores were computed from age- and gender-specific norms and transformed to standard scores.
Statistical Methods
The primary analysis for this intent-to-treat study included all enrolled infants as randomized. Based on anticipated protocol deviations in this high-risk patient population over the ⬃ 16-month study period, a planned subgroup analysis included data through the last collection time at which infants strictly adhered to the feeding protocol, defined as remaining on the feeding protocol at term CA and after term CA consuming⬎80% of milk feedings (study formula, human milk, nonstudy formula, cow’s milk) as study formula and/or human milk at each visit.
A sample size of 140 per group was estimated for detection of a 0.5 SD difference with 80% power and␣⫽0.05 for the Bayley at 12 months’ CA among the 3 study formula groups. This sample size estimate took into account anticipated infant attrition (20%), a possible blunting effect of human milk intake on outcome vari-ables (25%), and the formation of an EHM-T intake reference.
Categorical variables were analyzed using 2 or Cochran-Mantel-Haenszel tests and continuous variables using analysis of variance (analysis of variance) and/or analysis of covariance (ANCOVA). Data obtained at⬎1 time point were analyzed using repeated-measures analyses that accommodate missing observa-tions (SAS PROC MIXED, SAS Institute, Inc, Cary, NC).35 As defined a priori, statistical comparisons among the 3 study for-mula groups included site as a covariate. Because of small num-bers of infants, the Little Rock and New York sites were treated as a single site in the statistical analyses, except for the VEP analyses, for which data from the New York and Kansas City sites were pooled. In addition, analyses of continuous outcome variables included enrollment strata as covariates (gender and birth weight [750 –1250 g or 1251–1800 g]), interactions between study group and enrollment strata covariates, and a covariate for human milk intake.
RESULTS Study Sample
Three hundred seventy-six (80%) of the 470 infants
enrolled completed the study to 12 months’ CA.
Forty-three infants were classified as EHM-T feeders
based on human milk intake until term CA. Of the
144 infants in the formula control group, 126 (88%)
and 91 (63%) remained on study feeding at term and
12 months’ CA, respectively. Similarly, of the 140
infants enrolled in the AA
⫹
DHA (fish/fungal)
group, 120 (86%) and 89 (64%) remained on study
feeding at term and 12 months’ CA, and of the 143
infants enrolled in the AA
⫹
DHA (egg-TG/fish)
group, 126 (88%) and 91 (64%) remained on study
feeding at term and 12 months’ CA. At term CA,
35%, 28%, and 33% of infants in the control,
AA
⫹
DHA (fish/fungal), and AA
⫹
DHA (egg-TG/
fish) groups, respectively, consumed human milk at
least once per day. By 4 months’ CA, only 14%, 12%,
and 12% of infants in the control, AA
⫹
DHA (fish/
fungal), and AA
⫹
DHA (egg-TG/fish) groups,
re-spectively, consumed human milk. Nineteen (13%),
20 (14%), 11 (8%), and 1 (2%) of infants in the control,
AA
⫹
DHA (fish/fungal), AA
⫹
DHA (egg-TG/fish),
and EHM-T groups, respectively, discontinued study
feeding because of symptoms typically associated
with feeding intolerance (primary reason for
discon-tinuation provided by site investigator). During the
course of the study, 6, 3, 6, and 0 infants randomized
to the control, AA
⫹
DHA (fish/fungal), AA
⫹
DHA
(egg-TG/fish), and EHM-T groups, respectively,
died. No infant deaths were related to study feedings
as judged by the investigator at each site. No
statis-tically significant differences existed among formula
groups with respect to the aforementioned exit
out-comes.
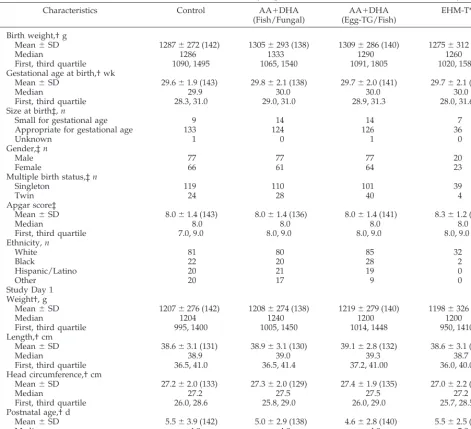
Infant and Family Demographics
Infant and family baseline demographics did not
differ among study formula groups, with the
excep-tion of scores on the HOME Inventory (Tables 2 and
3). HOME Inventory scores were higher (better) in
infants
ⱕ
1250 g randomized to the control group (LS
mean
⫾
SE, 36.0
⫾
0.7) than those randomized to the
AA
⫹
DHA (fish/fungal) group (33.7
⫾
0.7,
P
⫽
.029).
HOME Inventory scores were lower in infants in
the
⬎
1250 g birth weight stratum randomized to the
AA
⫹
DHA (egg-TG/fish) group (LS mean
⫾
SE,
33.6
⫾
0.7) than for the control (36.2
⫾
0.6,
P
⫽
.006)
and the AA
⫹
DHA (fish/fungal) groups (36.2
⫾
0.6,
P
⫽
.004). A marginally statistically significant
dif-ference in multiple birth status (twin vs singleton
birth) across the 3 study formula groups was also
observed (P
⫽
.054). Approximately 17%, 20%, and
28% of participants were twins in the control,
AA
⫹
DHA (fish/fungal), and AA
⫹
DHA (egg-TG/
fish) group, respectively. In view of this somewhat
disproportionate distribution, the primary
develop-mental outcomes were analyzed with and without
twins (intent-to-treat). Except for language
develop-ment, results for developmental outcomes did not
change when twins were excluded.
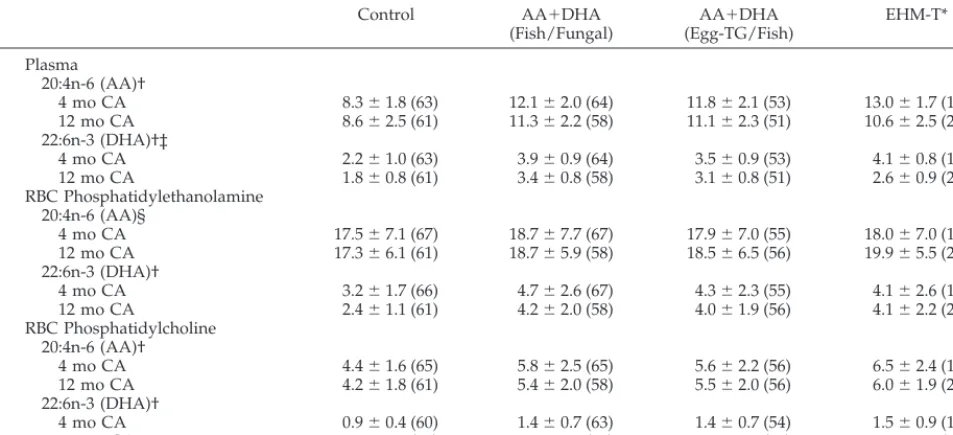
Blood Fatty Acid Analyses
At SDAY 1, the study formula groups did not
differ significantly with respect to the levels (g/100
g) of AA and DHA in the plasma or in the PE or PC
fractions of RBCs (data not shown). By hospital
dis-charge, infants consuming AA
⫹
DHA-supplemented
formulas had generally higher blood levels of AA
and DHA than infants in the control group. For
example, infants in the control, AA
⫹
DHA (fish/
fungal), AA
⫹
DHA (egg-TG/fish), and EHM-T
groups, had LS mean
⫾
SE levels of plasma
phos-pholipid AA (wt%) of 10.3
⫾
0.5, 12.7
⫾
0.5, 12.8
⫾
0.5, and 13.9
⫾
0.6, respectively, and the least square
(LS) mean (
⫾
standard error [SE]) levels of DHA
were 2.7
⫾
0.2, 3.5
⫾
0.2, 3.3
⫾
0.2, and 3.5
⫾
0.2,
respectively, at hospital discharge (control
⬍
AA
⫹
DHA fish/fungal, and AA
⫹
DHA egg-TG/fish;
P
⬍
.001). The mean number of days between SDAY
1 and hospital discharge was
⬃
41.
With the exception of AA levels in RBC PE at 4 and
12 months’ CA, infants fed the AA
⫹
DHA-supple-mented formulas had higher levels of AA and DHA
in plasma and RBC phospholipids than those fed the
control formulas (P
⬍
.0001; Table 4). Infants fed
AA
⫹
DHA (fish/fungal) but not AA
⫹
DHA
(egg-TG/fish), had higher levels of AA in RBC PE than
infants fed control formulas (P
⬍
.02).
Growth
In the intent-to-treat population, few and
inconsis-tent differences were found in weight, length, or
head circumference gains from SDAY 1 to term,
SDAY 1 to 4 months’ CA, or SDAY 1 to 12 months’
CA or in repeated measures analyses of absolute
weight, length, and head circumference
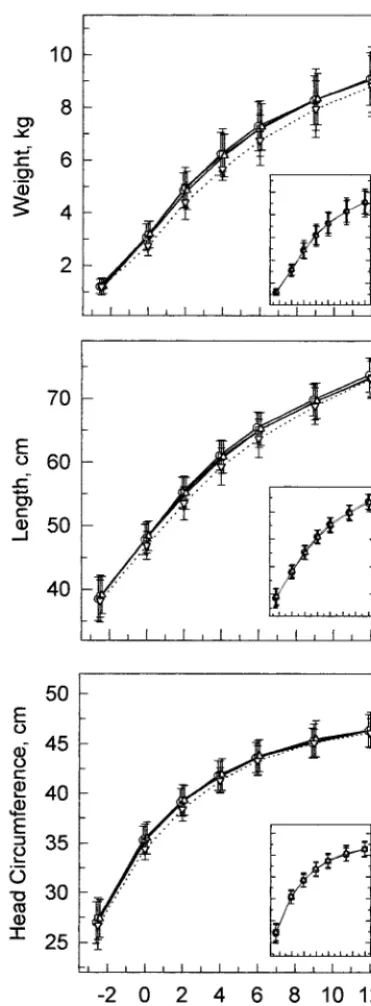
measure-ments through 12 months’ CA (Table 5 & Fig 1).
These differences were not seen when analysis of the
intent-to-treat population excluded infants
consum-ing
⬎
50% of initial in-hospital energy from human
milk.
Similarly, among strict feeding protocol followers
(infants who consumed
⬎
80% of their feeding as
study formula and/or human milk), few and
incon-sistent differences were found in anthropometric
gains or in repeated measures analyses of
anthropo-metric measurements across study visits. Mean
length gain from SDAY 1 to 4 months’ CA was
greater among control (LS Mean
⫾
SE, 8.7
⫾
0.1
mm/wk) than among AA
⫹
DHA (egg-TG/fish)-fed
infants (8.3
⫾
0.1 mm/wk,
P
⫽
.04). There was a
statistically significant interaction between feeding
and gender for head circumference gain from SDAY
1 to term CA. Mean head circumference gain from
SDAY 1 to term CA was greater among female
con-trol than among female AA
⫹
DHA
(egg-TG/fish)-fed female infants (9.2
⫾
0.2 mm/wk vs 8.4
⫾
0.2
mm/wk,
P
⫽
.003).
In-Hospital Feeding Tolerance and Clinical Problems
at least 1 day, the percentage of infants who had
enteral feedings withheld because of gastric
residu-als, and number of days to reach full enteral feeding
(Table 6). Likewise, there were no differences among
study formula groups in the incidence of chronic
lung disease or in suspected or confirmed cases of
systemic infection or NEC.
SAEs
The percentage of infants who had at least 1 SAE
did not differ among study formula groups with
44%, 46%, and 47% of infants randomized to the
control, and AA
⫹
DHA (fish/fungal), AA
⫹
DHA
(egg-TG/fish) groups, respectively having at least 1
SAE. Thirty-eight percent, 39%, and 43% of infants
randomized to the control, AA
⫹
DHA (fish/fungal)
and AA
⫹
DHA (egg-TG/fish) groups, respectively,
had at least 1 hospital readmission. The number of
SAEs and hospital readmissions did not differ when
comparisons among feeding groups were made
within each birth weight stratum (750 –1250 g or
1251–1800 g). Finally, no statistically significant
feed-ing differences were found within each SAE
numer-ical and alphabetnumer-ical system and severity rating.
Visual Acuity
Regardless of whether statistical analysis was
per-formed on the intent-to-treat population or strict
feeding protocol followers, no significant effect of
study feeding on behavioral acuity was found using
preplanned statistical comparisons (Fig 2). Likewise,
no statistically significant effect of study feeding on
VEP acuity was found at 4 months’ CA. In contrast,
at 6 months’ CA, the mean VEP acuity of infants
TABLE 2. Neonatal and Perinatal Characteristics of the Total Study Population of Preterm Infants: Intent-to-Treat AnalysisCharacteristics Control AA⫹DHA (Fish/Fungal)
AA⫹DHA (Egg-TG/Fish)
EHM-T*
Birth weight,† g
Mean⫾SD 1287⫾272 (142) 1305⫾293 (138) 1309⫾286 (140) 1275⫾312 (43)
Median 1286 1333 1290 1260
First, third quartile 1090, 1495 1065, 1540 1091, 1805 1020, 1580 Gestational age at birth,† wk
Mean⫾SD 29.6⫾1.9 (143) 29.8⫾2.1 (138) 29.7⫾2.0 (141) 29.7⫾2.1 (43)
Median 29.9 30.0 30.0 30.0
First, third quartile 28.3, 31.0 29.0, 31.0 28.9, 31.3 28.0, 31.6 Size at birth‡,n
Small for gestational age 9 14 14 7
Appropriate for gestational age 133 124 126 36
Unknown 1 0 1 0
Gender,‡n
Male 77 77 77 20
Female 66 61 64 23
Multiple birth status,‡n
Singleton 119 110 101 39
Twin 24 28 40 4
Apgar score‡
Mean⫾SD 8.0⫾1.4 (143) 8.0⫾1.4 (136) 8.0⫾1.4 (141) 8.3⫾1.2 (43)
Median 8.0 8.0 8.0 8.0
First, third quartile 7.0, 9.0 8.0, 9.0 8.0, 9.0 8.0, 9.0 Ethnicity,n
White 81 80 85 32
Black 22 20 28 2
Hispanic/Latino 20 21 19 0
Other 20 17 9 0
Study Day 1 Weight†, g
Mean⫾SD 1207⫾276 (142) 1208⫾274 (138) 1219⫾279 (140) 1198⫾326 (43)
Median 1204 1240 1200 1200
First, third quartile 995, 1400 1005, 1450 1014, 1448 950, 1410 Length,† cm
Mean⫾SD 38.6⫾3.1 (131) 38.9⫾3.1 (130) 39.1⫾2.8 (132) 38.6⫾3.1 (41)
Median 38.9 39.0 39.3 38.7
First, third quartile 36.5, 41.0 36.5, 41.4 37.2, 41.00 36.0, 40.0 Head circumference,† cm
Mean⫾SD 27.2⫾2.0 (133) 27.3⫾2.0 (129) 27.4⫾1.9 (135) 27.0⫾2.2 (40)
Median 27.2 27.5 27.5 27.2
First, third quartile 26.0, 28.6 25.8, 29.0 26.0, 29.0 25.7, 28.5 Postnatal age,† d
Mean⫾SD 5.5⫾3.9 (142) 5.0⫾2.9 (138) 4.6⫾2.8 (140) 5.5⫾2.5 (43)
Median 4.0 4.0 4.0 5.0
First, third quartile 3.0, 7.0 3.0, 6.0 3.0, 5.0 4.0, 7.0
No statistically significant differences were found (P⬍.05); multiple birth status (P⫽.054).
* Exclusively human milk-fed during the early neonatal period. Reference group only, these data were not included in the statistical analyses.
† Differences across formula groups were assessed by ANCOVA controlling for site, gender, birth weight stratum, feeding* gender, and feeding* birth weight stratum.
randomized to either AA
⫹
DHA (fish/fungal; LS
mean [cy/d]
⫾
SE [octaves], 11.4
⫾
0.1;
P
⫽
.0098) or
AA
⫹
DHA (egg-TG/fish; 12.5
⫾
0.1,
P
⫽
.0018) was
greater than for infants in the control formula group
(8.4
⫾
0.1, Fig 3). Furthermore, the mean VEP acuity
of infants randomized to the AA
⫹
DHA-supple-mented formulas increased between 4 and 6 months’
CA, but the mean VEP acuity of those in the control
group did not. Among infants who consumed
⬎
80%
of their feeding as study formula and/or human
milk, the mean VEP acuity of infants fed AA
⫹
DHA
(egg-TG/fish; 12.9
⫾
0.1) was greater than for
control-fed (8.5
⫾
0.1) infants at 6 months’ CA (P
⫽
.002). There was a marginally statistically significant
difference showing higher visual acuity among
AA
⫹
DHA (fish/fungal)-fed infants (10.6
⫾
0.1) than
control infants aged 6 months’ CA (P
⫽
.08). VEP
acuity of infants fed AA
⫹
DHA (egg-TG/fish) did
not differ significantly from that of infants fed
AA
⫹
DHA (fish/fungal) at either 4 or 6 months’ CA.
General Development Level
Regardless of whether the statistical analysis of the
data included all infants randomized into the study
or included only those infants who strictly adhered
to the feeding protocol, no differences were found
among study formula groups in the Bayley mental
index (Table 7). However, a statistically significant
feeding by birth weight stratum interaction was
ob-served for Bayley motor development index (P
⫽
.005) among infants who consumed
⬎
80% of their
feeding as study formula and/or human milk. The
mean Bayley motor index score of infants in the
ⱕ
1250 g birth weight subgroup who strictly followed
the feeding protocol was greater in infants fed
AA
⫹
DHA (fish/fungal; LS mean
⫾
SE, 90.6
⫾
4.4)
than control infants (81.8
⫾
4.3;
P
⫽
.007), even after
adjusting for a number of covariates including the
HOME inventory, maternal WAIS-R, and human
milk intake. The Bayley motor index of AA
⫹
DHA
(egg-TG/fish)-fed infants (84.7
⫾
4.3) did not differ
statistically from either the control or AA
⫹
DHA
(fish/fungal) groups.
The percentage of participants in the intent-to-treat
or subgroup populations who had significantly
de-layed mental or motor performance did not differ
statistically by study formula group. As expected in
a premature population, approximately 4% and 12%
of all infants tested had Bayley mental and motor
scores, respectively,
⬍
70, a level indicative of
signif-icantly delayed performance (intent-to-treat
popula-tion).
Information Processing
A statistically significant feeding by visit
interac-tion was observed for novelty preference (P
⫽
.10),
and average look duration for an abbreviated time
TABLE 3. Family Characteristics: Intent-to-Treat AnalysisCharacteristics Control AA⫹DHA (Fish/Fungal)
AA⫹DHA (Egg-TG/Fish)
EHM-T*
Maternal age,† y 27.2⫾6.3 (143) 27.0⫾6.3 (138) 27.0⫾7.0 (141) 29.7⫾5.1 (43) Maternal education†
US, y 12.9⫾2.4 (99) 13.1⫾2.4 (96) 12.8⫾2.3 (99) 15.1⫾2.0 (34) Chile, y 10.5⫾1.6 (16) 10.1⫾2.2 (19) 8.8⫾3.1 (16) Not applicable UK, highest qualification obtained
None 9 4 6 1
⬍3 O-level‡ 5 6 2 0
⬎3 O-level§ 6 9 12 2
A levels 1 0 1 2
Degree⫹ 2 3 4 4
Maternal smoking during pregnancy,㛳n(%)
Yes 40 (28.0) 35 (25.4) 41 (29.3) 2 (4.7)
No 103 (72.0) 103 (74.6) 99 (70.7) 41 (95.3) Postnatal smoking in the home,㛳n(%)
Yes 37 (27.4) 39 (29.1) 44 (32.1) 4 (9.5)
No 98 (72.6) 95 (70.9) 93 (67.9) 38 (90.5)
Prenatal care,㛳n(%)
First trimester 119 (83.8) 115 (83.9) 114 (80.9) 42 (97.7) Second trimester 19 (13.4) 17 (12.4) 20 (14.2) 0 (0.0) Third trimester or none 4 (2.8) 5 (3.6) 7 (5.0) 1 (2.3) HOME Inventory Score†¶ 36.3⫾5.3 (123) 35.3⫾5.5 (127) 34.8⫾6.5 (109) 39.4⫾3.4 (40) Maternal WAIS-R Raw Vocabulary Score† 39.3⫾12.4 (119) 37.5⫾15.0 (126) 37.0⫾15.2 (108) 53.2⫾8.9 (40) Values are mean⫾SD (number of participants) unless otherwise noted.
* Exclusively human milk-fed during the early neonatal period. Reference group only, these data were not included in the statistical analyses.
† Differences across study formula groups were assessed by ANCOVA controlling for site, gender, birth weight stratum, feeding* gender, and feeding* birth weight stratum.
‡ UK education equivalents:⬍3 Certificate of Education or General CSE below C grade.
§ UK education equivalents:⬎3 Certificates of Education or any O levels or General Certificates of Education grade A–C. 㛳These data were analyzed using2analyses controlling for site.
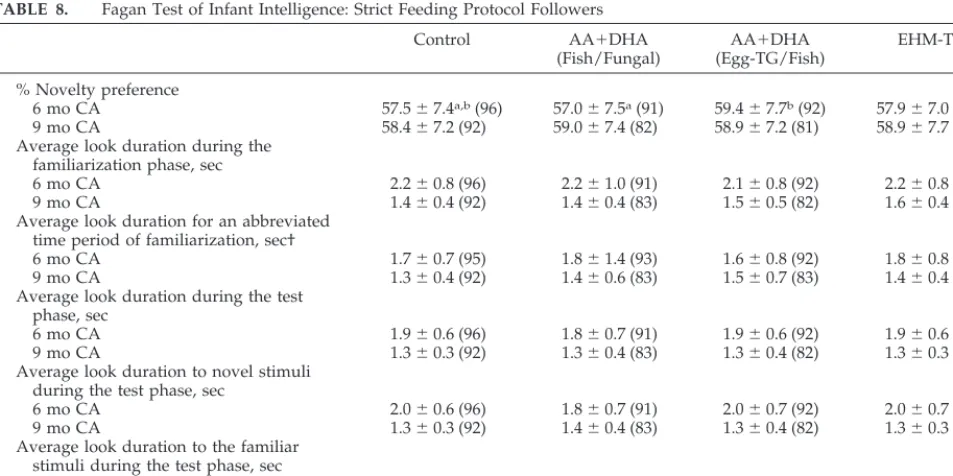
during familiarization (P
⫽
.07), although pairwise
comparisons of study feeding groups at each time
point yielded significant differences for novelty
pref-erence only (Table 8). The mean novelty prefpref-erence
of AA
⫹
DHA (egg-TG/fish)-fed infants (LS means
⫾
SE, 60.0
⫾
0.8) was significantly greater than control
(57.5
⫾
0.8;
P
⫽
.02) and AA
⫹
DHA (fish/fungal)-fed
(56.6
⫾
0.8;
P
⫽
.003) infants at 6 months’ CA. The
difference between AA
⫹
DHA (fish/fungal) and
AA
⫹
DHA (egg-TG/fish) remained statistically
sig-nificant using a Bonferroni adjusted
␣
-level of 0.0083.
Language
Vocabulary comprehension did not differ among
the 3 study formula groups at either 9 or 14 months’
CA in either the intent-to-treat (Table 7) or subgroup
analysis. Likewise, there were no study feeding
dif-ferences in vocabulary production at 14 months’ CA.
In view of the somewhat disproportionate
distribu-tion of twins among the 3 study formula groups,
language outcomes were also analyzed with and
without twins. The validity of using percentile and
gender-specific norms and standard score
conver-TABLE 4. Fatty Acid Levels (wt%) in Plasma and RBC Phospholipids at 4 and 12 Months’ CA: Strict Feeding Protocol FollowersControl AA⫹DHA (Fish/Fungal)
AA⫹DHA (Egg-TG/Fish)
EHM-T*
Plasma 20:4n-6 (AA)†
4 mo CA 8.3⫾1.8 (63) 12.1⫾2.0 (64) 11.8⫾2.1 (53) 13.0⫾1.7 (10) 12 mo CA 8.6⫾2.5 (61) 11.3⫾2.2 (58) 11.1⫾2.3 (51) 10.6⫾2.5 (22) 22:6n-3 (DHA)†‡
4 mo CA 2.2⫾1.0 (63) 3.9⫾0.9 (64) 3.5⫾0.9 (53) 4.1⫾0.8 (10) 12 mo CA 1.8⫾0.8 (61) 3.4⫾0.8 (58) 3.1⫾0.8 (51) 2.6⫾0.9 (22) RBC Phosphatidylethanolamine
20:4n-6 (AA)§
4 mo CA 17.5⫾7.1 (67) 18.7⫾7.7 (67) 17.9⫾7.0 (55) 18.0⫾7.0 (15) 12 mo CA 17.3⫾6.1 (61) 18.7⫾5.9 (58) 18.5⫾6.5 (56) 19.9⫾5.5 (26) 22:6n-3 (DHA)†
4 mo CA 3.2⫾1.7 (66) 4.7⫾2.6 (67) 4.3⫾2.3 (55) 4.1⫾2.6 (15) 12 mo CA 2.4⫾1.1 (61) 4.2⫾2.0 (58) 4.0⫾1.9 (56) 4.1⫾2.2 (26) RBC Phosphatidylcholine
20:4n-6 (AA)†
4 mo CA 4.4⫾1.6 (65) 5.8⫾2.5 (65) 5.6⫾2.2 (56) 6.5⫾2.4 (15) 12 mo CA 4.2⫾1.8 (61) 5.4⫾2.0 (58) 5.5⫾2.0 (56) 6.0⫾1.9 (26) 22:6n-3 (DHA)†
4 mo CA 0.9⫾0.4 (60) 1.4⫾0.7 (63) 1.4⫾0.7 (54) 1.5⫾0.9 (15) 12 mo CA 0.7⫾0.4 (61) 1.3⫾0.6 (58) 1.1⫾0.5 (56) 1.2⫾0.7 (26) Values are mean⫾SD (number of participants). Differences across formula groups were determined using repeated measures analysis of variance controlling for: site, gender, birth weight stratum, feeding* gender, feeding* birth weight stratum, and feeding* visit. * Exclusively human milk-fed during the early neonatal period. Reference group only, these data were not included in the statistical analyses.
† Control⬍AA⫹DHA (fish/fungal), AA⫹DHA (egg-TG/fish),P⬍.0001. ‡ AA⫹DHA (egg-TG/fish)⬍AA⫹DHA (fish/fungal),P⫽.0169. § Control⬍AA⫹DHA (fish/fungal),P⫽.0173.
TABLE 5. Weight, Length, and Head Circumference Gains: Intent-to-Treat Analysis
Control AA⫹DHA (Fish/Fungal)
AA⫹DHA (Egg-TG/Fish)
EHM-T*
Weight gain, g/kg/d
SDay 1 to term CA 13.4⫾1.8 (135) 13.7⫾1.9 (134) 13.3⫾1.8 (135) 12.0⫾1.8 (42) SDay 1 to 4 mo CA 7.3⫾0.5 (127) 7.3⫾0.5 (126) 7.2⫾0.5 (121) 7.1⫾0.7 (41) SDay 1 to 12 mo CA 3.6⫾0.2 (119) 3.6⫾0.2 (123) 3.5⫾0.2 (105) 3.5⫾0.2 (41) Length gain, mm/wk
SDay 1 to term CA 9.8⫾2.1 (124) 9.8⫾2.1 (124) 9.6⫾1.9 (125) 9.1⫾2.1 (40) SDay 1 to 4 mo CA 8.4⫾1.0 (120) 8.3⫾0.9 (123) 8.1⫾0.9 (113) 7.9⫾1.1 (39) SDay 1 to 12 mo CA† 5.7⫾0.5 (111) 5.6⫾0.5 (118) 5.6⫾0.4 (100) 5.7⫾0.5 (39) Head circumference gain, mm/wk
SDay 1 to term CA‡§ 8.7⫾1.4 (126) 8.7⫾1.5 (122) 8.4⫾1.4 (131) 8.0⫾1.1 (39) SDay 1 to 4 mo CA 5.5⫾0.7 (121) 5.5⫾0.6 (121) 5.5⫾0.6 (116) 5.5⫾0.5 (38) SDay 1 to 12 mo CA 3.1⫾0.3 (112) 3.1⫾0.3 (118) 3.1⫾0.3 (103) 3.1⫾0.3 (38) Values are mean⫾SD (number of participants). Differences across study formula groups were assessed by ANCOVA controlling for site, gender, birth weight stratum, size for gestation, human milk intake, feeding* gender, and feeding* birth weight stratum.
* Exclusively human milk-fed during the early neonatal period. Reference group only, these data were not included in the statistical analyses.
† There was a statistically significant feeding* birth weight stratum interaction (P⫽.0853). Length gains were greater amongⱕ1250 g infants in the control versus AA⫹DHA (fish/fungal) group (LS means 5.74 vs 5.67 mm/week,P⫽.0078).
‡ There was a statistically significant feeding* gender interaction (P⫽.0132). Head circumference gains were greater among female infants in the control vs AA⫹DHA (egg-TG/fish) groups (LS means 9.1 vs 8.4 mm/week,P⫽.0039).
§ There was a statistically significant feeding* birth weight stratum interaction (P⫽.0238). Head circumference gains were greater among
sions established using English-speaking infants is
not clearly established for Spanish speakers. When
infants from Spanish-speaking families and twins
were removed from the intent-to-treat analysis,
in-fants randomized to the control group (LS mean
⫾
SE, 94.1
⫾
2.9) had lower vocabulary comprehension
than infants randomized to the AA
⫹
DHA (egg-TG/
fish) (102.2
⫾
2.8,
P
⫽
.0145) or AA
⫹
DHA (fish/
fungal) groups (100.6
⫾
2.9,
P
⫽
.0422). Likewise,
when infants from Spanish-speaking families and
twins were removed from the strict feeding protocol
follower analysis, control-fed infants (LS mean
⫾
SE,
95.3
⫾
3.3) had lower vocabulary comprehension
than AA
⫹
DHA (egg-TG/fish)-fed infants (105.4
⫾
3.4,
P
⫽
.0118).
DISCUSSION
This is the largest randomized, prospective,
longitudinal, and multivariate study to compare
AA
⫹
DHA-supplemented formulas with
unsupple-mented control formulas fed to premature infants
from the time of first enteral feeding to 12 months’
CA. Results from this trial suggest that AA
⫹
DHA-supplementation results in improved visual
develop-ment of preterm infants at 6 months’ CA as assessed
by VEP acuity. At 6 months’ CA, the mean VEP
acuity of infants randomized to either AA
⫹
DHA
(fish/fungal) or AA
⫹
DHA (egg-TG/fish) was
ap-proximately 0.34 and 0.42 octaves, respectively,
higher than that for infants randomized to the
con-trol formula. Although there are distinctions
be-tween VEP and recognition acuity,
36the magnitude
of this difference corresponds to approximately 1
line on a Snellen eye chart (eg, 20/70 vs 20/50).
Unlike AA
⫹
DHA-supplemented infants whose VEP
acuity improved between 4 and 6 months’ CA, the
VEP acuity of infants randomized to the control
for-mula did not improve, suggesting a slower rate of
development of the visual system in this latter group
of infants.
These results are consistent with the higher VEP
acuity (1 and 4 months’ CA) and the more mature
VEP wave latency morphology (3 months’ CA)
among preterm infants supplemented with DHA
alone as reported by Birch et al
37and Faldella et al
38Similarly, Carlson et al
9,10demonstrated improved
Behavioral acuity among DHA-supplemented
pre-term infants at 2 and 4 months’ CA and at 2 months’
CA among preterm infants fed DHA alone from a
low-EPA fish oil source. In the present study, no
statistically significant differences in Behavioral
acu-ity were noted among the study groups using
pre-planned repeated measures comparisons. However,
posthoc analysis of Behavioral acuity results at
each measurement time (2, 4, and 6 months’ CA)
revealed that at 4 months’ CA infants randomized to
AA
⫹
DHA (egg-TG/fish; LS mean [cy/d]
⫾
SE
[octaves], 1.8
⫾
0.1) had significantly higher mean
Behavioral acuity scores than those infants
random-ized to the control formula (1.7
⫾
0.1,
P
⫽
.0323); the
absolute difference, however, is negligible.
In addition to the benefits to visual development
implied by the consistency of the aforementioned
study results, there is a growing body of literature
Fig 1. Weight, length, and head circumference of preterm infantsfed human milk and/or nutrient-enriched formula with or with-out AA and DHA from SDAY 1 (median, 5 days of age) to 12 months CA. Values are presented as mean⫾SD for the intent-to-treat population (large graph) and strict study feeding protocol followers (small graph). Hatched lines with triangle symbols de-note data for infants who were exclusively human milk fed until term CA. Formula groups: 1) control [Circles], 2) AA⫹DHA (fish/ fungal) [Squares], and 3) AA⫹DHA (egg-TG/fish) [Triangles with solid lines]. The sample size for the intent-to-treat population at each measurement time ranged from 118 –135, 123–134, 105–135 and 40 – 42 for the control, AA⫹DHA (fish/fungal), AA⫹DHA (egg-TG/fish) and human milk until term CA groups, respec-tively. The sample size for the strict study feeding protocol fol-lowers at each measurement time ranged from 80 –124, 77–115, 76 –121 and 35– 42 for the control, AA⫹DHA (fish/fungal), AA⫹DHA (egg-TG/fish) and human milk fed until term CA, respectively. Repeated measures analysis demonstrated that the weight and lengths of AA⫹DHA (egg-TG/fish) infants were greater than control infants at term CA (2906⫾48 g vs 2757⫾
suggesting a relationship between the results of early
abnormal visual assessments and later motor and
cognitive impairment.
39 – 43These relationships
sug-gest that the early benefit of AA
⫹
DHA-supplemen-tation to the visual system could have long-term
implications among preterm infants; although this
hypothesis remains untested.
The 4 previously published peer-reviewed clinical
trials demonstrating improved visual development
secondary to supplementation with DHA alone also
report slower growth or were not sufficiently
pow-ered to detect subtle differences in growth
out-comes.
9,10,37,38,44Carlson et al
18hypothesized that
despite adequate intakes of the essential fatty acid,
linoleic acid, preterm infants may need a dietary
source of AA for optimal growth. In contrast, Woltil
et al
45reported that blood levels of AA in premature
infants were related to anthropometric measures at
10 days but not at 42 days of age, leading this group
to conclude that AA status was related to
intrauter-ine but not postnatal growth. Results from the
present study suggest that prolonged feeding of
nutrient enriched formulas in combination with
AA
⫹
DHA-supplementation to at least 6 months’ CA
Fig 3. Visual Evoked Potential (VEP) visual acuity at 4- and 6-mos CA (⫾7 days) of preterm infants at the Kansas City, New York, and Portland research sites fed human milk and/or nutri-ent-enriched formula with or without AA and DHA until 12-mos CA. Data for the intent-to-treat population are shown on the left axis as mean (cycles/degree, cy/deg)⫾ SD (octaves). Hatched lines with triangle symbols denote data for infants who were exclusively human milk fed until term CA. Formula groups: 1) control [Circles], 2) AA⫹DHA (fish/fungal) [Squares], 3) AA⫹DHA (egg-TG/fish) [Triangles with solid lines]. The sample size at each measurement time ranged from 39, 46 –50, 33–37 and 22 for the control, AA⫹DHA (fish/fungal), AA⫹DHA (egg-TG/ fish) and human milk until term groups, respectively. At 6-mos CA, the mean VEP acuity of infants randomized to either AA⫹DHA (fish/fungal) (LS mean⫾SE, 11.4⫾0.1) or AA⫹DHA (egg-TG/fish) (12.5 ⫾0.1) was greater than that of infants ran-domized to the control (8.4⫾0.1)
TABLE 6. In-Hospital Feeding Tolerance and Clinical Problems During the Study Period: Intent-to-Treat Analysis*
Control AA⫹DHA (Fish/Fungal)
AA⫹DHA (Egg-TG/Fish)
EHM-T†
Number of participants 142 138 140 43
Feedings withheld for at least 1 d, % of infants 29 31 31 26 Feedings withheld because of gastric residuals, % of infants 20 17 16 14 Days to reach full enteral feeds (100 kcal/kg/d) 12.8⫾14.6 12.8⫾12.1 12.5⫾14.1 15.8⫾18.9 Suspected case of NEC, % of infants 24 23 26 21 Confirmed cases of NEC, % of infants 4 4 3 0 Suspected systemic infection, % of infants 33 35 39 33 Confirmed cases of systemic infection, % of infants 14 15 15 7 Chronic lung disease, % of infants 25 25 22 28
* Differences across study formula groups were evaluated by Cochran-Mantel-Haenszel statistics or survival analysis (days to full enteral feeding only) controlling for site. No statistically significant differences were found among study feeding groups for the aforementioned variables either during the study or, not shown in the Table, between birth and SDAY 1.
† Exclusively human milk-fed during the early neonatal period. Reference group only, these data were not included in the statistical analyses.
provides a mechanism whereby visual development
can be supported without slowing growth. In the
present study, few and inconsistent differences were
found among the greater than 200 statistical
compar-isons related to weight, length, and head
circumfer-ence gains (Fig 1, Table 5). Others have also recently
reported no growth differences in preterm infants
fed formulas containing both AA and DHA (egg
phospholipid or microbial oils)
19,46,47; however, the
length of time that AA
⫹
DHA-containing formulas
were fed was shorter than in studies where growth
differences were observed.
10,13,14Vanderhoof et al
19recently reported on infants fed nutrient-enriched
premature formulas to term CA and AA
⫹
DHA to 2
months’ CA only, although growth was followed
until each infant’s 12 month CA birthdate. As
re-ported herein, no differences in growth were found
between AA
⫹
DHA supplemented and
unsupple-mented infants. It should be noted, however, that
infants in the Vanderhoof et al
19study probably
represent a healthier subset of the premature infant
population than those in the present study in that
they were larger at birth, and were withdrawn from
study if they did not meet prescribed enteral feeding
TABLE 7. Cognitive, Psychomotor, and Language Development: Intent-to-Treat Analysis*Control AA⫹DHA (Fish/Fungal)
AA⫹DHA (Egg-TG/Fish)
EHM-T†
Bayley’s Scales of Infant Development at 12 mo CA
Mental Development Index 92.2⫾12.2 (119) 92.8⫾11.2 (123) 93.4⫾13.0 (105) 93.1⫾14.5 (41) Motor Development Index 86.3⫾16.2 (118) 87.2⫾14.2 (123) 85.9⫾14.4 (105) 86.8⫾15.2 (41) MacArthur Communicative Development Inventories
Vocabulary Comprehension Scores
9 mo 103.7⫾21.9 (122) 104.2⫾19.1 (122) 101.7⫾19.4 (102) 96.2⫾17.6 (39) 14 mo 99.9⫾17.1 (98) 101.6⫾16.4 (101) 101.2⫾18.8 (93) 97.0⫾14.5 (38) Vocabulary Production Scores
14 mo 97.8⫾18.4 (98) 96.6⫾17.2 (102) 98.3⫾18.1 (93) 96.6⫾18.9 (38) Values are mean⫾SD (number of participants).
* Differences across formula groups were determined using ANCOVA controlling for: site, gender, birth weight stratum, feeding* gender, feeding* birth weight stratum, HOME, maternal WAIS-R raw vocabulary score, gestational age, size for gestation, human milk intake, birth order, and the first language of the biological mother. Bayley mental and motor development index scores⬍50 were excluded from the statistical analyses but are included in the data presented in this Table. No statistically significant effects of study formula feeding, feeding* gender, or feeding* birth weight stratum were found.
† Exclusively human milk-fed during the early neonatal period. Reference group only, these data were not included in the statistical analyses.
TABLE 8. Fagan Test of Infant Intelligence: Strict Feeding Protocol Followers
Control AA⫹DHA (Fish/Fungal)
AA⫹DHA (Egg-TG/Fish)
EHM-T*
% Novelty preference
6 mo CA 57.5⫾7.4a,b(96) 57.0⫾7.5a(91) 59.4⫾7.7b(92) 57.9⫾7.0 (38) 9 mo CA 58.4⫾7.2 (92) 59.0⫾7.4 (82) 58.9⫾7.2 (81) 58.9⫾7.7 (36) Average look duration during the
familiarization phase, sec
6 mo CA 2.2⫾0.8 (96) 2.2⫾1.0 (91) 2.1⫾0.8 (92) 2.2⫾0.8 (38) 9 mo CA 1.4⫾0.4 (92) 1.4⫾0.4 (83) 1.5⫾0.5 (82) 1.6⫾0.4 (36) Average look duration for an abbreviated
time period of familiarization, sec†
6 mo CA 1.7⫾0.7 (95) 1.8⫾1.4 (93) 1.6⫾0.8 (92) 1.8⫾0.8 (38) 9 mo CA 1.3⫾0.4 (92) 1.4⫾0.6 (83) 1.5⫾0.7 (83) 1.4⫾0.4 (36) Average look duration during the test
phase, sec
6 mo CA 1.9⫾0.6 (96) 1.8⫾0.7 (91) 1.9⫾0.6 (92) 1.9⫾0.6 (38) 9 mo CA 1.3⫾0.3 (92) 1.3⫾0.4 (83) 1.3⫾0.4 (82) 1.3⫾0.3 (36) Average look duration to novel stimuli
during the test phase, sec
6 mo CA 2.0⫾0.6 (96) 1.8⫾0.7 (91) 2.0⫾0.7 (92) 2.0⫾0.7 (38) 9 mo CA 1.3⫾0.3 (92) 1.4⫾0.4 (83) 1.3⫾0.4 (82) 1.3⫾0.3 (36) Average look duration to the familiar
stimuli during the test phase, sec
6 mo CA 1.9⫾0.7 (96) 1.8⫾0.7 (91) 1.8⫾0.6 (92) 1.9⫾0.6 (38) 9 mo CA 1.3⫾0.3 (92) 1.3⫾0.4 (82) 1.3⫾0.4 (81) 1.2⫾0.3 (36) Values are mean⫾SD (number of participants). Differences across formula groups were determined using ANCOVA controlling for site, gender, visit, birth weight stratum, feeding* visit, feeding* gender, feeding* birth weight stratum, HOME, maternal WAIS-R raw vocabulary score, gestational age, size for gestation, parity, maternal age, and human milk intake. A statistically significant feeding* visit interaction was observed for % novelty preference (P⫽.10) and average look duration for an abbreviated time during the familiarization period (P⫽.07). Mean novelty preference of AA⫹DHA (egg-TG/fish; LS mean⫾SE, 60.0⫾0.8) was greater than control (57.5⫾0.8; P⫽.02) and AA⫹DHA (fish/fungal)-fed (56.6⫾0.8;P⫽.003) infants at 6 months’ CA. The difference between AA⫹DHA (fish/fungal) and AA⫹DHA (egg-TG/fish) remained significant after Bonferroni adjustment (␣⫽0.0083).
* Exclusively human milk-fed during the early neonatal period. Reference group only, these data were not included in the statistical analyses.
targets or exceeded the protocol limits for oxygen
and corticosteroid use.
In addition to improved visual development in
preterm infants, there was evidence of improved
motor development among infants
ⱕ
1250 g birth
weight randomized to the AA
⫹
DHA (fish/fungal)
group who strictly adhered to the feeding protocol
through 12 months’ CA. The Bayley motor index
measures gross motor abilities such as sitting,
walk-ing, standwalk-ing, stair climbwalk-ing, and hand and finger
fine motor skills. Infants in the AA
⫹
DHA (fish/
fungal) group with birth weights
ⱕ
1250 g had Bayley
motor index scores that were 8 points higher than for
infants in the same birth weight stratum fed the
control formula and similar to those of EHM-T-fed
infants in this birth weight stratum (LS mean
⫾
SE,
89.6
⫾
2.3). Bayley motor index scores of AA
⫹
DHA
(egg-TG/fish)-fed infants were intermediate to the
control and AA
⫹
DHA (fish/fungal) groups. As far
as we are aware, this is the first prospective
random-ized trial demonstrating an improvement in motor
scores among premature infants with AA
⫹
DHA-supplementation.
There did not seem to be any consistent effect of
AA
⫹
DHA-supplementation on measures of novelty
preference and on average look duration during the
familiarization period. Carlson and Werkman
11and
Werkman and Carlson
12demonstrated lower
nov-elty preference in preterm infants supplemented
with DHA only but more and shorter looks to
nov-elty stimuli. These authors’ hypothesize that
collec-tively these data suggest that DHA supplementation
can increase the information-processing speed of
premature infants. No differences in language
com-prehension (9 or 14 months’ CA) or language
pro-duction (14 months’ CA) were found using
pre-planned statistical comparisons. In these analyses,
Spanish-speaking infants and twins were included
by computing percentile and gender-specific norms
and standard score conversions validated using
En-glish-speaking infants.
34Jackson-Maldonado
48re-ported that the trajectories of language acquisition
are similar for Spanish- and English-speaking
chil-dren, justifying this approach. Nonetheless, when
Spanish-speaking infants and twins were removed
from the intent-to-treat analysis, infants randomized
to the control group had lower vocabulary
compre-hension at 14 months’ CA than infants randomized
to the AA
⫹
DHA (fish/fungal) or AA
⫹
DHA
(egg-TG/fish) groups. No difference among study
for-mula groups was found with respect to indicators of
feeding tolerance, incidence of chronic lung disease,
systemic infection, or NEC. Likewise, the percentage
of infants who had at least 1 SAE and the type and
severity of SAEs did not differ among study formula
groups.
CONCLUSION
Results from this comprehensive, randomized,
clinical trial suggest a benefit to feeding formula-fed
preterm infants AA and DHA from either a fish/
fungal oil or egg-TG/fish oil source from the time of
first enteral feeding to 12 months’ CA. Furthermore,
no contraindications or concerns emerged related to
the addition of AA
⫹
DHA to nutrient-enriched
for-mulas from either a fish/fungal or egg-TG/fish
source at the studied levels. On average, fish/fungal
oils provided AA, DHA, and EPA at levels of 0.43,
0.27, and 0.08% fatty acids, respectively, to term CA
and 0.43, 0.16 and 0% of fatty acids, respectively,
from term to 12 months’ CA. Egg-TG/fish oils, on
average, provided AA, DHA, and EPA acid at levels
of 0.41, 0.24, and 0% of fatty acids, respectively, to
term CA and 0.41, 0.15, and 0% fatty acids from term
to 12 months’ CA.
REFERENCES
1. Clandinin MR, Chappell JE, Leong S, Heim T, Swyer PR, Chance GW. Intrauterine fatty acid accretion rates in human brain: implications for fatty acid requirements.Early Human Dev. 1980;4:121–129
2. Martinez M. Developmental profiles of polyunsaturated fatty acids in the brain of normal infants and patients with peroxisomal diseases: severe deficiency of docosahexaenoic acid in Sellweger’s and pseudo-Zellweger’s syndromes.World Rev Nutr Diet. 1991;66:87–102 3. Carnielli VP, Wattimena DJ, Luijendijk IH, Boerlage A, Degenhart HJ,
Sauer PJ. The very low birth weight premature infant is capable of synthesizing arachidonic and docosahexaenoic acids from linoleic and linolenic acids.Pediatr Res. 1996;40:169 –174
4. Salem N Jr, Wegner B, Mena P, Uauy R. Arachidonic and docosahexa-enoic acids are biosynthesized from their 18-carbon precursors in hu-man infants.Proc Natl Acad Sci U S A. 1996;93:49 –54
5. Sauerwald TU, Hachey DL, Jensen CL, et al. Effect of dietary alpha-linoleic acid intake on incorporation of docosahexaenoic and arachi-donic acids into plasma phospholipids of term infants.Lipids. 1996;31: S131–S135
6. Carlson SE. Long-chain polyunsaturated fatty acid supplementation of preterm infants. In: Dobbing J, ed.Developing Brain and Behavior: The Role of Lipids in Infant Formula. San Diego, CA: Academic Press, Ltd; 1997: 41–102
7. Uauy RD, Birch DG, Birch EE, Tyson JE, Hoffbrand DR. Effect of dietary omega-3 fatty acids on the retinal function of very-low-birth-weight neonates.Pediatr Res. 1990;28:485– 492
8. Birch E, Birch D, Hoffman D, Hale L, Everett M, Uauy R. Breast-feeding and optimal visual development.J Pediatr Ophthalmol Strabismus. 1993; 30:33–38
9. Carlson SE, Werkman SH, Rhodes PG, Tolley EA. Visual-acuity devel-opment in healthy, preterm infants: effect of marine-oil supplementa-tion.Am J Clin Nutr. 1993;58:35– 42
10. Carlson SE, Werkman SH, Tolley EA. The effect of long-chain n-3 fatty acid supplement on visual acuity and growth of preterm infants with and without bronchopulmonary dysplasia. Am J Clin Nutr. 1996;63: 687– 697
11. Carlson SE, Werkman SH. A randomized trial of visual attention of preterm infants fed docosahexaenoic acid until 2 months.Lipids. 1996; 31:85–90
12. Werkman SH, Carlson SE. A randomized trial of visual attention of preterm infants fed docosahexaenois acid until nine months.Lipids. 1996;31:91–97
13. Carlson SE, Cooke RJ, Werkman SH, Tolley EA. First year growth of preterm infants fed standard compared to marine oil n-3 supplemented formula.Lipids. 1992;27:901–907
14. Ryan AS, Montalto MB, Groh-Wargo S, et al. Effect of DHA-containing formula on growth of preterm infants to 59 wks postmenstrual age.
Am J Hum Biol. 1999;11:457– 467
15. Scott DT, Janowsky JS, Carroll RE, et al. Formula supplementation with long-chain polyunsaturated fatty acids: Are there developmental ben-efits? Pediatrics. 1998;102(5). URL: http://www.pediatrics.org/cgi/ content/full/102/5/e59
16. Hack M, Breslau N, Weissman B, Aram D, Klein N, Borawski E. Effect of very low birth weight and subnormal head size on cognitive abilities at school age.N Engl J Med. 1991;325:231–237
17. Morley R, Lucas A. Influence of early diet on outcome in preterm infants.Acta Pediatr Suppl. 1994;405:123–126
18. Carlson SE, Werkman SH, Peeples JM. Arachidonic acid status corre-lates with first year growth of preterm infants.Proc Natl Acad Sci U S A. 1993;90:1073–1077