www.earth-syst-dynam.net/7/469/2016/ doi:10.5194/esd-7-469-2016
© Author(s) 2016. CC Attribution 3.0 License.
Geoengineering as a design problem
Ben Kravitz1, Douglas G. MacMartin2,3, Hailong Wang1, and Philip J. Rasch1 1Atmospheric Sciences and Global Change Division, Pacific Northwest National Laboratory,
Richland, WA, USA
2Department of Computing and Mathematical Sciences, California Institute of Technology, Pasadena, CA, USA
3Sibley School of Mechanical and Aerospace Engineering, Cornell University, Ithaca, NY, USA
Correspondence to:B. Kravitz ([email protected])
Received: 6 August 2015 – Published in Earth Syst. Dynam. Discuss.: 8 September 2015 Revised: 18 March 2016 – Accepted: 10 May 2016 – Published: 24 May 2016
Abstract. Understanding the climate impacts of solar geoengineering is essential for evaluating its benefits and risks. Most previous simulations have prescribed a particular strategy and evaluated its modeled effects. Here we turn this approach around by first choosing example climate objectives and then designing a strategy to meet those objectives in climate models.
There are four essential criteria for designing a strategy: (i) an explicit specification of the objectives, (ii) defin-ing what climate forcdefin-ing agents to modify so the objectives are met, (iii) a method for managdefin-ing uncertainties, and (iv) independent verification of the strategy in an evaluation model.
We demonstrate this design perspective through two multi-objective examples. First, changes in Arctic tem-perature and the position of tropical precipitation due to CO2 increases are offset by adjusting high-latitude
insolation in each hemisphere independently. Second, three different latitude-dependent patterns of insolation are modified to offset CO2-induced changes in global mean temperature, interhemispheric temperature
asymme-try, and the Equator-to-pole temperature gradient. In both examples, the “design” and “evaluation” models are state-of-the-art fully coupled atmosphere–ocean general circulation models.
1 Introduction
Geoengineering describes a set of technologies designed to offset some of the effects of anthropogenic climate change by deliberately intervening in the climate system. There are many proposed methods of solargeoengineering (methods of geoengineering that reduce incident shortwave radiation at the surface; all subsequent discussions of geoengineer-ing specifically refer to solar geoengineergeoengineer-ing). Some of the most studied include introducing a layer of reflective sul-fate aerosols into the stratosphere or brightening marine low clouds (e.g., Crutzen, 2006; Latham, 1990; NAS, 2015).
Many of the ongoing efforts in solar geoengineering re-search involve climate model simulations designed to ascer-tain the expected climate effects of various scenarios of geo-engineering (e.g., Kravitz et al., 2011, 2013b, 2015a). Many simulations focus on uniformly reducing solar irradiance or imposing a particular spatial pattern of forcing from
strato-spheric aerosols or cloud brightening. However, the expected climate effects depend not only on the amount of geoengi-neering but also the spatial pattern; both of these are, at least in part, design choices. Furthermore, the objectives of geo-engineering may involve balancing multiple criteria, such as maintaining Arctic temperature without disrupting tropical precipitation (an example we explore below).
As an example, one of the results from geoengineering that is repeatedly discussed is that offsetting the global mean ra-diative forcing from a CO2increase by reducing total solar
irradiance would result in an overcooling of the tropics and an undercooling of the poles (Govindasamy and Caldeira, 2000). This is largely due to the fact that CO2concentration
is more or less evenly distributed in climate models, so CO2
experi-ment G1, in which the radiative forcing from an abrupt qua-drupling of the CO2concentration was offset by solar
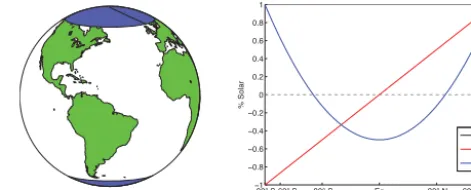
reduc-tion (Kravitz et al., 2011). However, Fig. 1 illustrates that overcooling of the tropics and undercooling of the poles (top panel) is not a foregone conclusion, even if only one degree of freedom is varied – the amount of total solar irradiance reduction. One could easily reduce insolation less than in G1 so that no large region is overcooled (middle panel) or re-duce insolation more than in G1 so that there is no residual warming (bottom panel).
Figure 1 provides a simple illustration that many of the climate effects of geoengineering are design choices, pre-suming the ability to actually impose changes with specific characteristics. As such, statements about the climate effects of geoengineering in general are ill-posed; such statements require the context of specific climate objectives and an ap-proachdesignedto meet them. A handful of studies have ex-plored this idea of meeting climate objectives other than the oft-studied global mean temperature reduction. Ban-Weiss and Caldeira (2010) explored changes in the latitude of the solar geoengineering pattern and found that doing so could better offset the residual temperature changes in a G1-like ex-periment. MacMartin et al. (2013) explored modifying inso-lation by latitude and season; they found that doing so greatly increased the range of achievable climates through insolation reduction, both globally and on a regional basis.
Climate model simulations suggest that many of the pro-posed methods of conducting solar geoengineering are likely to have both commonalities and differences in their climate effects (Crook et al., 2015; Kalidindi et al., 2014; Niemeier et al., 2013). Here we use the common idealized represen-tation of reducing solar irradiance. This has been shown to be similar in global mean near-surface effects to simulations of stratospheric sulfate aerosols (Kalidindi et al., 2014), al-though some global and regional effects, especially those due to stratospheric heating by the aerosols, are likely to dif-fer between the two methods (Ferraro et al., 2014; Niemeier et al., 2013). In the present work, we reduce insolation as a function of latitude; while these exact patterns may not be achievable, the general characteristics of those patterns are broadly consistent with the types of variations that could be achieved via other means of geoengineering (e.g., strato-spheric sulfate aerosols). Augmenting the discussion to other proposed methods of solar geoengineering adds additional degrees of freedom (for example, stratospheric aerosols in-clude altitude and possibly particle composition as additional adjustable parameters), but these methods also include addi-tional complications (e.g., atmospheric circulation imposes constraints on achievable latitudinal dependence). We dis-cuss some of these issues in Sect. 6.
Our primary motivation in this study is to introduce a de-sign perspective that can be used to more systematically eval-uate some of the potentials and limitations of ing. We do this by exploring two examples of geoengineer-ing strategies designed to meet specific, multifaceted goals.
Figure 1.These three panels show that the “canonical” temperature response to offsetting global mean temperature increases from CO2 (an abrupt quadrupling of the CO2 concentration from its
For any strategy, achieving multifaceted goals can be accom-plished via following a certain set of criteria:
1. an explicit definition of specific objectives of geoengi-neering;
2. determination of the particular degrees of freedom to be modified to meet the objectives;
3. a strategy for meeting the objectives in the presence of uncertainty;
4. verification of the designed strategy in a different eval-uation model.
The examples we choose (Sect. 2) are not necessarily indica-tive of any particular objecindica-tive that might be chosen, if there were ever a decision to engage in geoengineering in the fu-ture. Our purpose is simply to illustrate how, given an ob-jective for geoengineering, a strategy to meet that obob-jective might be designed.
Implicitly included in these four criteria is that it is nec-essary to determine the feasibility of the objectives. It may not be possible to achieve all objectives due to physical con-straints on the climate system. Moreover, the space of possi-ble climates may be further narrowed by technological limi-tations. As an example, it is not clear how stratospheric trans-port can be controlled, which may limit the spatial distribu-tion of radiative forcing that is achievable via geoengineering with stratospheric sulfate aerosols. Our analyses inherently include the assumption that the radiative forcing is achiev-able.
In a system in which the relationships between adjustable climate parameters and the desired pattern of radiative forc-ing are well characterized, one could optimize the relative contributions of the parameters such that the desired cli-mate objectives are approxicli-mately met. This was the ap-proach taken by Ban-Weiss and Caldeira (2010) and Mac-Martin et al. (2013), for example. In practice, even indepen-dent of uncertainties in the ability to achieve the desired cli-mate system changes, there are substantial uncertainties in both the radiative forcing exerted by a change in insolation and the climate response to that radiative forcing (Stocker et al., 2013). In addition, the climate response is dependent upon the particular forcing agent; this concept was defined as efficacyby Hansen et al. (2005). Because climate models im-perfectly represent the dynamical behavior of the real climate system, and because climate observations are sparse, many of the uncertainties associated with understanding radiative forcing and climate response are difficult to reduce. There-fore, any deployment of solar geoengineering would require a method of managing these uncertainties to ensure that the chosen objectives of geoengineering are met as well as pos-sible even in the presence of uncertainty.
One method of managing uncertainties is to use explicit feedback, in which geoengineering is regularly adjusted
based on the observed climate state and how far it is from the chosen objectives (Jarvis and Leedal, 2012; MacMartin et al., 2014b). Such techniques are well developed in the field of control theory (see Åström and Murray (2008) for a more thorough explanation). The use of explicit feedback has been demonstrated for several objectives, including reducing to-tal solar irradiance to meet an objective defined in terms of global mean temperature (MacMartin et al., 2014b; Kravitz et al., 2014), reducing total solar irradiance to limit the rate of temperature change (MacMartin et al., 2014a), or inject-ing sulfur dioxide into the Arctic stratosphere to limit sea ice loss (Jackson et al., 2015). All of these previous studies in-volved modifying a single climate system feature (amount of solar geoengineering) to achieve a single climate objective. In all subsequent discussions, we refer to potentially mod-ifiable climate system parameters asdegrees of freedomin achieving climate objectives.
Although these past studies were instrumental in devel-oping applications of explicit feedback for geoengineering, their applicability is limited in that they do not address the potential for multifaceted geoengineering goals. Offsetting multiple independent features of climate change requires modifying multiple simultaneous degrees of freedom. Ensur-ing that those climate objectives are met in the presence of uncertainty requires explicit feedback. The present study is the first to combine these two aspects, illustrating some of the potentials and limitations associated with designing geo-engineering strategies.
a demonstration in which the strategy was designed and im-plemented in the same model. If there were ever a deploy-ment of geoengineering, the design process would presum-ably incorporate information from a wide range of climate models.
We illustrate the design approach through two examples: one regionally focused and the other globally focused, de-scribed in Sect. 2. Section 3 describes in detail the procedure for designing a feedback algorithm, including a discussion of “system identification” simulations used to estimate the relevant dynamics of the design model. The results from the design and evaluation models for the two examples are dis-cussed in Sects. 4 and 5. Section 6 includes a discussion of the present study, including some of the differences in this process if one were studying stratospheric aerosols or ma-rine cloud brightening rather than using idealized latitude-dependent solar reductions.
2 Strategy
Here we illustrate the nature of geoengineering as a design problem through two examples, which we will call 2×2 and 3×3, indicating the number of inputs (degrees of free-dom that are modified) and outputs (climate objectives). The first of these examples focuses on countering Arctic warm-ing that would occur under CO2 increases (a regional
ob-jective) while seeking to minimize shifts in tropical precip-itation that would occur due to both CO2 increases and if
only high-latitude Northern Hemisphere insolation was ad-justed (Haywood et al., 2013). The second design problem considers a more global perspective on geoengineering, but rather than only considering global mean temperature, the feedback design compensates for both the relative overcool-ing of the tropics (or undercoolovercool-ing of the poles) apparent in Fig. 1a and the temperature difference between the two hemispheres that can in turn lead to shifts in tropical pre-cipitation (largely characterized by the Intertropical Conver-gence Zone, or ITCZ). In both cases we evaluate strategies in the presence of a 1 % yr−1increase in the CO2concentration
(abbreviated 1pctCO2).
The 2×2 case is motivated by Arctic warming, which is a strong driver of Arctic sea ice loss (Serreze et al., 2007), per-mafrost thaw (e.g., Schaefer et al., 2011), and other impacts (e.g., Bintanja and Selten, 2014). Arctic insolation reduc-tions could offset some Arctic warming (Caldeira and Wood, 2008; Robock et al., 2008; MacCracken et al., 2013; Tilmes et al., 2014; Jackson et al., 2015), but only cooling the Arc-tic would tend to shift the ITCZ toward the warmer hemi-sphere (e.g., Broccoli et al., 2006). Concomitant changes in Antarctic insolation are unlikely to substantially affect Arc-tic temperature but could be used to offset the changes in tropical precipitation caused by CO2 and Arctic insolation
reductions.
90° S 60° S 30° S Eq 30° N 60° N 90° N −1
−0.8 −0.6 −0.4 −0.2 0 0.2 0.4 0.6 0.8 1
% Solar
L
0
L
1
L
2
Figure 2.The degrees of freedom that were modified in the two cases considered here, referred to as 2×2 (left panel) and 3×3 (right panel). In the 2×2 case, Arctic and Antarctic insolation (shaded regions) are modified to minimize changes in Arctic tem-perature and the latitude of the precipitation centroid due to increas-ing CO2(see Sect. 2 for details). In the 3×3 case, the three patterns
of insolation reduction illustrated here are modified to minimize changes in global mean temperature, the inter-hemispheric temper-ature gradient, and the Equator-to-pole tempertemper-ature gradient caused by increasing CO2(see Sect. 2).
More concretely, the two inputs in the 2×2 system are changes in Arctic insolation and Antarctic insolation (Fig. 2a), where we choose insolation reductions from 60– 90◦N for the former and 60–90◦S for the latter. (This choice is neither “optimal” in any sense nor necessarily achievable, but it is sufficient to illustrate the design strategy.) One of the outputs is change in Arctic temperature, defined as an area-weighted average of surface air temperature in the re-gion spanning the Arctic (66 2/3–90◦N); this is affected by changes in Arctic insolation and is relatively unaffected by changes in Antarctic insolation. The other output character-izes the latitudinal displacement of zonally averaged precip-itationP by defining a precipitation centroid (χ):
χ≈
π/2
R
−π/2
P·ψdA
π/2
R
−π/2
PdA
, (1)
whereψ is latitude (integration over [−π
2,
π
2] is the entire
latitude range of 90◦S to 90◦N).Ais area-weighted latitude, i.e.,
dA=cos(ψ)dψ⇒A=
π/2
Z
−π/2
cos(ψ)dψ=2.
A quantitative representation of the dynamic relationships between the inputs and outputs, known as theinfluence ma-trix, is given in Sect. 3.6.
The 3×3 case considers a more global objective. An in-crease in CO2would increase global mean temperature
(ab-breviatedT0). The Northern Hemisphere would warm more
et al., 2015), which influences ITCZ location and tropical precipitation patterns (e.g., Marshall et al., 2014). Also, be-cause of the various mechanisms associated with poleward heat transport and polar amplification (e.g., Holland and Bitz, 2003), high latitudes would warm more than low latitudes. Reducing total solar irradiance could offset changes in T0,
but due to the different latitudinal patterns of CO2
warm-ing and insolation reduction, there would still be residual changes in both the differential Northern vs. Southern Hemi-sphere warming and the Equator-to-pole temperature gradi-ent (Fig. 1; see also Caldeira and Wood, 2008; Kravitz et al., 2013a). However, these residual patterns could be offset by choosing different patterns of insolation reduction beyond a globally uniform reduction.
As metrics for these, we define T1 andT2 as the linear and quadratic meridional dependence of zonal-mean temper-atureT(ψ):
T0=
1
A
π/2
Z
−π/2
T(ψ)dA
T1=
1
A
π/2
Z
−π/2
T(ψ) sinψdA
T2=
1
A
π/2
Z
−π/2
T(ψ)1 2(3sin
2ψ−1)dA. (2)
These equations are defined by the projection ofT(ψ) onto the first three Legendre polynomial functions (constant, lin-ear, and quadratic) of sin(ψ), abbreviated L0, L1, and L2
(Fig. 2b):
L0=1
L1=sin(ψ)
L2=
1 2(3sin
2(ψ)−1). (3)
These correspond to the first three terms of a polynomial expansion of the zonal-mean temperature. Similarly, we de-fine the inputs as a reduction in insolation with latitudinal dependence L0, L1, and L2; these are similar basis
func-tions to those used by Ban-Weiss and Caldeira (2010) and MacMartin et al. (2013). For simplicity, we subsequently re-fer to the three patterns of solar reduction given in Fig. 2b as L0,L1, and L2. Additional terms could be considered, but there is a clear physical mechanism underlying the influ-ence between these three inputs and three outputs; we discuss the importance of this physical linkage in Sect. 6. Note that changes inL0were conducted by all models participating in GeoMIP experiment G1 described previously (Kravitz et al., 2011). The functions in Eq. (3) are orthogonal, which will be useful in designing feedback strategies (discussed further in Sect. 3.4).
All of these simulations are conducted using the method of explicit feedback, as described by MacMartin et al. (2014b) and Kravitz et al. (2014, 2015b). Section 3 below is devoted to a discussion of how one determines a feedback algorithm that will effectively meet these goals.
3 Designing a multivariate feedback strategy
3.1 Overview and motivation
While the previous section introduced the idea of choosing multiple spatial degrees of freedom to balance multiple cri-teria, this section is concerned with how to choose the am-plitude of each of these degrees of freedomas a function of timeso that the desired climate objectives are met despite uncertainty. With perfect climate models, this process would be straightforward, but in actuality, the amount of each de-gree of freedom would need to be continually adjusted in response to observations, increasing or decreasing as appro-priate to avoid under- or overcompensating relative to spec-ified goals. This adjustment in response to observations is a feedback process, and is an essential element of any plausi-ble geoengineering deployment strategy. With proper design, this adjustment process will converge to the chosen objec-tives for a wide range of uncertainty in the expected climate response.
Feedback design (design of the explicit feedback algo-rithm) requires some information about the system response to an input. This information is provided by the design model, and feedback is then used to bridge the gap between the modeled response and the real-world response if this de-sign were implemented.
3.2 Dynamic modeling for feedback design
The feedback algorithm defines the rule by which the “in-put” (e.g., solar reduction) is adjusted in response to obser-vations of the “output” (e.g., difference between measured and desired global mean temperature). The design of this algorithm starts with a dynamic model of the input–output behavior of the system. This dynamic model does not de-scribe how the entire climate state responds to a perturbation in the input signal but specifically the response of the output signal. We use the termdynamicto indicate that this model includes transient behavior and not just the equilibrium re-sponse. We assume that this process can be reasonably ap-proximated by a linear relationship, and that nonlinear effects are small enough that they are managed by the feedback algo-rithm, which provides robustness to uncertainty. As we will show later, this assumption is not detrimental to meeting our chosen objectives, although it is potentially problematic for other objectives (Sect. 6).
A general linear dynamic input–output relationship can be described by a convolution equation in the time domain. However, many of the expressions we wish to evaluate are greatly simplified when expressed in the frequency domain, because convolution is replaced by multiplication, and cou-pled differential equations in the time domain become alge-braic relationships in the frequency domain. A time-domain equationf(t), wheretis time, can be represented in the fre-quency domain via the Laplace transform:
F(s)= ∞ Z
0
e−stf(t)dt, (4)
wheres=i ωandωis (angular) frequency.
In illustrating feedback design guidelines in the next sub-section, it is convenient to consider a first-order linear (i.e., first-order autoregressive) description of the input–output re-lationship, including a time delayD. This is the simplest non-trivial dynamical system. Although we would not necessar-ily expect this system to match the dynamics of the actual climate system at all frequencies, it is sufficient for illustra-tion. Withy(t) as the climate output signal (e.g., temperature change) andu(t) as the input signal (e.g., solar reduction),
τy˙= −y(t)+βu(t−D)+d(t) (5)
for some coefficientβ, whereτ is ane-folding time constant (as used here, in years) and y˙ indicates the time derivative of y. Including an explicit time delay ofD years is neces-sary here as our simulations adjust forcing for the next year based on the average climate output over the previous year; each of these choices contributes on average a half-year de-lay (MacMartin et al., 2014b). In addition to the response to u(t), the signal y(t) will also include effects from both natural variability and anthropogenic climate change; these are captured above through the exogenous input d(t). For
the purposes of characterizing the input–output response, we eliminate sources of variability in output that are not asso-ciated with the input (i.e., noise) by settingd=0. Then for an abrupt change in the inputu(t) from zero to one at time
t=0,yu(t) (where the subscript indicates that noise is not included) fort≥Dis given by
yu(t+D)=β(1−e−t /τ), (6)
wherey(0)=0.
Taking the Laplace transform of Eq. (6) and dividing by the Laplace transform of the inputu(t), the responseyu to the inputucan equivalently be characterized in the frequency domain asyu(s)=G(s)u(s) through the transfer function
G(s)=e−sD β
1+sτ, (7)
where againd(s) is omitted in this expression, as the transfer function describes only the changes in output that are linearly related to changes in input.
At any frequencyω, the complex numberG(s)=G(i ω) can be described by its magnitude kG(i ω)k and phase
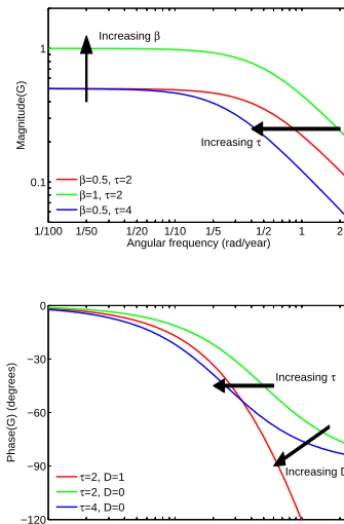
φ(G(i ω))=tan−1(Im(G)/Re(G)). Note that because ||e−sD|| =1, the time delay adds phase lag but does not change the magnitude. The magnitude and phase ofG(i ω) are shown for several parameter values in Fig. 3, providing a graphical representation of the frequency response of the transfer function (also called a Bode plot). Red lines are roughly consistent with the relationship identified between Arctic insolation and Arctic temperature in the 2×2 design example that follows in subsequent sections. Different values of β scale the magnitude at all frequencies but do not change the phase. The time constantτ determines the range of frequencies over which the system response is quasi-static(roughly the same magnitude as the equilibrium response, indicated by the flat part of the curves in Fig. 3).
τ is an e-folding timescale, so the quasi-static response is approximately characterized by all frequencies lower than 1/(3τ) rad yr−1. The phase contribution from the term 1+s τ in the denominator transitions from 0 to−90◦, con-tributing−45◦at frequencyω=1/τ. Time delay contributes substantial phase lag at high frequencies.
A semi-infinite diffusion model has been shown by MacMynowski et al. (2011) to more accurately capture the response of the global mean temperature to a uniform solar reduction in the HadCM3L general circulation model; this information was used by MacMartin et al. (2014b) to design feedback strategies. The corresponding transfer function is
Gd=e−sD βd
1+(sτd)1/2, (8)
where the subscript “d” indicates the diffusion model. Fig-ure 4 compares the first-order linear model withβ=0.447,
1/100 1/50 1/20 1/10 1/5 1/2 1 2 0.1
1
Magnitude(G)
Angular frequency (rad/year) Increasing β
Increasing τ
β=0.5, τ=2
β=1, τ=2
β=0.5, τ=4
1/100 1/50 1/20 1/10 1/5 1/2 1 2 −120
−90 −60 −30 0
Angular frequency (rad/year)
Phase(G) (degrees)
Increasing D Increasing τ
τ=2, D=1
τ=2, D=0
τ=4, D=0
Figure 3. Bode plot showing the frequency response of the
transfer function G(s)=e−sDβ/(1+s τ) for various values of
β, τ, and D. The top panel shows the magnitude of the fre-quency response ||G(s)||, and the bottom panel shows the phase
φ=tan−1(Im(G(s))/Re(G(s))).βonly affects magnitude,Donly affects phase, andτ affects both. The red lines approximately cor-respond to the estimated response of Arctic temperature to Arctic insolation reduction in the 2×2 design example.
where we chooseβd=0.732,τd=4.063, andD=1 to give the same magnitude and phase of the transfer function at
ω=0.2 rad yr−1. The value ofβd=0.732 corresponds to an
equilibrium climate sensitivity of 2.71◦C, which is simi-lar to the climate sensitivity of HadCM3L (MacMynowski et al., 2011). A value of τ=4.063 years corresponds to a rise time to 1/e of the equilibrium value of 6.339 years (MacMynowski et al., 2011). This is somewhat less than the value obtained by MacMynowski et al. (2011) (Fig. 3), but this value is not unreasonable in characterizing the fre-quency response of climate models in general (Caldeira and Myhrvold, 2013). As would be expected from Eqs. (7) and (8), the first-order linear model with no time delay asymptotes to a phase lag of 90◦as ω→ ∞, and the semi-infinite diffusion model asymptotes to 45◦. For reasons that will be clear in the next subsection, designing feedback strategies does not require knowledge of the system dynam-ics at all frequencies. Figure 4 illustrates that there are multi-ple possible system representations that could have the same transfer function magnitude and phase at a single frequency.
1/100 1/50 1/20 1/10 1/5 1/2 1 0.1
1
Angular frequency (rad/year)
Magnitude(G)
ARX(1) SD
1/100 1/50 1/20 1/10 1/5 1/2 1 −180
−150 −120 −90 −60 −30 0
Angular frequency (rad/year)
Phase(G) (degrees)
Figure 4.Bode plot (as in Fig. 3) comparing the first-order linear model (ARX(1); Eq. 7) and a semi-infinite diffusion model (SD; Eq. 8). Values for ARX(1) areβ=0.447,τ=1.946, andD=1.0. Values for SD areβd=0.732,τd=4.063, andD=1.0. Values are
chosen so that the magnitude and phase are identical for both mod-els atω=0.2 rad yr−1.
3.3 Single-input, single-output (SISO) feedback design
We now consider the design of the feedback algorithm, using the model in Eq. (7) for illustration. As was done by Mac-Martin et al. (2014b) and Kravitz et al. (2014, 2015b), we choose proportional–integral control. This choice (or its aug-mented counterpart of proportional–integral–derivative con-trol) is ubiquitous in control theory and is a standard “first attempt” when designing a feedback algorithm. As we will show, proportional–integral control is sufficient for our pur-poses. In the continuous time domain, proportional–integral control is represented as
u(t)= −kpy(t)−ki
t Z
0
y(σ)dσ, (9)
wherekp andki are the proportional and integral gains,
re-spectively, collectively called control gains. The negative sign associated withy(t) is included by convention.y(t) rep-resents the departure of the system state (e.g., temperature) from the reference point at any given time, that is, the goal is to minimizey. Taking the Laplace transform, this can be represented in the frequency domain asu(s)= −K(s)y(s) through the transfer function
K(s)=kp+ki/s=
kps+ki
s . (10)
func-tion) describes the portion of the outputy(s) that is related to the input u(s), andd(s) is the noise, or the part ofy(s) that is due to sources other than the inputu(s) (e.g., climate change and natural variability). The feedback algorithm is described byu(s)= −K(s)y(s). In the absence of feedback (K(s)=0),y=d. With feedback,
y(s)= 1
1+G(s)K(s)d(s). (11)
The characteristics of the system with feedback thus depend only on the productG(s)K(s). This product is referred to as theloop transfer function; with the simple model in Eq. (7) and proportional–integral control, its frequency response is the product of Eqs. (7) and (10):
G(s)K(s)=e−Ds β
1+sτ ·
kps+ki
s . (12)
These two equations illustrate a substantial advantage of working in the frequency domain, as the equivalent time-domain formulation would be much more complicated and would provide less insight.
There are three critical observations. (1) At very low fre-quencies (ωωgc, where ωgc is a fixed value defined
be-low),G(iω)K(iω) is large for any nonzeroG(s). This means that feedback achieves the goal of maintaining y(s) small and, further, that it is not necessary to know the dynamics of the climate at low frequencies to successfully design a feedback algorithm. (2) At very high frequencies (ωωgc),
G(iω)K(iω) is small, and thus y(s) is unchanged by the feedback; again, it is not necessary to know the dynamics of the climate at very high frequencies because there is no significant input signal at high frequencies. (3) If at some fre-quencyωwe hadG(iω)K(iω)= −1, then the system would be unstable (an unbounded response to a disturbance at that precise frequency), and ifG(iω)K(iω) is close to−1 at some frequency, then the coupled feedback system results in am-plifyingd(s) at that frequency. The key take-away from this final observation is thatK(s) should be designed to manage the characteristics of the loop transfer function at frequencies where the magnitude ofG(iω)K(iω) is close to unity.
The frequency where the magnitude kG(iω)K(iω)k =1 is called the loop crossover frequency, denoted ωgc. This is approximately equal to the bandwidth of the system, which describes how rapidly the feedback loop responds to differences between the observed and desired states, with 1/ωgc being roughly the time constant for system conver-gence (see Fig. 7). At this frequency, the distance from the point−1 in the complex plane can be characterized by the phase margin, defined as the difference between the phase ofG(iωgc)K(iωgc) and−180◦, which we denote8pm; this
quantity approximately characterizes the closest distance be-tweenG(iω)K(iω) and−1 for any frequency. Small phase margin implies a lack of robustness to uncertainty in the modelG(s). Note that since the feedback operates on the ob-served (or simulated in our case) climate signal, it will act
not only on the climate response to anthropogenic green-house gases but also on natural climate variability. Small phase margin also implies high amplification of natural cli-mate variability at frequencies nearωgc(see Eq. 11), with
os-cillatory “ringing” in the time-domain response (Fig. 7; also see MacMartin et al., 2014b). Phase margin thus gives an in-dication of both how robust the system is to modeling errors and how much amplification there is of natural variability.
With proportional–integral control, the control gains ki
andkp are design parameters; their choice is related to the
bandwidth and the phase margin. A higher choice of band-width (faster convergence time) typically makes it more diffi-cult to achieve a desired phase margin. Feedback design thus inherently involves trade-offs. Somewhat arbitrarily, we aim for a convergence time constant of roughly 5 years, corre-sponding toωgc≈0.2 rad yr−1, which is chosen as a reason-able trade-off to give fast enough convergence without exces-sive response to natural variability nor unacceptable robust-ness. We discuss the trade-offs in more detail at the end of this subsection.
We now outline a process for determining choices forkp
andki that yield convergence to the desired climate
objec-tives for the system despite uncertainty in G(s). For sev-eral choices of ki and kp, the Bode plots in Fig. 5
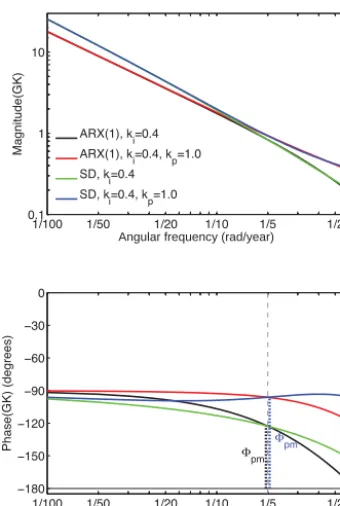
pro-vide graphical representations of the frequency response of the loop transfer function, characterized by the magni-tude (upper panel) and phase (lower panel) of the com-plex numberG(iω)K(iω) as a function of frequencyω. The loop crossover frequencyωgc≈0.2 rad yr−1is indicated by dashed lines in Fig. 5.
First consider a pure integral control (kp=0, black line in Fig. 5). At low frequencies (ω1 rad yr−1), pure integral
control means thatG(s)K(s) is large, so the feedback loop results in good “performance” in the sense of the chosen vari-able meeting its specified objective. Higher values ofkilead
to higher bandwidth (larger values ofωgc) and faster
conver-gence (smaller values of 1/ωgc). However, the integral term
adds 90◦phase lag from the phase of 1/(i ω). With pure in-tegral control, the phase margin can thus be poor due to the combined phase lag from the time delay and the system dy-namics (recall that the factorτ s+1 in the denominator leads to 90◦phase lag at high frequencies).
Adding the proportional gainkp (red line in Fig. 5) in-creases the phase margin. For example, from Eq. (12), choos-ingkp=τ kiresults in
G(s)K(s)=kiβ1 se
−Ds. (13)
With no delay (D=0), this would have 90◦ phase mar-gin, no amplification of natural climate variability, and a bandwidth ωgc=kiβ. As noted previously, to achieve a
convergence time constant of roughly 5 years, we choose
ωgc≈0.2 rad yr−1and thus choose ki=0.2/β. This choice
for ki and kp corresponds to the blue lines in Fig. 5.
mar-1/100 1/50 1/20 1/10 1/5 1/2 0.1
1 10
Magnitude(GK)
Angular frequency (rad/year)
ARX(1), k
i=0.4
ARX(1), k
i=0.4, kp=1.0
SD, ki=0.4
SD, ki=0.4, kp=1.0
1/100 1/50 1/20 1/10 1/5 1/2
−180 −150 −120 −90 −60 −30 0
Angular frequency (rad/year)
Phase(GK) (degrees) Φ
pm
Φpm
Figure 5.As in Fig. 4 but for the loop transfer functionG(s)K(s) for values of control gainskiandkpused in the 2×2 case. Plots
are shown for the first-order linear model (ARX(1)) and the semi-infinite diffusion model (SD). Grey dashed lines indicate a loop crossover frequency ofωgc=0.2, corresponding to the frequency
where||GK|| =1.8pmdenotes the phase margin (Sect. 3.3; the distance between the curves and a phase lag of 180◦) for two cases with and without proportional gainkp. Pure integral gain adds 90◦ of phase lag, which can be partially compensated for by adding pro-portional gain.
gin ofπ/2−ωgcDor 79◦. Decreasing the proportional gain (kp< τ ki) would reduce the response to high-frequency cli-mate variability, making the signals u(t) less “noisy”, but would also reduce the phase margin.
We now provide a more detailed recipe for deter-mining control gains for a particular application. Let
Mgc= ||G(i ωgc)||and8gc=φ(G(i ωgc)) be the magnitude
and phase of the system at frequencyωgcrad yr−1(note that 8gc<0, as the output lags the input). The additional phase
added by proportional–integral control at frequencyωgcis
8p=tan−1 Im K iωgc
Re K iωgc
!
=tan−1
− ki
ωgckp
= −π
2 +tan −1
ω
gckp ki
. (14)
For pure integral control (kp=0), 8p= −π/2, which is
the previously discussed addition of 90◦ of phase lag from the integral term. Addition of a nonzero propor-tional gain adds phase lead to this term. Let 8pm be
the desired phase margin (a choice). Then, by definition,
8pm=8gc−π/2+tan−1(ωgckp/ki)+π. Then
kp= ki
ωgc
tan8pm−π 2 −8gc
. (15)
We choosekisuch that the loop transfer function gain is unity
atωgc, i.e., 1= ||G(iωgc)K(iωgc)|| =Mgc
q
k2
p +(ki/ωgc)2.
In solving this, the desired value ofkiis then
ki= ωgc
Mgc
r
1+tan28pm−π
2 −8gc
. (16)
Then, using Eq. (15),kpis also determined.
Note that Eqs. (15) and (16) only require information about the magnitude and phase at the loop crossover fre-quencyωgc. This means that we can design “system iden-tification” simulations (Sect. 3.5) in our design model using a sinusoidal input signal at the desired crossover frequency to estimate the magnitude and phase of the input–output re-sponse at just that single frequency. This is also the reason why the first-order linear model is a sufficient description of system dynamics for designing the feedback algorithm, as no assumption needs to be made regarding the dynamics at fre-quencies away fromωgc. A semi-infinite diffusion model (for
example) that has the same magnitude and phase atωgcwill
require the same feedback gains to achieve the same band-width and phase margin. As such, knowing the model form is not essential for designing the feedback algorithm.
However, the model form does influence characteristics such as amplification of natural variability at frequencies away fromωgcand convergence behavior. Figure 6 shows the sensitivity functions of the first-order linear and semi-infinite diffusion models, defined as
S(s)= 1
1+G(s)K(s). (17)
1/1000 1/50 1/20 1/10 1/5 1/2 1 2 0.2
0.4 0.6 0.8 1 1.2
Sensitivity
Amplification
Attenuation
Angular frequency (rad/year)
ARX(1) SD
Figure 6. Magnitude of the sensitivity function
S(s)=(1+G(s)K(s))−1for the first-order linear model (ARX(1)) and semi-infinite diffusion model (SD). Model parameters are the same as in Figs. 4 and 5, and K(s)=1.0+0.4/s. Black horizontal line indicates||S(s)|| =1; values above this line indicate amplification at that frequency, and values below this line indi-cate attenuation. Grey vertical line indiindi-cates the loop crossover frequencyωgc=0.2 rad yr−1.
of roughly 1/ωgc. Knowledge of the system response at this
one frequency is thus sufficient for understanding the time-domain convergence in response to differences between the desired and actual climate outcomes. This figure illustrates how little information is actually needed about the system to enable design of a feedback strategy that converges. Of course, in any actual deployment, it would be preferable to estimate the full frequency-dependent input–output response from climate models in order to fully characterize the ex-pected behavior. Understanding both climate system natural variability and how the imposed geoengineering affects dif-ferent modes of variability is particularly important for detec-tion and attribudetec-tion of the climate effects of geoengineering. Trade-offs between convergence timescale and amplifica-tion of natural variability are choices in designing a feedback algorithm. Higher bandwidth leads to faster convergence and tighter management of the specified climate objectives. How-ever, at higher frequencies, the system response has greater phase lag (see Fig. 5), and thus a higher bandwidth makes it more difficult to achieve a desired phase margin. Typically, in engineering applications, a phase margin of 60◦ is con-sidered sufficient to avoid excessive amplification of natural variability (this gives ||S(iωgc)|| =1, though ||S(iω)||may exceed unity at other frequencies). The other reason for en-suring adequate phase margin is that the estimated dynam-ics of the input–output response in the design model may not match the actual dynamics (or here, the dynamics of the evaluation model). We also have additional error here in es-timating the design model response because of the influence of natural variability for the relatively short simulations used.
0 5 10 15 20
0 0.1 0.2 0.3 0.4 0.5
Time (years)
Response (°C)
ARX(1) SD
Figure 7.Time-domain response of the first-order linear (ARX(1); Eq. 6) and the semi-infinite diffusion model (SD; inverse Laplace transform of Eq. 8) due to a step change in radiative forcing at
t=1 year. Parameter values for the models are the same as in the text and the caption of Fig. 4. Dashed lines show the open-loop re-sponse, and solid lines show the closed-loop response withki=0.4
andkp=1.0.
For these reasons, phase margins larger than 60◦are useful. A third consideration not noted earlier is that of the response of the input signaluto natural variability:
y(s)=S(s)d(s)u(s)= −K(s)y(s)⇒u(s)= −K(s)S(s)d(s).
Noting thatS(i ω) is always near unity at high frequencies, the response of the input signal to natural variability is deter-mined byK(s) at high frequencies. If a proportional–integral controller is used, thenK(s)≈kpat high frequencies. Hence,
increasing kp to improve phase margin comes at a cost of
the resulting input signal responding to high-frequency natu-ral variability, that is, a “noisy” year-to-year variation in the amount of geoengineering. We do not claim that our choices herein give the best trade-off between these various factors, although we have endeavored to choose reasonable values.
3.4 Multi-input, multi-output (MIMO) feedback design
The discussion thus far has focused on a input, single-output (SISO) feedback algorithm case. However, both of our design examples (Sect. 2) are multivariate, that is,y andu
are vectors related by a matrix-valued transfer functionG(s). In both examples, the dimensions ofy andu are the same so thatG(s) is a square matrix. It is also essential thatG(s) be of full rank, as otherwise there would be no choice of inpututhat could simultaneously drive every output inyto its desired value.
coupling is ignored. A third, more general case that is rele-vant to both of our design examples is whereG(s) is approx-imately triangular. For example, while high-latitude North-ern Hemisphere insolation reduction influences both Arc-tic temperature and the precipitation centroid, high-latitude Southern Hemisphere insolation reduction only has a signif-icant influence on the precipitation centroid, and hence this input–output system is roughly triangular. Note that while all complex-valued square matrices are triangularizable (e.g., by Gaussian elimination), the transformation for arbitraryG(s) will in general be frequency-dependent, and the ability to tri-angularizeG(s) may not necessarily be useful. IfG(s) is not nearly triangular nor readily triangularizable, then more com-plicated feedback design approaches will be required than are described herein.
As an illustrative example of how to design a multivariate feedback algorithm, we consider the following 3×3 system in which the influence matrixMis triangular:
y1 y2 y3
=
m11 0 0
m21 m22 0
m31 m32 m33
u1 u2 u3
. (18)
Although notation is omitted, all entries in Eq. (18) are frequency-dependent. From this representation, we note that
y1=m11u1– i.e.,y1is only influenced by changes in a single input. Therefore, designing a feedback strategy to converge to a desired value fory1only requires adjustments of a
sin-gle input, using observations of a sinsin-gle output (Sect. 3.3). Next, y2=m21u1+m22u2. However, u1 is already
deter-mined by the previous relationship. One could adjustu2only
in response to changes in y2, but this neglects the known
information about the effect of u1 ony2. A better strategy
is to choose u2= −(m21/m22)u1−k(y2), where the
feed-back function k(y) is again a SISO relationship: u2 both responds to observed changes in y2 and “corrects” for an-ticipated changes in y2 that are caused by u1. Similarly,
y3=m31u1+m32u2+m33u3, where u1 and u2 have al-ready been determined. Therefore, the problem of multiple-input, multiple-output (MIMO) feedback can be reduced to a set of SISO algorithms. This procedure is calledsequential loop closure.
3.5 System identification
As was mentioned in Sect. 3.1, the goal ofsystem identifica-tionis to estimate the transfer function matrixG(s) that de-scribes the linear frequency-dependent relationship between the vector of inputs uand vector of outputs y sufficiently well to design a feedback algorithm and characterize its ex-pected behavior. As noted before, the formy(s)=G(s)u(s) assumes that any nonlinearities (higher-order terms in the Taylor expansion) are sufficiently small that they do not present significant difficulties for feedback convergence. The matrix G(s) is estimated in the design model by introduc-ing a signalu(t) and observingy(t). This can be done
sep-arately for each input signal, and the estimated responses of the outputs to those inputs is then determined. There are sev-eral possible choices of input signal that could be useful in characterizing the dynamic behavior of the system.
A step input perturbation is quite common in climate sci-ence, e.g., the abrupt4xCO2 simulation in CMIP5 (Taylor et al., 2012), in which the CO2 concentration is abruptly
quadrupled from its preindustrial value. While these have been used to estimate system dynamics (e.g., Caldeira and Myhrvold, 2013), one limitation is that the input signal is heavily weighted towards low frequencies: the Laplace trans-form of a step input isH(s)=1/s. While this input contains information about all frequencies, the signal-to-noise ratio can be poor at higher frequencies and may require averaging multiple ensemble members.
An alternative is to use single-frequency sinusoidal input signals, as was done by MacMynowski et al. (2011). Evalu-ating the response to a broad range of input frequencies can be computationally expensive. However, as was discussed in Sect. 3.3, a feedback algorithm can be designed with a char-acterization of the system response at a single frequency. If the system is approximately linear, then after transient sys-tem behavior subsides, the outputy(t) will also be sinusoidal at the same frequency. This typically requires two full peri-ods to be simulated; using the example ofωgc=0.2 rad yr−1
as in Sect. 3.3 would require a (2) (2π/0.2)≈63-year simu-lation to characterize the system response at that single fre-quency. Then choosing gainskp andki so that the desired loop crossover frequency and phase margin are obtained re-quires two pieces of information: the magnitude ofyrelative to the inputuand the phase shift betweeny andu. If a first-order response is assumed, the parametersβandτin Eq. (7) can be determined, although this is not strictly necessary to design a feedback algorithm.
Another alternative is to input a band-limited signal, which is useful for characterizing system behavior over a small range of frequencies; this can be helpful if the different input–output relationships have different timescales of re-sponse. This method has an advantage over step-response simulations, in that the input signal is not heavily weighted toward some frequencies at the expense of others. This has a disadvantage as compared to sinusoidal inputs, in that the input signal is more distributed, resulting in lower signal-to-noise ratios. If the loop crossover frequency falls within the quasi-static response of the system, then a sinusoidal input and a band-limited input will yield similar information.
0 10 20 30 −7
−6 −5 −4 −3 −2 −1 0 1
Change in Arctic temperature (K)
Step change in Arctic insolation
Year
2 % 4 % 8 %
12 %
Exp (τ=2.910)
0 10 20 30
−1.5 −1 −0.5 0 0.5 1 1.5 2
Change in Arctic temperature (K)
Step change in Antarctic insolation
Year
0 10 20 30
−0.8 −0.6 −0.4 −0.2 0 0.2
Change in mean lat of precip (degrees)
Step change in Arctic insolation
Year
0 10 20 30
−0.3 −0.2 −0.1 0 0.1 0.2 0.3 0.4
Change in mean lat of precip (degrees)
Step change in Antarctic insolation
Year
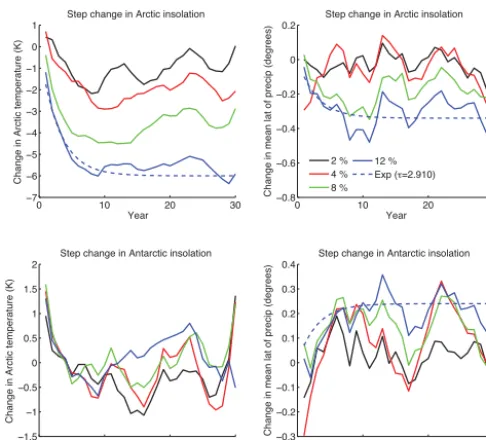
Figure 8. Step responses for the 2×2 design case. Step pertur-bations in the Arctic (top row panels) and Antarctic (bottom row panels) were 2, 4, 8, and 12 % of total solar irradiance in those re-gions. Performing a best fit with an exponential function (Eq. 6) to the 12 % step-response results yieldsβ=0.5 andτ=2.410, plus a half year of time delay due to annual averaging.
σM(iω)≈ [1/Z(ω)]||G(iω)||
σφ(iω)≈tan−1[1/Z(ω)]. (19)
The SNR can be estimated from a control run with no in-put, or for a sufficiently long time series can be estimated as in MacMartin and Tziperman (2014) from the coherence
γ2=Z2/(1+Z2) (the fraction of the total output variance that is associated with the input). For single-sinusoid input signals used below, we estimate the SNR at the frequency of the input signal from the output variance averaged over nearby frequencies. With two full periods atωgcsimulated,
projecting the output time series onto sinusoids atωgc/2 and
3ωgc/2 gives estimates for how large the output signal might
have been in the absence of the input signal.
3.6 2×2 design example
Our characterization of the 2×2 system begins with a series of step response simulations and is followed by a set of sinu-soidal response simulations. This is sufficient for us to design a control algorithm that sufficiently meets the prescribed cli-mate objectives.
For the step response simulations, beginning from a sta-ble preindustrial control run, insolation over the Arctic or Antarctic was abruptly reduced by 2, 4, 8, and 12 %; the re-sults from these simulations are summarized in Fig. 8. The choice of 12 % was informed by simulations performed by MacCracken et al. (2013), and lower magnitudes were
cho-2 % 4 % 8 % 12 %
−1.5 −1.4 −1.3 −1.2 −1.1 −1 −0.9
Mean latitude of precip (degrees)
R2=0.97
R2=0.98
Control NH SH
Figure 9. Linear regression over the precipitation centroid (χ; Eq. 1) results from all of the step response simulations. Regressions were performed over the average values ofχ over years 11–30 of simulation.χis approximately linear with perturbation amplitude.
sen to test linearity of the climate response and the noise threshold. Linearity is illustrated in Fig. 9, showing that the precipitation centroid (Eq. 1) is a robust metric for our pur-poses.
These simulations can already inform the influence ma-trix for this particular case. Reductions in Arctic insolation reduce Arctic temperature and shift tropical precipitation southward. Reductions in Antarctic insolation shift tropical precipitation northward but do not discernibly affect Arctic temperatures. Therefore, using notation to suppress any po-tential time or frequency dependence, we can write the influ-ence matrix as
TArctic χ
=
λ 0
−ξ η
SArctic SAntarctic
, (20)
whereTArcticdenotes Arctic temperature change;χdenotes
shifts in the meridional centroid of zonal-mean precipitation (Eq. 1; positive northward);SArctic denotes adjustments in
Arctic insolation;SAntarcticdenotes adjustments in Antarctic
insolation; andλ,ξ, andηare positive functions of, as of yet, undetermined form. As noted above, this particular system is inherently triangular.
The step-response results can be fit to the functional form in Eq. (6). However, the exponential fits in Fig. 8 are rela-tively poor and can only be done for the highest amplitude of step response, partly due to a large amount of high-frequency variability. This is an inherent problem with step response simulations, as the input signal contains nonzero content at all frequencies. Nevertheless, they are useful in that they pro-vide confidence that a first-order linear model captures the system behavior sufficiently to design a control algorithm.
ampli-tude appeared to give a good signal, and the step response did not show any evidence of substantial nonlinearity.
Figure 10 shows the sinusoidal response of the system for an input signal with a period of 10π years, corresponding to
ω=0.2 rad yr−1. From these simulations, the influence ma-trix can be computed via the amplitude ratio (the gain ratio of the output signal to the input signal) and the phase shift (the difference in phase lag between the output and input signals). IfG(s) is the 2×2 transfer function representing the input– output relationships in the system, then the results from the sinusoidal input simulations give
kG(0.2i)k =
0.447◦C %−1 0.047◦C %−1 0.030◦%−1 0.028◦%−1
φ(G(0.2i))=
27◦ −30◦ 49◦ 38◦
. (21)
Consistent with physical understanding of the system, the top-right entry of the magnitude matrix is small and is ig-nored for the purpose of designing a feedback algorithm. As-suming the first-order linear model described by Eq. (7), also note that part of the phase lag is due to the inherent dynamics of the system and part is due to the half-year time delay intro-duced by annual averaging. At this frequency,D=0.5 intro-duces a phase lag of approximately 6◦, which is incorporated into the estimates of phase lag in Eq. (21). While the sys-tem identification simulation varies the input continuously and only introducesD=0.5, our feedback implementations update the input and hold it constant for the following year, introducing another half-year delay and an extra 6◦phase lag atω=0.2 rad yr−1on top of the estimate in Eq. (21).
From visual inspection of Figs. 10 and 11, it is clear that climate system noise can result in errors in the sinusoidal fits, which can introduce errors into estimates of the trans-fer functions. MacMartin and Tziperman (2014) discuss how to calculate the estimation error in the transfer function; we repeat the salient equations here.
Based on calculations of SNR (Eq. 19), the standard de-viations of the estimation error in G at the loop crossover frequencyωgc=0.2 rad yr−1are
σM(0.2i)=
0.029 0.027 0.009 0.007
σφ(G(0.2i))=
4◦ 30◦ 17◦ 13◦
. (22)
One standard deviation of the errors in magnitude is between 7 and 31 % of the values given in Eq. (21) (excluding the top-right entry), and one standard deviation of the errors in phase is between 13 and 25 % (with the exception of the top-right entry). Kravitz et al. (2014) showed that the feedback algo-rithm considered there was robust to at least 50 % error in magnitude, and we choose a sufficient phase margin below to accommodate the maximum phase error of∼17◦. Therefore, we conclude that any potential errors in the fits are unlikely to substantially affect the feedback design.
0 20 40 60
−1 −0.5 0 0.5 1 Year
Precip centroid change
(degrees)
Amplitude ratio = 0.03 Phase lag = 49 degrees
Model response
Sinusoid fit
0 20 40 60
−6 −4 −2 0 2 4 6
Arctic temperature change
(degrees C)
Amplitude ratio = 0.447
Phase lag = 27 degrees Arctic insolation perturbation
0 20 40 60
−6 −4 −2 0 2 4 6
Amplitude ratio = 0.047 Phase lag = −30 degrees Antarctic insolation perturbation
0 20 40 60
−1 −0.5 0 0.5 1 Year Amplitude ratio = 0.028 Phase lag = 38 degrees
Figure 10.Results from the sinusoidal perturbations in the 2×2 design case. Input signal wasu(t)=0.12 sin(0.2t), where 0.12 cor-responds to a maximum amplitude of 12 % reduction or increase in solar irradiance in the region, and 0.2 rad yr−1is the chosen band-width (Sect. 3.3). Results are summarized in Eq. (21).
From Eq. (21), the time constantβ and the timescaleτ in Eq. (7) can be computed. For example, the relationship be-tweenSArctic andTArctic can be described byβ=0.447 and
τ=1.946. These values differ somewhat from the best-fit values obtained from the step response simulations, poten-tially due to difficulties with the step-response system iden-tification introduced by high-frequency variability, or due to the first-order linear model not adequately describing the dy-namics. In principle, additional simulations could improve estimates of these parameters, but as we showed in Sect. 3.3, this is not necessary for designing a successful feedback al-gorithm.
Following the procedure described in the previous sec-tions, we first choose SISO feedback gains to adjust high-latitude Northern Hemisphere forcing in response to devi-ation in Arctic temperature from the desired value. Choos-ing kp/ki=2.5 adds 27◦ phase lead from the proportional term (tan−1(2.5×0.2); Eq. 16). (kp/ki=2.5 is approxi-mately the same value that one would obtain Eq. (15), but it is not identical. Changingkpchanges the phase margin; to some extent, these are design choices.) Then, with Eq. (15), choosingki=0.4 gives the desired crossover frequency of
ωgc=0.2 rad yr−1. These choices result in a phase margin of
84◦.
As described in Sect. 3.4, the high-latitude Southern Hemisphere forcing SAntarctic can be adjusted both in
re-sponse to changes in the precipitation centroid χ and in response to the expected change in χ due to SArctic. We
again choose kp/ki=2.5, although because the system
tempera-0 20 40 60 −1 −0.5 0 0.5 1 Year T0 L0
Amplitude ratio = 0.66
Phase lag = 38.07 degrees
0 20 40 60
−0.2 −0.1 0 0.1 0.2 0.3 Year T1
Amplitude ratio = 0.13
Phase lag = 22.2 degrees
L0
0 20 40 60
−0.1 −0.05 0 0.05 0.1 0.15 Year T2
Amplitude ratio = 0.07
Phase lag = 60.23 degrees L0
0 20 40 60
−0.4 −0.2 0 0.2 0.4 Year T0
Amplitude ratio = 0.06
Phase lag = 16.13 degrees L1
0 20 40 60
−0.2 −0.1 0 0.1 0.2 0.3 Year T1
Amplitude ratio = 0.15
Phase lag = 20.11 degrees L1
0 20 40 60
−0.1 −0.05 0 0.05 0.1 Year T2
Amplitude ratio = 0.03
Phase lag = −11.71 degrees L1
0 20 40 60
−0.4 −0.2 0 0.2 0.4 Year T0
Amplitude ratio = 0.03
Phase lag = 142.27 degrees L2
0 20 40 60
−0.2 −0.1 0 0.1 0.2 Year T1
Amplitude ratio = 0.02
Phase lag = 180.69 degrees L2
0 20 40 60
−0.1 −0.05 0 0.05 0.1 0.15 Year T2 Amplitude ratio = 0.03
Phase lag = 10.49 degrees L2
Model response Sinusoid fit
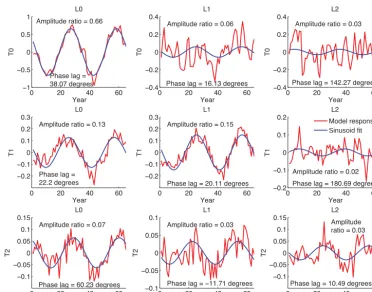
Figure 11.Results for the sinusoidal perturbations in the 3×3 design case. Inputs (L0,L1,L2) and outputs (T0,T1,T2) are described in
Sect. 2. Input signal wasu(t)=0.01 sin(0.2t), where 0.01 corresponds to a maximum amplitude of 1 % reduction or increase in the pattern of insolation change (Eq. 3), and 0.2 rad yr−1is the chosen bandwidth (Sect. 3.3). Results are summarized in Eq. (26).
ture response to Arctic insolation changes, this choice will lead to lower phase margin. The value of ki that yields ωgc≈0.2 rad yr−1 is 6.4, which we round to ki=6; then kp=15. Although better performance would be achieved
by also adjusting SAntarctic in direct response to changes in SArctic, we neglect this here, as the adjustment only in re-sponse to changes inχ results in acceptable performance.
Thus, in summary, we have
SArctic=0.4
t
Z
0
TArctic,ref−TArcticdt+ TArctic,ref−TArctic (23)
SAntarctic=6
t Z
0
(χref−χ) dt+15 (χref−χ). (24)
(Although it is abuse of notation, integrals are used instead of sums for clarity.)
3.7 3×3 design example
We now consider system identification and feedback design for the three-input, three-output design example described in Sect. 2, where the inputs areL0,L1, andL2patterns of
so-lar reduction (Fig. 2b), and the outputs are the corresponding projections of zonal-mean temperature: global-mean (T0), a
linear dependence on sine of latitude that captures interhemi-spheric asymmetry (T1), and a quadratic dependence on sine
of latitude that captures Equator-to-pole temperature gradi-ents (T2). The first (SISO) entry in this 3×3 problem is
the same input–output system for which feedback was de-signed in earlier work (MacMartin et al., 2014b; Kravitz et al., 2014), based on an extensive frequency-domain system identification of the HadCM3L general circulation model (MacMynowski et al., 2011).
Similarly to Eq. (20), we can write the influence matrix for the 3×3 problem as
T0 T1 T2 =
m00 0 0
m10 m11 0 m20 m21 m22
L0 L1 L2
. (25)
This system is also inherently triangular.
tem-perature. As in the 2×2 example in Sect. 3.6, there is an implicit 6-month time delay in the plotted simulation output from the annual averaging, corresponding to a 6◦phase delay at this frequency.
The best estimate of the magnitude and phase of the input– output response atω=0.2 rad yr−1is
kG(0.2i)k =
0.66 – –
0.13 0.15 – 0.07 0.03 0.03
φ(G(0.2i))=
38 – –
22 20 –
60 −12 10
, (26)
where dashes in the matrices indicate that the estimate is in-distinguishable from error (see Eq. 27 below) and does not have a strong physical connection.
The phase estimates include a half year of time delay due to annual averaging. Climate variability clearly introduces uncertainty in these estimates, particularly for the small el-ements (Fig. 11); as such, the bottom-middle entry of the phase lag matrix is taken to be zero. The upper triangular entries of the transfer function matrix are indistinguishable from zero, consistent with physical understanding of the sys-tem, and are left blank. Note from Fig. 1 in MacMartin et al. (2014b) that, at this frequency, the corresponding (1, 1) entry for the HadCM3L general circulation model had a gain of 0.6 and a phase of 30◦(36◦if including a half-year time delay), which is very similar to the results here.
Performing the same error calculations as in Sect. 3.6 yields Eq. (27):
σM(0.2i)=
0.030 – –
0.039 0.022 – 0.016 0.013 0.018
σφ(0.2i)=
3 – –
17 8 –
13 24 30
. (27)
The errors in magnitude (1σ) for the lower triangle are ∼4 % for the 1×1 sub-case, up to 30 % for the 2×2 sub-case, and up to 59 % for the full 3×3 case. As in the 2×2 case, no error in Eq. (27) is going to substantially impact the performance of the feedback design, although the large phase uncertainty in the final entry leads us to choose a larger phase margin than we might otherwise.
We first choose feedback gains to adjust globally uniform solar reduction to maintain global-mean temperature, corre-sponding to the (1, 1) entry of the system dynamics matrix. Again, note that there is a 1-year time delay introduced by averaging over the previous year before making a decision and holding that decision fixed for an entire year; at a fre-quency of 0.2 rad yr−1, this yields a phase lag of approx-imately 11.4◦, only half of which is included in Eq. (26). Thus, with zero proportional gain, choosing ki=0.2/0.7
(after rounding) would give a loop crossover frequency of 0.2 rad yr−1 and a 48◦ phase margin. This low phase mar-gin would yield significant amplification of natural variabil-ity at high frequencies and could lead to additional problems if the evaluation model dynamics are not the same as those of the design model. A proportional gainkp=ki adds 11.3◦
of phase at frequencyω=0.2 (tan−1(0.2)), for a total phase margin of roughly 60◦. (The phase margin, and hencekp, is
a design choice; as noted earlier, 60◦is a reasonable choice.) Decreasing ki by the factor p1+(1×0.2)2 compensates
for the increase in gain at 0.2 rad yr−1due to the proportional gain and thus maintains the desired loop crossover frequency of 0.2 rad yr−1. Thus,ki=0.2/0.7/
p
1+(1×0.2)2≈0.28.
If the system were diagonal, the additional degrees of free-dom could be similarly adjusted with just a rescaling of bothki and kp by the inverse of the diagonal elements of
kG(0.2i)k; this would maintain the same loop crossover fre-quency for each degree of freedom, and the expected phase margin would be slightly higher for the remaining degrees of freedom. While this approach would converge, better perfor-mance can be achieved by using the knowledge of the cou-pling described by the off-diagonal elements, as described in Sect. 3.4. (Note that the sign of the effect of a uniform solar reduction on all three degrees of freedom is confident from physical principles; the influence ofL1 onT2 is less
obvi-ous.) Thus, the MIMO feedback design for this problem can be summarized as
1L0=0.28
t Z
0
T0−T0,ref
dt+0.28 T0−T0,ref
, (28)
1L1= −1L0+1.3
t
Z
0
T1−T1,refdt+1.3 T1−T1,ref, (29)
1L2= −0.61L1−1.41L0+3.9 t Z
0
T2−T2,refdt
+3.9 T2−T2,ref. (30)
(As in Eqs. (23) and (24), integrals are used instead of sums for clarity.)
4 Results from the 2×2 case
We now proceed with an evaluation of the effectiveness of our designed feedback algorithms.
ad-0 20 40 60 0
2 4 6
Year
Degrees C
Arctic temperature change
1pctCO2 Arctic Only 2x2
0 20 40 60
−1 −0.5 0 0.5 1
Change in precip centroid
Degrees latitude
Year
0 20 40 60
−0.2 −0.1 0 0.1 0.2
Reduction in Arctic insolation
Fraction
Year
0 20 40 60
−0.2 −0.1 0 0.1 0.2
Reduction in Antarctic insolation
Fraction
Year
Figure 12.Results for the 2×2 case in the design model. Black lines indicate the 1pctCO2 simulation. The feedback algorithm ad-justs Arctic and Antarctic insolation (bottom-left and bottom-right panels, respectively) to offset these changes, returning Arctic tem-perature (top-left panel) and (for the 2×2 case) the precipitation centroid (χ, Eq. 1; top-right panel) to the dashed grey lines. Blue lines indicate simulations in which only Arctic insolation is ad-justed. Red lines indicate the full 2×2 case.
justs every year, this strategy is not designed to remove 1-year timescale deviations from the objectives. Arctic insola-tion reducinsola-tions in both the Arctic Only case and the full 2×2 case are approximately linear with CO2 forcing and reach
approximately 14 % by the end of the 70-year simulation, a similar magnitude to that used in the system identification simulations. In the Arctic Only case, the precipitation cen-troidχshifts southward relative to the 1pctCO2 simulation, as expected, but does not return to the baseline value. It is not obvious a priori whether the amount of Arctic insolation reduction that returns Arctic temperature would over- or un-dercompensate for the CO2-induced shift in the precipitation
centroid, and indeed the two models used here show different behavior in this respect.
Because of the net northward shift with only Arctic inso-lation reductions, bringing the precipitation centroid south-ward actually requires an increase in Antarctic insolation in this model. (The feedback algorithm was not given any infor-mation regarding feasibility of the applied radiative forcing; there is no known method of modifying shortwave radiation between 60 and 90◦N, let alone how to increase downward radiative flux in this region.) As might be expected from the results in Fig. 10, the magnitude of increase in Antarctic in-solation in any particular year is on average greater than the magnitude of decrease in Arctic insolation. This is clearly not representative of choices that would be made in an ac-tual geoengineering implementation, but it serves as a useful demonstration of multivariable feedback in part because this behavior is model-specific. The GISS results below show that
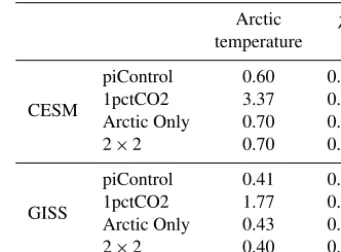
Table 1.Root-mean-square (RMS) differences in Arctic temper-ature (◦C) and χ (Eq. 1; degrees latitude) from the temperature and latitude objectives. Values are calculated over the entire 70-year simulation as the RMS of interannual deviations from the preindus-trial control (piControl) mean.
Arctic χ
temperature
CESM
piControl 0.60 0.17
1pctCO2 3.37 0.59
Arctic Only 0.70 0.38
2×2 0.70 0.17
GISS
piControl 0.41 0.11
1pctCO2 1.77 0.17
Arctic Only 0.43 0.09
2×2 0.40 0.09
the effectiveness of the feedback algorithm in this case is not dependent on whether Arctic-only insolation over- or under-compensates for the CO2shift in precipitation.
Figure 12 illustrates that (in the design model) the feed-back algorithm works as designed, meeting the objectives as specified. However, it is valuable to explore the resulting cli-mate in more detail, as it informs the complexity of defining objectives for geoengineering. Figure 13 provides more spa-tial detail for the results in Fig. 12. The 1pctCO2 simulation results in widespread warming, with temperature amplifica-tion at high latitudes and an increase in global precipitaamplifica-tion. In the Arctic Only simulation, most of the land mass in the Arctic remains slightly warmer than in the preindustrial con-trol run, and the ocean regions are cooled, resulting in no average warming over the Arctic region. Tropical precipita-tion is shifted southward as compared to the 1pctCO2 case. (See Appendix A for mechanistic explanations of tropical precipitation shifts.) In the full 2×2 simulation, the Arctic is cooled, again with a land–ocean contrast, and the Antarc-tic is warmed more; these results are consistent with those of Fig. 12. Tropical precipitation is shifted farther south than in the Arctic Only simulation and is slightly strengthened, but there is substantial drying north of the Equator relative to baseline. Overall, although the feedback algorithm is ef-fective at meeting the specified objectives, there are resid-ual changes in precipitation (Fig. 13) for which the design does not account. Additional degrees of freedom would be required to offset these local changes as well, assuming there exist such degrees of freedom.
Figure 14 shows changes in the seasonal cycle of precip-itation and the centroidχ for the design model. All simu-lations show an increase in tropical precipitation, which is consistent with increased CO2concentration (e.g., Held and
Figure 13.Maps of temperature change (left column panels;◦C) and precipitation change (right column; mm day−1) for the 2×2 case in the design model. Changes are calculated from the average of a preindustrial control simulation. The top panel corresponds to a 1pctCO2 simulation, middle row panels indicate simulations in which only Arctic insolation is adjusted, and bottom row panels indicate the full 2×2 case. All panels are averages over the last 10 years of a 70-year simulation.
consistent with understood mechanisms governing monsoon changes (e.g., May, 2004). The centroidχ is shifted north-ward as compared to the preindustrial climatology in nearly all months (with the exception of boreal late spring), espe-cially in the boreal winter, when the ITCZ is at its most southward position. In the Arctic Only simulation, the po-sition ofχ is restored quite well except in the boreal winter, which may be expected, as there is essentially no change in Arctic insolation during the polar winter. There is also a re-duction in boreal winter/spring precipitation in the Northern Hemisphere subtropics due to a decrease in precipitable wa-ter (not shown). The full 2×2 simulation shows that even though the mean position of χ is restored, the seasonal cy-cle is not, with precipitation slightly too far north in boreal winter and too far south in boreal summer. Other than the increase in tropical precipitation, the only large anomaly in precipitation is in the Southern Hemisphere subtropics dur-ing austral autumn, consistent with a warmer Southern Hemi-sphere and enhanced Australian monsoon precipitation (Lau and Wu, 1999). According to these results, restoration of the
mean position of tropical precipitation would not require the same feedback design as restoration of the seasonal cycle of tropical precipitation.
Given sufficient simulation time, the results above with the design model could have been achieved without feed-back simply by estimating the model sensitivities to forc-ing from CO2and both patterns of solar reduction,