Iran J Public Health, Vol. 46, No.3, Mar 2017, pp.389-395
Original Article
Assessment of the Efficiency of Hospitals before and after the
Implementation of Health Sector Evolution Plan in Iran Based
on Pabon Lasso Model
Ghobad MORADI
1, *Bakhtiar PIROOZI
1, Hossein SAFARI
2, Nader ESMAIL NASAB
1,
Amjad MOHAMADI BOLBANABAD
2, Arezoo YARI
1,31. Social Determinants of Health Research Center, Kurdistan University of Medical Sciences, Sanandaj, Iran 2. Dept. of Health Management and Economics, School of Public Health, Tehran University of Medical Sciences, Tehran, Iran 3. Dept. of Health in Emergencies and Disasters, School of Public Health, Tehran University Medical of Sciences, Tehran, Iran
*Corresponding Author: Email: [email protected]
(Received 17 Mar 2016; accepted 11 Sep 2016)
Introduction
In recent years, the health sector in most coun-tries has faced with a significant increase in hos-pital costs (1). Part of the problems is due to the construction of new and modern hospitals with-out primary assessments to collect and analyze information about people’s demands in a geo-graphic area; lack of need assessments in many
cases has resulted in inefficient use of resources (2). Efficiency refers to a circumstance in which the maximum output is achieved using a specific amount of money spent. For example, it checks whether using a specific number of beds available in a hospital results in the maximum number of patients treated in the same hospital (3, 4).
Abstract
Background: Pabon Lasso model was applied to assess the relative performance of hospitals affiliated to Kurdistan University of Medical Sciences (KUMS) before and after the implementation of Health Sector Evolution Plan (HSEP) in Iran.
Methods: This cross-sectional study was carried out in 11 public hospitals affiliated to KUMS in 2015. Twelve months before and after the implementation of the first phase of HSEP, a checklist was used to collect data from computerized databases within the hospitals' admission and discharge units. Pabon Lasso model includes three indices: bed turnover, bed occupancy ratio, and average length of stay.
Results: Analysis of hospital performance showed an increase in mean of bed occupancy and turnover ratio, which changed from 65.40% and 86.22 times/year during 12 months before to 69.97% and 90.98 times/year during 12 months after HSEP, respectively. In line with Pabon Lasso model, before the implementation of HSEP, 27.27% and 36.36% of the hospitals were entirely efficient and inefficient, respectively, whilst after the implementation of HSEP, their condition changed to 18.18% and 27.27%, in order.
Conclusion: Indicators of bed occupancy and turnover ratio had a 4% increase in the studied hospitals after the im-plementation of HSEP. Number of the hospitals in the efficient zone reduced because of the relative measurement of efficiency by Pabon Lasso model. Since more than 50% of the hospitals in the studied province have not yet reached their optimal bed occupancy ratio (more than 70%), short-term and suitable strategy for improving the efficiency is to stop further expansion of hospitals as well as developing the number of hospital beds.
Inefficiency in the allocation and use of resources is one of the fundamental problems in health sys-tems of developing countries (5, 6). Public hospi-tals, as the largest operating unit of health sys-tems in developing countries, spend more than 50% of the total budget of health care while 80% of these resources are spent in hospitals whose efficiency is not more than 50% of their capacity (5, 7, 8). This is due to a combination of factors related to the supply, such as the excessive con-struction of hospitals without prior need-assessment, and poor quality of services; it is also caused by demand-related factors such as finan-cial, geographical and cultural barriers to people’s access. One of the main concerns of policy-makers and health system managers in these countries is to improve the efficiency and per-formance of hospitals. In order to increase the efficiency of these centers, they try to implement some reforms in the health sector (3, 6, 9).
Performance of hospitals can be evaluated using several approaches. The Pabon Lasso model has been proved to be one of the most useful tools for comparing performance of different hospitals or different wards within the same hospital (6, 7, 10, 11).
This model is a graphical method that utilizes three indicators (Bed Turnover, Bed Occupancy Ratio, and Average Length of Stay) concurrently to assess the relative performance of hospitals. “In this method, the occupancy ratio (horizontal axis) is plotted against the turnover ratio (the ver-tical axis), with verver-tical and horizontal lines divid-ing the diagram into four regions (6)". "The hori-zontal and vertical demarcations represent the mean values of the turnover ratio and occupancy ratio (6)".
An assessment based on only one of the capacity utilization ratios (bed turnover (BTO), bed occu-pancy ratio (BOR) and average length of stay (ALS)) may be imperfect and misleading. For ex-ample, bed occupancy ratio may be relatively high in the presence of unnecessarily high average length of stay that in turn are caused by factors such as poor nursing care and improper schedul-ing of diagnostic and therapeutic interventions. Thus, although the bed occupancy ratio may
in-dicate a good level of capacity utilization, the fact is that such a phenomenon is due to underper-formance/inefficiency of the hospital. Therefore, "to avoid such misleading conclusions, it be-comes necessary to make use of all the three in-dicators simultaneously to have a better picture (6)". To this end, the Pabon Lasso model is use-ful to analyze the performance of hospitals (11, 12).
Since the implementation of HSEP on May 5, 2014, studies on capacity utilization using the Pabon Lasso Model have not been conducted in Kurdistan Province.
The HSEP is a stepwise national plan. The first phase of HSEP includes multiple packages such as providing free basic health insurance to all un-insured Iranians, reducing out-of-pocket pay-ments for inpatient services in the hospitals affili-ated to Ministry of Health and Medical Educa-tion (MoHME), supporting the retenEduca-tion of phy-sicians in underprivileged areas, and improving quality of care in the hospitals affiliated to MoHME through increasing specialists and im-proving quality of inpatient and outpatient ser-vices.
The implementation of HSEP will lead to peo-ple’s increased access and utilization of hospital services (especially for poor households and un-insured people); implementation of HSEP will increase the usage of inpatient services in the hospitals and will affect hospitals performance indicators consequently through reducing out-of-pocket costs and increasing the number of full-time physicians in hospitals affiliated to MoHME (13, 14).
This study was prospected to use Pabon Lasso Model to evaluate the performance of the hospi-tals affiliated to KUMS before and after the im-plementation of HSEP.
Materials and Methods
in Kamyaran, Fajr and Bu Ali hospitals in Mari-wan, Emam hospital in Saqez, Emam Hossain hospital in Bijar, Sallahedin Ayubi hospital in Bane, Shahid Beheshti hospital in Qorve, Emam hospital in Divandare and Shohada hospital in Dehgolan, Iran. Twelve months before (From Apr 21, 2013, to Apr 20, 2014) and 12 months after (May 22, 2014, to May 21, 2015) the imple-mentation of the first phase of HSEP, data was collected using a checklist.
A checklist was designed to collect data about number of active beds, bed occupancy ratio, number of admissions, and number of patients discharged.
The study was approved by the Ethics Commit-tee of the Kurdistan University of Medical Sci-ences.
The data required for this study was extracted from computerized databases within the hospi-tals' admission and discharge units. Capacity utili-zation ratios (BTO, BOR, and ALS) were calcu-lated and Pabon Lasso diagram was drawn using
SPSS 18 (Chicago, IL, USA). Kurdistan province is located in west of Iran and has a population of over 1500000 people as well as 10 cities (15).
Results
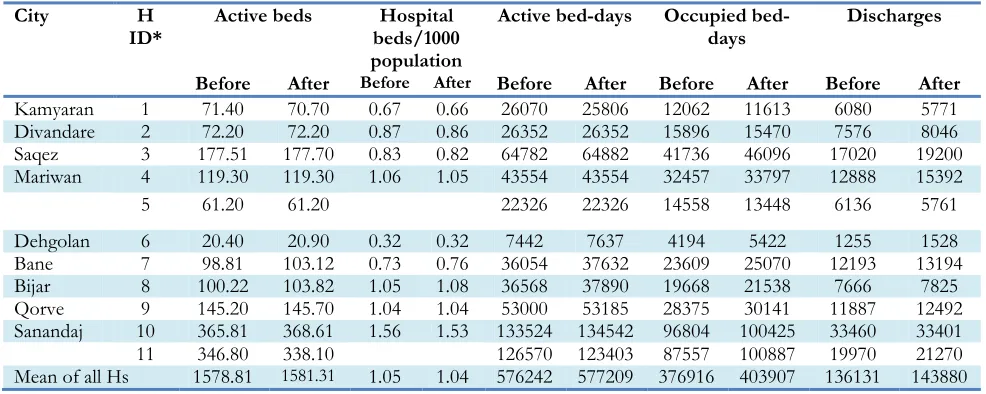
All the studied hospitals, including two teaching and nine non-teaching hospitals, were public and affiliated to KUMS. Table 1 presents the data on the number of active beds, active bed days, occu-pied bed days, and the number of discharges dur-ing the study. There was a total of 1578.81 and 1581.31 active hospital beds in all of the studied hospitals before and after the implementation of HSEP, respectively. As this table shows, the per-formance of inpatient wards in the hospitals after the implementation of HSEP increased, and the occupied bed days increased from 376916 to 403907. Furthermore, hospitals had a wide varia-tion in terms of size; their sizes ranged from 20.4 to 368.6 active beds.
Table 1: Data on the performance of inpatient wards in the studied hospitals before and after the implementation of
HSEP on May 5, 2014
City H
ID* Active beds beds/1000 Hospital
population
Active bed-days Occupied
bed-days Discharges
Before After Before After Before After Before After Before After
Kamyaran 1 71.40 70.70 0.67 0.66 26070 25806 12062 11613 6080 5771
Divandare 2 72.20 72.20 0.87 0.86 26352 26352 15896 15470 7576 8046
Saqez 3 177.51 177.70 0.83 0.82 64782 64882 41736 46096 17020 19200
Mariwan 4 119.30 119.30 1.06 1.05 43554 43554 32457 33797 12888 15392
5 61.20 61.20 22326 22326 14558 13448 6136 5761
Dehgolan 6 20.40 20.90 0.32 0.32 7442 7637 4194 5422 1255 1528
Bane 7 98.81 103.12 0.73 0.76 36054 37632 23609 25070 12193 13194
Bijar 8 100.22 103.82 1.05 1.08 36568 37890 19668 21538 7666 7825
Qorve 9 145.20 145.70 1.04 1.04 53000 53185 28375 30141 11887 12492
Sanandaj 10 365.81 368.61 1.56 1.53 133524 134542 96804 100425 33460 33401
11 346.80 338.10 126570 123403 87557 100887 19970 21270
Mean of all Hs 1578.81 1581.31 1.05 1.04 576242 577209 376916 403907 136131 143880
⃰
Hospital identifier
Table 2 summarizes the hospital capacity utiliza-tion measures and the locautiliza-tion of hospitals in the Pabon Lasso diagrams for both periods of the study. In all of the studied hospitals, the mean of
patients per bed/year and the hospital stay was
2.76 d, whereas in the period after HSEP, these indices changed to 90.98 patients per bed/year and 2.8 d, respectively.
Table 2: Hospitals capacity utilization measures in the studied hospitals during 12 months before and after the
im-plementation of HSEP on May 5, 2014
Hospital ID Average (Standard
deviation) Length of Stay (days)
Bed Turnover Ratio (patient per bed)
Bed Occupancy Ratio
(Confi-dence interval) Location in Pabon Lasso graph (zone)
Before After Before After Before After Before After
1 1.98(1.51) 2.01(1.52) 85.15 81.62 46.26
(34.69-57.83) (33.46-56.54) 45.00 1 1
2 2.09(1.60) 1.92(1.59) 104.93 111.44 60.32
(49.04-71.60)
58.70 (47.34-70.06)
2 2
3 2.25(1.71) 2.40(1.73) 95.88 108.40 64.42
(57.38-71.46) (64.37-77.71) 71.04 2 3
4 2.51(1.61) 2.19(1.60) 108.03 129.01 74.52
(66.70-82.34) (70.11-85.07) 77.59 3 3
5 2.37(1.55) 2.33(152) 100.26 94.13 65.20
(53.27-77.13)
60.23 (47.97-72.49)
2 2
6 3.34(1.01) 3.50(1.03) 61.51 73.11 56.35
(34.83-77.78) (51.30-90.68) 70.99 1 4
7 1.93(1.48) 1.90(1.48) 123.41 127.97 65.48
(56.11-74.85) (57.31-75.91) 66.61 3 2
8 2.56(1.68) 2.75(1.70) 76.50 85.67 53.78
(44.02-63.54) (47.14-66.54) 56.84 1 1
9 2.38(1.66) 2.41(1.66) 81.86 85.73 53.53
(45.42-61.64) (48.61-64.73) 56.67 1 1
10 2.89(2.12) 3.00(2.10) 91.47 90.61 72.49
(67.91-77.07)
74.64 (70.18-79.10)
3 4
11 4.38(2.41) 4.74(2.45) 57.58 62.91 69.17
(64.31-74.03) (77.68-85.82) 81.75 4 4
Mean of all
hospitals 2.76(1.82) 2.80(1.84) 86.22 90.98 (63.05-67.75) 65.40 (67.71-72.23) 69.97 - -
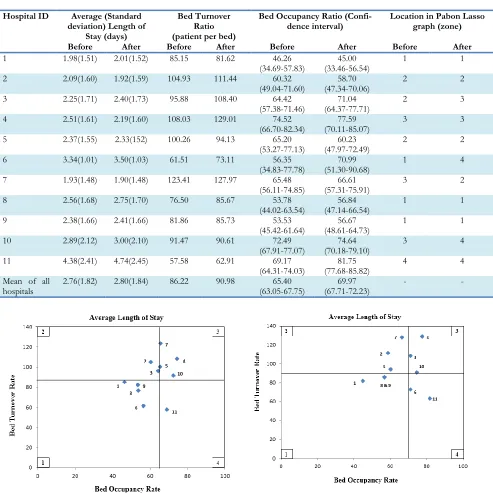
Fig. 1: Pabon Lasso graph for public hospitals of
Kurdi-stan University of Medical Sciences during 12 months before the implementation of HSEP on May 5, 2014
Fig. 2: Pabon Lasso graph of public hospitals affiliated
The location of hospitals in four zones of Pabon Lasso model illustrates during the period of study before the health system reform (Fig. 1). The horizontal and vertical lines indicate the mean values for bed occupancy ratio and bed turnover. Four hospitals (ID.1, 6, 8, 9) are located in zone one, indicating a large number of hospital beds relative to the existing demand; it also indicates the inefficient use of the resources available. There are three hospitals in zone 3 (ID. 4, 7, 10), indicating an acceptable degree of efficiency and an optimal level of performance. In addition, three hospitals (ID. 2, 3, 5) are located in zone 2 and one hospital (ID.11) in zone 4.
Fig. 2 illustrates the location of hospitals in four zones of Pabon Lasso model during the period of study after the implementation of HSEP. Two hospitals (ID. 4, 3) are located in the desirable zone of Pabon Lasso diagram (zone 3), while three hospitals (ID.1, 8, 9) are located in zone 1 which is the most undesirable situation character-ized by low bed occupancy ratio and low turno-ver ratio. Moreoturno-ver, three hospitals (ID. 2, 5, 7) are placed in zone 2 and three hospitals (ID. 6, 10, 11) in zone 4.
Discussion
The average (SD) values for each of the three capacity utilization measures in the studied hospi-tals during 12 months before and after the first phase of HSEP were, respectively, as follows: ALS=2.76 (1.82) and 2.80(1.84) d, BOR=65.4% and 69.97%, BTO=86.22 and 90.98 patients per bed /year.
In the study period before HSEP, only two hos-pitals (18.18%) achieved the target value of BOR>70%, determined by the Iranian national standard (16, 17). While in the study period after HSEP, five hospitals (45.45%) had BOR more than 70%. However, most hospitals before (90.9%) and after (81.8%) the implementation of HSEP achieved the desired value of < 3.5 d that is determined by the Iranian national standard (16, 17).
The evidence indicates an increase in the use of hospitalization services during the period of
study. In addition, in many hospitals (63.6%), bed turnover and occupancy ratio were higher after the implementation of HSEP compared to be-fore its implementation. Nevertheless, despite the increase, the number of hospitals located in zone 3 of the Pabon Lasso graph reduced from three to two hospitals. This might be because the Pabon Lasso graph assesses the relative perfor-mance of hospitals and its horizontal and vertical lines indicate the mean values for bed occupancy ratio and bed turnover in all of the studied hospi-tals. For example, despite the increase in BOR (1.13%) and BTO (4.56 patients per bed/year), the location of Bane hospital (ID. 7) changed from zone 3 (before HSEP) to zone 2 after its implementation, because the observed increased values were less than the increased mean of val-ues of BOR (4.57%) and BTO (4.76 patients per bed/year) in all of the studied hospitals. In a study in Eastern Azerbaijan province, Iran, 44.5% of the hospitals were entirely efficient (18). As shown in Fig. 1 and 2, the number of hospi-tals located in zone 1, indicating poor perfor-mance and inefficient use of resources, declined from four to three after the health system reform. The public hospital beds density per 1000 popu-lation in Kurdistan province was 1.05 and 1.04 before and after HSEP, respectively. Currently, Iran’s hospital beds density is 1.5 beds per 1000 population (private, public, and social security hospitals) while this number is 13.7 in Japan, 2.1 in Saudi Arabia, 2.5 in Turkey, and 5.3 in Euro-pean region (19).
new beds; they should rather focus on removing barriers that make problems for the demand and supply sides of the hospital services.
One out of six hospitals (16.7%), three out of six hospitals (50%), and seven out of 18 public hos-pitals of Iranian Eastern Azerbaijan province (39%) were located in zone 1 (5, 7, 18).
In our study, three hospitals (ID. 2, 3, 5) before and three hospitals (ID. 2, 5, 7) after the health system reform lay in zone 2, which shows low BOR but high BTO ratio. Such hospitals do not need to increase the number of hospital beds and they should conduct studies to recognize prob-lems that lead to low BOR. One out of 18 hospi-tals, and in Bahadori’s study, two hospitals (8.7%) lay in zone 2 (7).
Before the implementation of HSEP, only one hospital (ID. 11) was located in zone 4 while after HSEP three hospitals (ID. 6, 10, 11) were placed in zone 4; these hospitals were usually devoted to patients with chronic or serious illness or perhaps they had unnecessary long stayor were facing the under use of outpatient services. Tawhid and Be-sat hospitals (ID. 10, 11) are teaching hospitals and they have special words like burn, cardiology, cancer, NICU, and trauma wards that are intend-ed to provide services for patients with chronic or serious illness. These hospitals are referral cen-ters for critically ill patients in Kurdistan prov-ince. These could be the reasons for why they located in zone 4.
During the study period, Dehgolan general hos-pital (ID. 6) faced an increase of 14.64% and 11.6% in BOR and BTR, respectively, and it changed its position from zone 1 to zone 4. Alt-hough this change is a sign of improvement in performance, it is recommended to develop out-patient services in order to achieve optimum effi-ciency and utilize advanced medical equipment to improve BTR.
Conclusion
Taking into consideration the overall perfor-mance of hospitals affiliated to KUMS, despite the increase in the average of bed occupancy and turnover ratio in the studied hospitals after the
implementation of HSEP, the number of the hospitals in the efficient zone (zone 3) reduced because of the relative measurement of efficiency by Pabon Lasso model.
Ethical considerations
Ethical issues (Including plagiarism, informed consent, misconduct, data fabrication and/or fal-sification, double publication and/or submission, redundancy, etc.) have been completely observed by the authors.
Acknowledgements
This research was funded by the Kurdistan Uni-versity of Medical Sciences (No. 94.47). The au-thors declare that there is no conflict of interests.
References
1. Yaisawarng S (2002). Performance measurement and resource allocation. Efficiency in the Public Sector. Springer US, pp. 61-81.
2. Asefzadeh S (2003). Hospital Management and Research. 2nd ed. Hadiseemrouz Publications.
Ghazvin.
3. Roberts M, Hsiao W, Berman P, Reich M (2008). Getting health reform right: a guide to improving performance and equity: Oxford university press. London.
4. Farrell MJ (1957). The measurement of productive efficiency. J R Stat Soc Ser A, 120(3):253-90.
5. Goshtasebi A, Vahdaninia M, Gorgipour R, Samanpour A, Maftoon F, Farzadi F and Ahmadi F (2009). Assessing hospital performance by the Pabon Lasso Model. Iran J Public Health, 38(2):119-124.
6. Asbu E, Walker O, Kirigia J, Zawaira F, Magombo F and Zimpita P (2012). Assessing the efficiency of hospitals in Malawi: An application of the Pabón Lasso technique. Afr Health Monitor, 14:25-33.
8. Shepard D, Hodgkin D, and Anthony Y (200). Analysis of hospital costs: a manual for managers.World Health Organization. Geneva.
http://apps.who.int/iris/bitstream/10665/4 2197/1/9241545283.pdf
9. Asefzadeh S, Rezapour A (2005). Health Management. 2nd ed. Hadise emrouz. Ghazvin, Iran.
10. Forootan S, Arab M, Hoseini M, Khosravi B (2015). Determining the efficiency of social security hospitals of Tehran based on Pabon Lasso Model. J Health Adm, 18(59):7-18. 11. Pabón L (1986). Evaluating hospital
performance through simultaneous application of several indicators. Bull Pan Am Health Organ, 20(4):341-57.
12. Younsi M (2014) Performance of Tunisian Public Hospitals: A Comparative Assessment Using the Pabón Lasso Model. Int J Hosp Res, 3(4): 159-66.
13. Moradi-Lakeh M and Vosoogh-Moghaddam A (2015). Health Sector Evolution Plan in Iran; Equity and Sustainability Concerns. Int J Health Policy Manag, 4(10): 637-40.
14. Iranian National Institute of Health Research (2014). Monitoring of Health Sector Evolution Plan. http://nihr.tums.ac.ir/wp-content/uploads/2015/04/file3.pdf
15. Iran SCo (2012). Iran Statistical Yearbook. Statistical Centre of Iran Tehran, Iran 16. Ministry of Health and Medical Education
(2007). Standard guidelines and criteria of evaluation of public hospitals in the country. Ministry of Health and Medical Education Publication. Tehran.
17. Masoompour S, Petramfar P, Farhadi P, Mahdaviazad H (2015). Five-year trend analysis of capacity utilization measures in a teaching hospital 2008-2012. Shiraz E-Med J, 16(2):e21176.
18. Mehrtak M, Yusefzadeh H and Jaafaripooyan E (2014). Pabon Lasso and Data Envelopment Analysis: A Complementary Approach to Hospital Performance Measurement. Glob J Health Sci, 6(4):107-16.
19.World Health Organization (2014). World health statistics 2014. World Health Organization puplication. Geneva.