Creating Working Value Evaluation Model
“WVEM”
Kazunori Uchida, Aoyama Gakuin University, Japan Masashi Tsunoi, Aoyama Gakuin University, Japan Kakuro Amasaka, Aoyama Gakuin University, Japan
ABSTRACT
The authors create a Working Value Evaluation Model “WVEM” for labor valuation by using statistical science that allows manufacturers to visualize the performance of labor. We verify the effectiveness of this model at auto manufactures and others.
Keywords: Job Performance; Working Value Evaluation Model; Manufacturing Industry
INTRODUCTION
n order to create products with superior quality, cost, and delivery (QCD) characteristics, the most important task for manufacturers is raising the quality of work performed by on-site operators (job performance), thus boosting the value of company labor.
In this paper, the authors take a fresh perspective on this issue, placing importance on the performance of labor itself. They then identify the relevance of key causal factors contributing to that performance. Having collected this information, they then create a Working Value Evaluation Model “WVEM” for labor valuation by using statistical science that allows manufacturers to visualize the performance of labor.
The model systematically covers 18 key factors and is made up of five core models: 1) reducing fatigue, 2) preventing illness, 3) comfort, 4) knowledge and ability, and 5) organizations and roles/responsibilities. The authors verify the effectiveness of this model at auto manufactures and others.
BACKGROUND
Manufacturing is the main economic industry in Japan. As a large manufacturing country, Japan is actively expanding its business overseas. On the other hand, the falling birth rate and aging population are becoming serious problems in Japan [Kimura, 1999). Young people are said to have veered away from the manufacturing industry, so it is now facing a shortage of workers.
In order to cope with these problems, Japanese companies have eliminated hard labor in the working environment and streamlined workplaces through the 5S (Seiri – tidiness; Seiton – orderliness; Seisou – cleanliness; Seiketsu – standardization; and Shitsuke - discipline) manufacturing method (Amasaka, 2000; Toyota Motor Corp., 1994; Sakai and Amasaka, 2005). In the local manufacturing environment, however, the increase in the number of temporary workers and the acceptance of foreign trainees have caused a decline in autonomy in the workplaces, and workers have had difficulty in finding the value in working in such environments (Amasaka, 2003; Amasaka, 2004; Amasaka and Sakai, 2011). In such surroundings, there is an urgent need to help workers find meaning in their jobs and acquire high-level skills (Yamaji and Amasaka, 2007; Yamaji and Amasaka, 2008).
If you look overseas, a new research field called Gerontechnology began in Europe where, like Japan, the aging population has grown (Kinnunen-amoroso et al, 2009). In Gerontechnology, physical and mental aspects of old people are studied. Although Gerontechnology has yielded some results scientifically, it is still not applicable in an actual working environment.
300 http://www.cluteinstitute.com/ © 2012 The Clute Institute Then the authors (Tsunoi et al, 2010) thought that it is necessary to enhance the value in working to help workers be satisfied with their jobs and achieve self-realization, and thus build IWV-IM (Intellectual Working Value Improvement Model) that systematizes factors contributing to enhance the value in working. This model clarifies factors contributing to enhance the value in working that had previously been ambiguous and specific activities that companies have to work on. In order to make effective use of this model in each company, it is necessary for them to clarify which aspects are weak and which should first be improved in an objective manner.
CREATING THE WORKING VALUE EVALUATION MODEL "WVEM"
To improve the working value of workers from a comprehensive perspective, the authors created the Working Value Evaluation Model "WVEM" which quantitatively evaluates the awareness of the working value of workers by statistically analyzing data collected through an actual condition survey on companies.
Understanding the Actual Corporate Condition
To delve deeper into the basic principles of working value, a survey was conducted on actual workplaces. As the target industry, the authors selected the automotive industry, which has a larger number of workers among manufacturing industries, and picked up four specific working processes (welding, painting, machining, and assembling) that add a greater burden to human bodies. Then we visited a plant and surveyed the actual condition of the workplace by interviewing workers and taking videos of actual operations. To improve work and working environments, we found, from the result of this survey, that it is necessary to enhance work efficiency with the aid of teamwork, information sharing, and statistical science. The next section explains information obtained through this survey in an organized way.
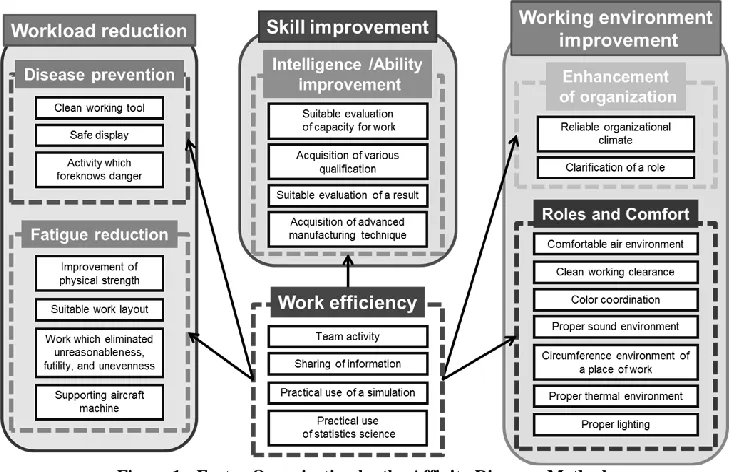
Figure 1: Factor Organization by the Affinity Diagram Method
Arrangement of Factors Contributing to the Improvement of Working Value
result is shown in Figure 1. This diagram shows that factors contributing to working value enhancement can be divided into three groups; namely, workload reduction (disease prevention, fatigue reduction), working environment improvement (enhancement of organization, roles, and comfort), and skill improvement (intelligence/ability improvement). It also indicates that work efficiency affects each group.
Working Value Awareness Survey
To understand how workers actually feel the value in working, the authors conducted a survey on working value awareness. Twenty factors contributing to working value enhancement described in the previous chapter are used as items in the awareness survey. This survey is targeted to workers who are working for safety and health and quality management sections in the manufacturing industry. As shown in Appendix A, each item in the awareness survey was scored on a 1-7 scale and 25 sets of answers were received from workers in the manufacturing industry.
Data Analysis (Interpretation of Relationships between Factors)
Based on the data obtained from the awareness survey, the authors investigate which working value factors they should pay the most attention to enhance the value in working. Analysis is performed using principal component analysis and cluster analysis because, by looking at the relationships between working value evaluation items perceived by the workers and aggregating the items, they think they can determine fundamental evaluation axes for the value in working.
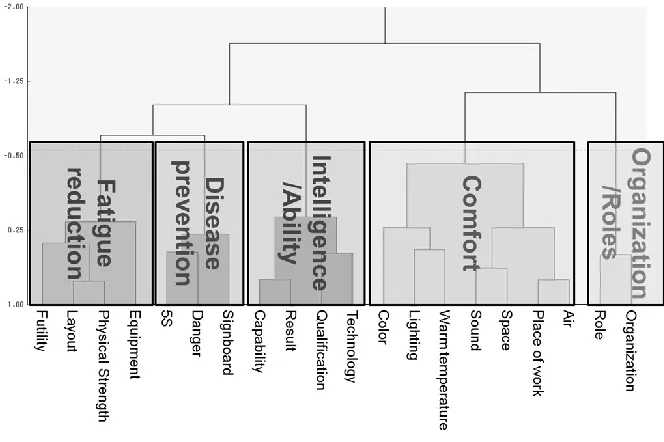
As a result of the cluster analysis, the authors confirmed that items are divided into five clusters (Figure 2). Working value items can be categorized into five groups (fatigue reduction, disease prevention, intelligence/ability, comfort, and organization/roles) by their names and definitions and these five groups are used as evaluation axes.
Figure 2: Cluster Analysis
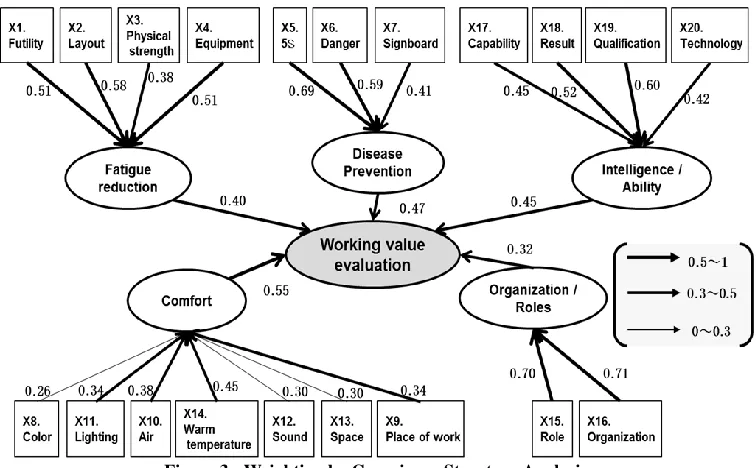
Weighting to the Working Value Evaluation Axes
302 http://www.cluteinstitute.com/ © 2012 The Clute Institute likelihood estimation, which is the most widely used estimation method. Figure 3 shows the result. The goodness of fit of this model is 0.623 and its interpretability exceeds 60%, which are fairly reliable values that indicate this model can be trusted.
Figure 3: Weighting by Covariance Structure Analysis
Formulation of Working Value Evaluation
Tables 1 and 2 show indexes used to create a working value evaluation model that objectively assesses the awareness of the value in working based on the analysis result and data obtained in the previous chapters. Awareness levels are entered according to the score sheet consisting of 18 items presented in the table. Items are evaluated on a 1-7 scale - 1 indicating not important at all and 7 being very important. Then the evaluation entered in the score sheet is weighted and written model formulas used to display the output result are indicated. As a first step, the weightings for the working value evaluation items that were obtained in the previous chapter are indicated.
Table 1: Weightings of the Working Value Evaluation Items (1)
Variable Working Value Evaluation Items Point Estimate
X1 Reduction of futility, unreasonableness, and unevenness 0.36 X2 A suitable work layout 0.51 X3 Supporting aircraft machine 0.35
X4 5S activity 0.34
X5 Activity which foreknows danger 0.47 X6 Conspicuousness of a signboard 0.36
X7 Proper lighting 0.25
Table 2: Weightings of the Working Value Evaluation Items (2)
Variable Working Value Evaluation Axis Dignity
L1 Fatigue reduction 0.32
L2 Disease prevention 0.39
L3 Comfort 0.66
L4 Organization / Roles 0.20
L5 Intelligence / Ability 0.53
L6 Working value -
Moreover, the evaluation entered in the score sheet was weighted and a model formula used to display the output result below was described. The model formulas are standardized so that 100 is the full score, thereby making it possible to easily compare each evaluation axis.
0
.
36
10
.
51
20
.
35
3
11
.
7
1
X
X
X
L
(i)
0
.
34
40
.
47
50
.
36
6
12
.
2
2
X
X
X
L
(ii)
0
.
25
70
.
30
80
.
28
90
.
27
100
.
27
110
.
23
12
8
.
93
3
X
X
X
X
X
X
L
(iii)
0
.
60
130
.
50
14
13
.
0
4
X
X
L
(iv)
0
.
36
150
.
35
160
.
32
170
.
27
18
11
.
0
5
X
X
X
X
L
(v)
0
.
32
10
.
39
20
.
66
30
.
20
40
.
53
5
6
.
80
6
L
L
L
L
L
L
(vi)The above evaluation formulas allow us to describe the value in working in terms of figures. Also, standardization of evaluation formulas made it possible to compare the strength of each working value evaluation axis.
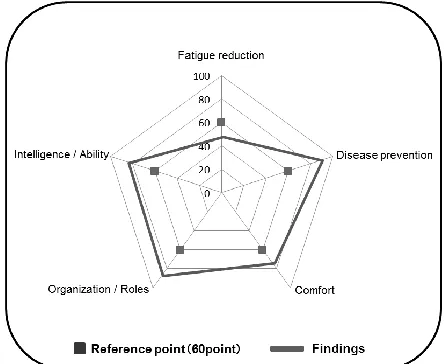
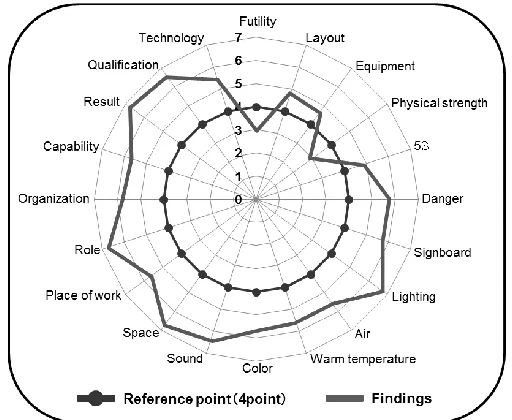
Lastly, radar charts were used to display the output result and two radar charts were created. Radar Chart for Working Value Evaluation Axes (Figure 4) shows calculation results of the model formulas on a scale of 100. Radar Chart by Working Value Item (Figure 5) visualizes all evaluation scores.
304 http://www.cluteinstitute.com/ © 2012 The Clute Institute Figure 5: Radar Chart by Working Value Item
VERIFICATION OF EFFECTIVENESS
Workers of an advanced automotive company (manufacturing industry - quality control, safety, and health) were asked to use and evaluate this model in an actual situation. As a result, they were able to visualize and share the awareness of the value in working by using the evaluation model. The authors were able to determine that the goal presented in this research was achieved. However, the also pointed out that it is necessary to systematize the model and show them more specific improvement methods. Therefore, we will meet the challenge of solving these points in future research.
CONCLUSION
In this research, a working value enhancement model was created, which visualizes the awareness of the value in working in the form of radar charts to understand workers' awareness of the value in working. Its effectiveness was also confirmed. We can expect that the skills of workers can be enhanced by applying this model in actual workplaces, thereby making it possible to continue to produce high-quality products.
AUTHOR INFORMATION
Kazunori Uchida is a graduate student of the College of Science and Engineering at Aoyama Gakuin University. E-mail: [email protected] (Corresponding author)
Masashi Tsunoi received his Master of Engineering degree from the College of Science and Engineering at Aoyama Gakuin University. E-mail: [email protected]
Kakuro Amasaka is a Professor in the School of Science and Engineering at Aoyama Gakuin University, Japan. He received his Ph.D. degree in Precision Mechanical and System Engineering, Statistics and Quality Control at Hiroshima University in 1997. His current research and teaching interests are in the general area of production engineering. In particular, he is interested in New JIT. He is a chairman of JOMSA (2008). E-mail: [email protected] (Corresponding author)
REFERENCES
2. Amasaka, K., Development of Science TQM, A New Principle of Quality Management, International Journal of Production Research, Vol.42, No.17, pp.3691-3706, 2003.
3. Amasaka, K., Proposal and Implementation of the “Science SQC” Quality Control Principle, International Journal of Mathematical and Computer Modeling, Vol.38, No.11-13, pp.1125-1136, 2003.
4. Amasaka, K., Keynote Lecture past, present, future of industrial management, The Japan Society for Production Management Journal, No.20, pp.1-8, 2004.
5. Amasaka, K. and Sakai, H., The New Japan Global Production Model “NJ-GPM”: Strategic Development of Advanced TPS, The Journal of Japanese Operations Management and Strategy, Vol.2, No.1, pp. 1-15, 2011.
6. Kimura, F., Illustration Predict Fear of “Low Birthrate and Longevity”, Chukei Publishing Company, 1999.
7. Kinnunen-amoroso M. and Pasternack I., Mattila S., Evaluation of the practice guidelines of Finnish Institute of Occupational Health with AGREE instrument, Industrial health, Vol.47, pp. 689-693, 2009. 8. Sakai, H. and Amasaka, K., Strategic HI-POS Intelligence Production Operating System: Applying
Advanced TPS to Toyota’s Global Production Strategy, WSEAS Transactions on Advances in Engineering Education, Vol.3, Issue3, pp.223-230, 2005.
9. Toyota Motor Corp. and Toyota Motor Kyushu Corp., Development of a new automobile assembly line, Business Report awarded with Ohkouchi prize, 40, pp. 377-381, 1994.
10. Tsunoi, M., Yamaji, M. and Amasaka, K., A Study of Building an Intellectual Working Value
Improvement Model “IWV-IM”, International Business & Economics Research Journal, Vol.9, pp. 79-84, 2010.
11. Yamaji, M. and Amasaka, K., Evolution of Technology and Skills in Production Workplaces Utilizing Advanced TPS, Journal of Business & Economics Research, Vol.5, No.6, pp.61-66, 2007.
306 http://www.cluteinstitute.com/ © 2012 The Clute Institute APPENDIX A
Awareness Survey Sheet
No. Automobile Designs Strongly
Agree
Strongly
Disagree Comment Freely
1 Reduction of futility, unreasonableness, and
unevenness 7 6 5 4 3 2 1
2 A suitable work layout 7 6 5 4 3 2 1
3 Making physical strength. 7 6 5 4 3 2 1
4 Supporting aircraft machine 7 6 5 4 3 2 1
5 5S activity 7 6 5 4 3 2 1
6 Activity which foreknows danger 7 6 5 4 3 2 1
7 Conspicuousness of a signboard 7 6 5 4 3 2 1
8 Color coordination 7 6 5 4 3 2 1
9 Environment of the on-site circumference 7 6 5 4 3 2 1
10 Comfortable air environment 7 6 5 4 3 2 1
11 Proper lighting 7 6 5 4 3 2 1
12 Proper sound environment 7 6 5 4 3 2 1
13 Clean working clearance 7 6 5 4 3 2 1
14 Proper warm temperature environment 7 6 5 4 3 2 1
15 Clarification of a role 7 6 5 4 3 2 1
16 A reliable organizational climate 7 6 5 4 3 2 1
17 Suitable evaluation of capacity for work 7 6 5 4 3 2 1
18 Suitable evaluation of a result 7 6 5 4 3 2 1
19 Acquisition of qualification 7 6 5 4 3 2 1
20 Acquisition of advanced manufacturing