679 | P a g e
DETERMINATION OF DRILLING OPERATIONS
OPTIMISED PARAMETERS THROUGH
ALGORITHM ON SANDWICH COMPOSITES
MACHINING
D.Ramalingam
1,Dr.M.Saravanan
2, R.RinuKaarthikeyen
3, M.Kesavan
4 1*Associate Professor, Nehru Institute of Technology, Coimbatore (India)
2Principal, SSM Institute of Engineering and Technology, Dindigul (India)
3Research Associate, Manager – Engineering, TCMPFL, Chennai (India)
4Asst. Professor, Nehru Institute of Engg & Technology, Coimbatore (India)
ABSTRACT
Composite materials are becoming increasingly important in a wide range of fields and are replacing many traditional engineering materials. Producing the parts with the FRP materials into this desired dimensional accuracy, surface quality is the prime challenge in the manufacturing operations. At the same time unlike the metals FRP composites are facing the delamination problems as an added issue. With the aim of achieving the minimum delamination and desired dimensional accuracy which are influenced by the machining parameters are considered for the analysis in this attempt through DSA optimisation technique in the MATLAB programming. The values of the experimental observation while drilling the sandwich composite laminates of different fibre volume ratios are the base for this investigational study. Mathematical modelling is carried out and afterwards the regression equations are fed as input as a hybridization and the simulation is performed. The optimised output parameters are located with respect to the combinations of input cutting variables.
Keywords- Sandwich fibre composite laminates, Drilling, Regression, Differential Search
Algorithm, hybridization, Optimisation, Minitab, MATLAB.
I. INTRODUCTION
680 | P a g e
chemical and mechanical properties of the material being processed, the tool material properties and characteristics, machine tool capacity and rigidness and the process settings which include the depth of cut, feed rate of the tool, and spindle speed along with the tool geometry, usage of coolant and its properties etc. Though it is cumbersome to take the complete factors under the control while processing, to the maximum extent possible attempts are being practiced through proper selection of machining parameters which import high influence on the end product surface quality. Application of optimisation techniques is the commonly accepted and exercised approach in these aspects. With this objective and clear understanding of the specific effects of machining parameters in various machining operations, many researchers are using both the traditional and nontraditional optimization techniques to resolve the issues.
II. LITERATURE REVIEW
Isik and Kentli [1] have declared through an approach in turning process of GFRP composites while employing the cemented carbide tool as the cutting tool. Depth of cut, cutting speed and feed rate were the three machining input parameters selected to investigate and minimize the tangential and feed force. The technique adopted was the Weighting techniques with the idea of bringing all the objective functions jointly with applying different coefficients for each. The conclusion was that the proposed technique focused by more economically present to predict the effect of different influential blend of parameters. Radhakrishnan and Uday Nandan [2] developed a practical association among machining parameters like cutting speed, feed rate and depth of cut to the machining force in an end milling operation. They came out with the conclusion by using both multiple regressions and neural network modeling. Regression model was employed to fit the experimental data after filtering the abnormal data points, subsequently analysis carried out through using neural networks to capitulate a final model. While the purpose of developing and optimizing a surface roughness model for machining processes, it is highly inevitable to recognize the present condition of exertion in these aspects [3].Emel Kuram et al [4] have applied the Taguchi based grey relational analysis for multi-objective optimization in micro-milling process parameters. Manna and Bhattacharyya [5] have conducted an investigation on the machinability of Al/SiC-MMC in turning process. The objective of the investigation reveals that the impact of machining parameters like cutting speed, feed and depth of cut on the cutting force and surface finish criteria were identified for the investigation. Palanisamy et al [7] conducted the study about the impact of cutting speed, feed and depth of cut on the cutting tool wear. Regression mathematical modeling and Artificial Neural Network (ANN) are the two modeling techniques they employed in their study towards predicting the tool wear. They have trained the Artificial Neural Network (ANN) with feed forward back propagation for prediction of the tool wear. Optimizations as well as process modeling are two parallel important criteria in manufacturing in which such manufacturing processes are entangled through a variety of vigorously interacting process variables. Surface finish is one among such important factors of machining outcome to predict the concert of any machining operation.
679 | P a g e
III. EXPERIMENT DETAILS
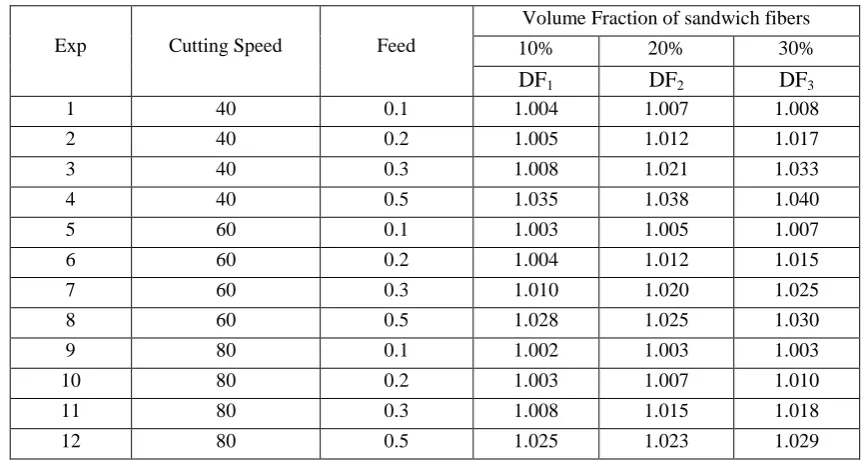
Drilling experiment conducted on the sandwich composite laminates which was made by hand layup method by Naveen et al [6] to assess the performance of the operations and outcome (damages on the hole produced). They have conducted experiment on three different Four-layered unidirectional glass, hemp and sandwich fiber composite laminates with three different fibre volume fraction and investigated the delamination effect on the produced hole. Cutting speed and tool feed are taken as input machining variables and diameter damage factor as the outcome parameter for the investigation. The dimension of the specimen were 100 mm x 50 mm x 3 mm with 10, 20, 30 % volume fractions. The drilled holes were observed using dye penetrate test to measure the diameter of the hole outcome. The damaged factor of the hole diameter calculated with the relationship Dmax / D;
where D max is the maximum hole diameter observed, D is the standard hole diameter. The parameter selection in three levels is shown in the Table 3.1 and data obtained through the experiment is mentioned in the Table 3.2
Table 3.1 Parameter selection
Turning parameters Level 1 Level 2 Level 3
Cutting speed(m/min) 40 60 80 Feed (mm /min) 0.1 0.2 0.3
Table 3.2 Experimental result (Drill hole damage factor)
Exp Cutting Speed Feed
Volume Fraction of sandwich fibers 10% 20% 30%
DF
1DF
2DF
31 40 0.1 1.004 1.007 1.008 2 40 0.2 1.005 1.012 1.017 3 40 0.3 1.008 1.021 1.033 4 40 0.5 1.035 1.038 1.040 5 60 0.1 1.003 1.005 1.007 6 60 0.2 1.004 1.012 1.015 7 60 0.3 1.010 1.020 1.025 8 60 0.5 1.028 1.025 1.030 9 80 0.1 1.002 1.003 1.003 10 80 0.2 1.003 1.007 1.010 11 80 0.3 1.008 1.015 1.018 12 80 0.5 1.025 1.023 1.029
Where Cs represents the cutting speed, F represents the feed and DF1, DF2, DF3 represents the drill hole damage
factor of 10% , 20 % and 30 % fibre volume fraction specimen.
IV. MATHEMATICAL MODELLING
680 | P a g e
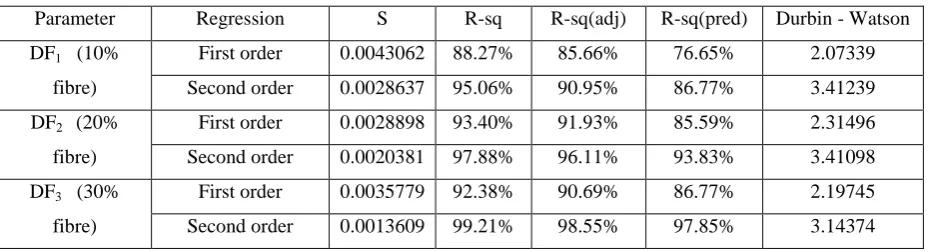
order 2 interactions are taken. With the 95 % confidence level of two sided confidence level interval for the second order regression analysis of DF1, DF2, DF3 Vs Cs, F, and the model summary is noted in Table 4.1.
Table 4.1 Regression Analysis: DF1, DF2, DF3 Vs Cs, F
Parameter Regression S R-sq R-sq(adj) R-sq(pred) Durbin - Watson DF1 (10%
fibre)
First order 0.0043062 88.27% 85.66% 76.65% 2.07339 Second order 0.0028637 95.06% 90.95% 86.77% 3.41239 DF2 (20%
fibre)
First order 0.0028898 93.40% 91.93% 85.59% 2.31496 Second order 0.0020381 97.88% 96.11% 93.83% 3.41098 DF3 (30%
fibre)
First order 0.0035779 92.38% 90.69% 86.77% 2.19745 Second order 0.0013609 99.21% 98.55% 97.85% 3.14374
It reveals that the R-sq value as along with the R-Sq (adj) and R-Sq (pred) values as close, for the second order relation which is significant statistically. The coefficient of variables is taken and the Regression Equations framed for all the three DF1, DF2, DF3 as follows through the Minitab software.
DF1 = (0.9977) – (0.000139*Speed) + (0.1107*Feed) + (0.000001*Speed^2) – (0.0530*Feed^2) –
(0.000336*Speed*Feed)
DF2 = (1.0064) – (0.000224*Speed) + (0.0877*Feed) + (0.000001*Speed^2) – (0.0462*Feed^2)
+ (0.000086*Speed*Feed)
DF3 = (1.01472) – (0.000544*Speed) + (0.1249*Feed) + (0.000003*Speed^2) – (0.0803*Feed^2) –
(0.000114*Speed*Feed)
The equations reveal that the feed rate F is highly influencing parameter on the Drill hole damage factors than the speed.
V. PARAMETRIC OPTIMIZATION
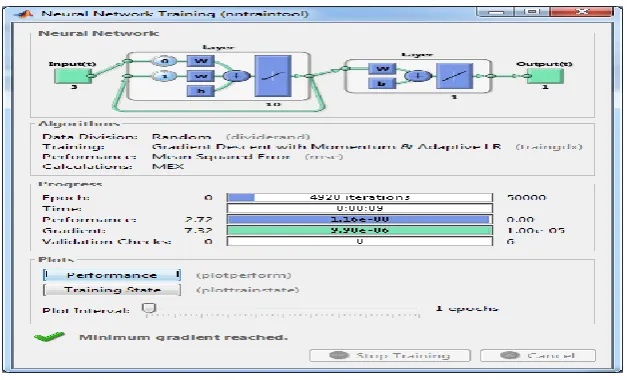
In this approach, MATLAB (R2014a) software with Elman Back Propagation is used for coding Differential Search algorithm. The algorithm is coded to the execution in the Gradient Descent with Momentum & Adaptive Learning. The performance indicator is the mean square error. Based on the objectives, the coding was developed towards optimization, i.e. surface roughness to the minimum value as the objective functions. Initially the simulation is trained for 50000 iterations. Mean squared error in computation is found as 8.91 x 10
-5
681 | P a g e
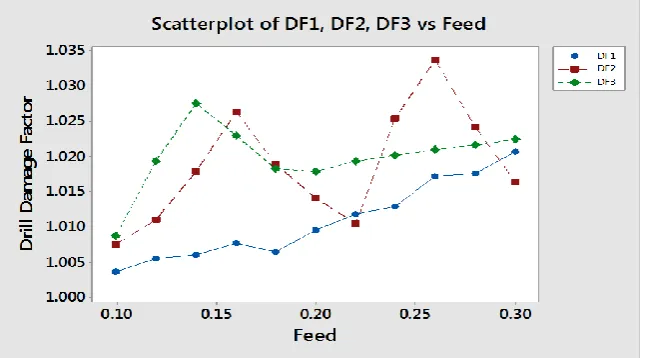
Figure 5.1 Matlab Menu of 50000 iterationsTable 5.1 Computed values of DF1, DF2, DF3 Vs F for speed 40, and 45 m / min
Feed Speed 40 m / min Speed 45 m / min DF1 DF2 DF3 DF1 DF2 DF3
0.10 1.004 1.008 1.009 1.008 1.007 1.010 0.12 1.006 1.011 1.019 1.009 1.021 1.014 0.14 1.006 1.018 1.028 1.009 1.029 1.020 0.16 1.008 1.026 1.023 1.009 1.024 1.022 0.18 1.007 1.019 1.018 1.011 1.014 1.020 0.20 1.010 1.014 1.018 1.012 1.010 1.019 0.22 1.012 1.011 1.019 1.014 1.019 1.019 0.24 1.013 1.025 1.020 1.016 1.031 1.020 0.26 1.017 1.034 1.021 1.017 1.028 1.020 0.28 1.018 1.024 1.022 1.019 1.017 1.021 0.30 1.021 1.016 1.023 1.020 1.013 1.022
Table 5.2 Computed values of DF1, DF2, DF3 Vs F for speed 50, and 55 m / min
Feed Speed 50 m / min Speed 55 m / min DF1 DF2 DF3 DF1 DF2 DF3
682 | P a g e
Table 5.3 Computed values of DF1, DF2, DF3 Vs F for speed 60, and 65 m / minFeed Speed 60 m / min Speed 65 m / min DF1 DF2 DF3 DF1 DF2 DF3
0.10 1.006 1.009 1.008 1.005 1.006 1.007 0.12 1.006 1.022 1.014 1.005 1.021 1.014 0.14 1.006 1.024 1.021 1.005 1.022 1.022 0.16 1.006 1.020 1.023 1.005 1.020 1.023 0.18 1.008 1.012 1.019 1.007 1.013 1.018 0.20 1.009 1.010 1.016 1.008 1.011 1.015 0.22 1.011 1.016 1.017 1.009 1.013 1.016 0.24 1.013 1.024 1.018 1.012 1.021 1.017 0.26 1.014 1.025 1.019 1.013 1.024 1.018 0.28 1.016 1.018 1.019 1.015 1.021 1.018 0.30 1.018 1.014 1.020 1.017 1.015 1.019
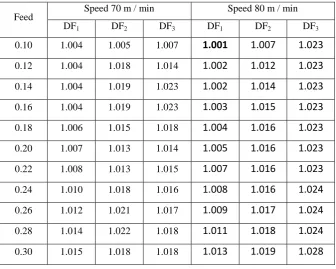
Table 5.4 Computed values of DF1, DF2, DF3 Vs F for speed 70, and 80 m / min
Feed
Speed 70 m / min Speed 80 m / min DF1 DF2 DF3 DF1 DF2 DF3
0.10 1.004 1.005 1.007
1.001
1.007
1.023
0.12 1.004 1.018 1.0141.002
1.012
1.023
0.14 1.004 1.019 1.0231.002
1.014
1.023
0.16 1.004 1.019 1.0231.003
1.015
1.023
0.18 1.006 1.015 1.0181.004
1.016
1.023
0.20 1.007 1.013 1.0141.005
1.016
1.023
0.22 1.008 1.013 1.0151.007
1.016
1.023
0.24 1.010 1.018 1.0161.008
1.016
1.024
0.26 1.012 1.021 1.017
1.009
1.017
1.024
0.28 1.014 1.022 1.018
1.011
1.018
1.024
0.30 1.015 1.018 1.018
1.013
1.019
1.028
683 | P a g e
Figure 5.2 DF1, DF2, DF3 Vs F for Speed 40 m / minFigure 5.3 DF1, DF2, DF3 Vs F for Speed 45 m /min
684 | P a g e
Figure 5.5 DF1, DF2, DF3 Vs F for Speed 55 m /minFigure 5.6 DF1, DF2, DF3 Vs F for Speed 70 m /min
Figure 5.7 DF1, DF2, DF3 Vs F for Speed 80 m /min
The optimal value of the hole diameter damage factor for each clause of fibre volume fraction is shown in the Table 5. 5.
Table 5.5 Optimal value of the hole diameter damage factor
Fibre Volume fraction Speed Feed DF values
685 | P a g e
VI. RESULTS AND CONCLUSIONS
In this attempt of optimizing the process parameters towards the hole diameter damage factor in drilling operations on the sandwich fibre composite laminates is simulated by applying Differential Search Algorithm in the MATLAB programming. From the regression analysis it is evident that the feed parameter of the tool is showing high level influence on the hole diameter damage factor over the other parameter (speed). Scatter plots presented through the Minitab for the various combinations of input machining parameter values will be useful for the manufacturer concern in the selection of machining parameter combination with reference to the required product quality. Similar attempt may be done for other material processing operations also with other optimization algorithms in order to identify the optimised machining conditions which will support the machining operations.
REFERENCES
[1] Isik B & Kentli A, 2009, “Multi criteria optimization of cutting parameters in turning of UD-GFRP materials considering sensitivity”, International Journal Advanced Manufacturing Technology, vol. 44, pp. 1144– 1153.
[2] Radhakrishnan T & Uday Nandan, 2005, “Milling force prediction using regression and neural networks”, Journal of Intelligent Manufacturing, vol. 16, pp. 93-102.
[3] Ozel C & Kilickap E, 2006, “Optimisation of surface roughness with GA approach in turning 15% SiCp reinforced AlSi7Mg2 MMC material”, Int J Mach Machinability Mater., vol. 1, no. 4, pp. 476–487. [4] Emel Kuram & Babur Ozcelik, 2013, “Multi-objective optimization using Taguchi based grey relational
analysis for micro-milling of Al 7075 material with ball nose end mill”, Measurement, vol. 46, pp. 1849-1864.
[5] Manna A. & Bhattacharayya B, 2003, “A study of machinability of Al-SiC Metal Matrix Composites”, Journal of Materials Processing Technology, vol. 140, pp. 711-716.
[6] P. N. E. Naveen, M. Yasaswi, R. V. Prasad, 2012. „Experimental Investigation of Drilling Parameters on Composite Materials‟ IOSR Journal of Mechanical and Civil Engineering (IOSRJMCE). Volume 2, Issue 3, pp 30-37.
[7] Palanisamy P, Rajendran I & Shanmugasundaram S, 2008, “Prediction of tool wear using regression and ANN models in end-milling operation”, International Journal of Advanced Manufacturing Technology, vol. 37, pp. 29-41.