R E S E A R C H A R T I C L E
Open Access
Application of three statistical models for
predicting the risk of diabetes
Siyu Liu, Yue Gao, Yuhang Shen, Min Zhang, Jingjing Li and Pinghui Sun
*Abstract
Background:At present, the proportion of undiagnosed diabetes in Chinese adults is as high as 15.5%. People with diabetes who are not treated and controlled in time may have various complications, such as cardiovascular and cerebrovascular diseases and diabetic foot disorders, which not only seriously affect the quality of life of people with diabetes but also impose a heavy burden on families and society. Therefore, prevention and control of type 2 diabetes is of great significance.
Methods:We constructed a logistic regression model, a neural network model and a decision tree model to analyse the risk factors for type 2 diabetes and then compared the prediction accuracy of the different models by calculating the area under the relative operating characteristic (ROC) curve and back-inputting the data into the model.
Results:The prevalence of type 2 diabetes in 4177 subjects who were not diagnosed with type 2 diabetes was 9.31%. The most influential factors associated with type 2 diabetes were triglyceride (TG)≥1.17 mmol/L (odds ratio (OR) =2.233), age≥70 years (OR = 1.734), hypertension (OR = 1.703), alcohol consumption (OR = 1.674), and total cholesterol≥5.2 mmol/ L (TC) (OR = 1.463). The prediction accuracies of the three prediction models were 90.8, 91.2, and 90.7%, respectively, and the areas under curve (AUCs) were 0.711, 0.780, and 0.698, respectively. The differences in the AUCs after back
propagation (BP) of the neural network model, logistic regression model and decision tree model were statistically significant (P< 0.05).
Conclusion:BP neural networks have a higher predictive power for identifying the associated risk factors of type 2 diabetes than the other two models, but it is necessary to select a suitable model for specific situations.
Keywords:Type 2 diabetes, BP neural networks, Logistic regressive model, Decision tree model
Background
Diabetes mellitus (DM) is a metabolic disease character-ized by elevated blood glucose. All over the world, the prevalence of diabetes is on the rise. According to a WHO report, there have been more than 36 million deaths due to chronic non-communicable diseases worldwide, and diabetes ranked fourth, accounting for 3% in 2008 [1]. By 2014, the number of people with diabetes worldwide reached 422 million, accounting for 8.5% of the total population [2]. In recent years, the proportion of deaths due to diabetes has gradually increased as a proportion of all deaths due to chronic diseases. According to existing diabetes data and trends, it is estimated that the number of people with diabetes worldwide will reach 366 million
by 2030 [3]. At present, the proportion of the potential population with diabetes in Chinese adults is as high as 15.5, and 60.7% of these individuals had not previously received a diagnosis of prediabetes [4].
Diabetes is a chronic, lifelong disease. Diabetes is one of the main chronic non-communicable diseases and can cause various complications, such as hypertension, coron-ary heart disease, diabetic nephropathy and diabetic foot [5]. Diabetes has become one of the main sources of global disease burden [6]. At present, diagnosis of diabetes is mainly based on a doctor’s diagnosis and laboratory exam-ination. In some cases, diabetes complications can be avoided when a person with diabetes is diagnosed early, treated and maintains tight control of their blood sugar levels. However, due to the lack of early diagnosis and screening techniques, some diabetic patients develop into advanced stages when they are diagnosed [4], which causes
© The Author(s). 2019Open AccessThis article is distributed under the terms of the Creative Commons Attribution 4.0 International License (http://creativecommons.org/licenses/by/4.0/), which permits unrestricted use, distribution, and reproduction in any medium, provided you give appropriate credit to the original author(s) and the source, provide a link to the Creative Commons license, and indicate if changes were made. The Creative Commons Public Domain Dedication waiver (http://creativecommons.org/publicdomain/zero/1.0/) applies to the data made available in this article, unless otherwise stated. * Correspondence:[email protected]
serious consequences, and some have even died [7]. Dia-betes consumes a large amount of medical resources. How to solve the contradiction between the uneven distribution of medical resources and the rapid growth of medical expenses is a problem.
Prevention-based control is needed for type 2 diabetes. Studies have shown that community intervention is a cost-effective measure to reduce cardiovascular morbidity throughout the world [8,9] and the risk of diabetes in indi-viduals. An assessment can screen out high-risk groups with diabetes and reduce the incidence and mortality of diabetes by targeting intervention in high-risk groups. Knowler et al. conducted a follow-up for an average of 2.8 years and concluded that lifestyle interventions reduced the incidence of pre-diabetic patients by 58% [10]. The Finnish Diabetes Prevention Study reported that obese pre-diabetes patients with weight loss of more than 2.5% within one year had an incidence of diabetes of approxi-mately 2%, and patients with a 2.5% weight gain had an incidence of diabetes of approximately 8%. Perreault et al. reported that reverting to normal glucose levels can reduce the risk of diabetes in the future by 56% in pre-diabetes patients [11].
In recent years, most of the methods for performing a disease risk assessment involve data mining technology. Data mining is a new widely used method in the medical field for disease diagnosis, prognosis, medical expense management. Wang C. et al. used a neural network to identify those at high risk of T2DM based on demo-graphic, lifestyle and anthropometric data [12]. Kang S. et al. used a neural network to make a personalized pre-diction of drug efficacy for diabetes treatment [13]. Kim SY at al.(2011) used an artificial neural network to estab-lish a predictive model of pre-operative advanced prostate cancer, providing a basis for clinical decision-making [14]. Hon-Yi Shi et al. used artificial neural network and logistic regression models to predict in-hospital mortality after traumatic brain injury surgery [15].
Logistic regression models are nonlinear probability models that are typically used to identify disease risk fac-tors and predict the risk of occurrence. These models are suitable for performing regression analyses of dependent variables as categorical variables. The factors that influence diabetes have been widely used in logistic regression analyses in the past. The BP neural network is a multi-layer, feedforward neural network trained by an error back propagation algorithm. The BP neural net-work is the most widely used neural netnet-work technique and uses computing power to simulate the information transmission process of an animal neural network. Perez Acadia used an artificial neural network to establish a predictive model of hyperglycaemia in diabetic patients [16]; Zarkogianni K used an artificial neural network to establish a query system for insulin injection in people
with diabetes [17]. A decision tree model is a tree-like process in which each node is a split attribute that can be intuitively seen from the decision tree. The decision tree model has the advantages of being fast, easy to understand, and able to process large amounts of data. The decision tree model has been widely used in various medical fields in recent years [18]
Data mining is widely used in the medical field, al-though in recent years, studies have used using data mining techniques to study predictive models, such as logistic regression analysis, decision trees, artificial neural network algorithms, and others. Most of the stud-ies use a single model and rarely use multiple models to conduct comparative research [4, 12, 13]. Because each method has its own advantages and disadvantages, it is necessary to compare different models to identify the optimal mathematical model for predicting type 2 dia-betes. This paper combines a logistic regression model, a BP neural network model and a decision tree model to analyse factors affecting diabetes and explore the most suitable model for predicting the risk of type 2 diabetes in the Chinese population. In addition, this study was based on adults in Northeast China, inhabitants of this area have unique life style than others, including higher drinking rate and high salt and oil diet. Due to different lifestyles, local residents may have different causes of type 2 diabetes than other regions.
Methods Participants
This study was conducted in 2018. Participants were those who resided in the 5 monitoring areas of Jilin Province for 6 months or more within 12 months prior to the survey and were 18 years old or older. According to the multi-stage stratified cluster sampling method, 5 counties (cities) were selected as monitoring points in each stage, 4 towns (streets) were selected in each moni-toring point, and 3 villages (residential committees) were selected in each township. Each village drew 50 families, and each family drew a resident over 18 years old to in-clude. To control lost calls, this study adopted homolo-gous population replacement for lost participants and controlled the replacement rate of the surveyed house-holds to not exceed 10.0%. The exclusion criteria were (1) lack of diabetes-related laboratory tests data and questionnaire data or (2) self-report of a type 2 diabetes diagnosis on the questionnaire. A total of 4689 cases were recovered, of which 4177 were valid.
Research methods
Questionnaire survey
The questionnaire survey was conducted in accordance with the China Chronic Disease Surveillance Question-naire Survey Procedure and was conducted face-to-face by investigators with unified training [19]. The question-naire included smoking, alcohol, diet, and physical activ-ity. Smoking meant that at least one tobacco product was consumed every day and there was a history of smoking for ≥6 months consecutively. Drinking was consumption of any type of alcohol at least once a week and a history of drinking for≥6 months.
Physical examination
Height, weight, waist circumference, and blood pressure were measured by two uniformly trained surveyors, and body mass index BMI = weight (kg) / height2(m2) [20]. The accuracy of the height measurement tools is 0.1 cm. The accuracy of the weight measurement tools is 0.1 kg. The accuracy of the waist measurement tools is 0.1 cm. Blood pressure was measured using a HEM-7200 elec-tronic sphygmomanometer produced by Omron (Dalian) Co Ltd. BMI < 27.9 kg/m2 was normal and overweight and BMI≥28.0 kg/m2 was obese [21]. A male waist circumference > 90 cm and a female waist circumfer-ence > 80 cm was indicative of abdominal obesity [22, 23]. Systolic blood pressure≥140 mmHg (1 mmHg with-out antihypertensive drug) =0.1333 kPa and diastolic blood pressure≥90 mmHg or having been diagnosed with hypertension by a township hospitals in the past 2 weeks were considered high blood pressure [24].
Laboratory tests
The investigator took 4 ml of fasting venous blood from the surveyed subjects, and after centrifugation and dis-pensing at the survey site, the samples were stored and transported to the Jilin University School of Basic Medi-cine laboratory for determination of fasting blood glu-cose and oral gluglu-cose after oral administration of 75 g of anhydrous glucose for 2 h (OGTT-2 h), glycated haemo-globin (HbA1c), cholesterol (TC), triglyceride (TG), low density lipoprotein cholesterol (LDL-C) and high density lipoprotein cholesterol (HDL-C) and other indicators.
Diabetes mellitus was diagnosed if fasting blood glucose was≥7.0 mmol / L, OGTT - 2 h blood glucose was≥11.1 mmol / L or HbA1c was≥6.5% [25]. The participants who were not diagnosed with dyslipidemia and were not taking lipid-lowering drugs. If TC was ≥5.2 mmol / L, then TC was considered increased. If TG was≥1.17 mmol / L, then TG was considered increased. If LDL - C was≥3.4 mmol / L, then LDL-C was considered increased. If HDL-C was < 1.04 mmol/L, then HDL-C was considered reduced [26]. In people who have been diagnosed with dyslipidemia in the past, we asked them to answer the supplementary question in the questionnaire, which one of the high triglycerides,
high cholesterol, high LDL-c or low HDL-c is diagnosed (If there are multiple indicators of one sample diagnosed as abnormal, it would be included in multiple variables).
Statistical analysis
We used Epi Data 3.1 software with double-entry data to establish a database and complete a consistency test. IBM SPSS 24.0 statistical software was used for general descrip-tive analysis, chi-square tests and establishing the logistic regression model, the BP neural network model and the decision tree model. Of the 4177 participants in this study, 70% of subjects (n1 = 2924) were randomly selected to provide a training data set and 30% of subjects (n2 = 1253) were selected to provide a validation data set for the logis-tic regression model and the decision tree model, 274 (9.37%) and 115(9.18%) people with type 2 diabetes fell in each set. For BP neural network model, we extract 1/3 from the training set as the testing set, 193 (9.47%) and 81 (9.24%) people with type 2 diabetes fell in training set and testing set. We used cross validation to verify the model. The logistic regression model required considering the collinearity problem when incorporating variables. We used tolerance values and the variance inflation factor (VIF) to examine collinearity. The criteria values for toler-ance and VIF (≤0.10 and≥10, respectively) were sufficient to identify co-linearity and thus be excluded when enter-ing the model. The analysis results were statistically significant atP< 0.05.
Results
Demographic characteristics
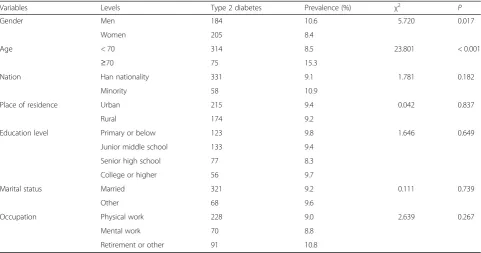
Comparing the prevalence of diabetes in people with dif-ferent demographic characteristics, the results showed that the prevalence of type 2 diabetes was significantly different among subjects of different genders and ages, and the significance level was set at 0.05. The results are shown in Table1.
Comparing the prevalence of diabetes in people with different lifestyles, the results showed that the prevalence of type 2 diabetes was statistically significant among sub-jects with different smoking and drinking statuses, and the significance level was set at 0.05. The results are shown in Table2
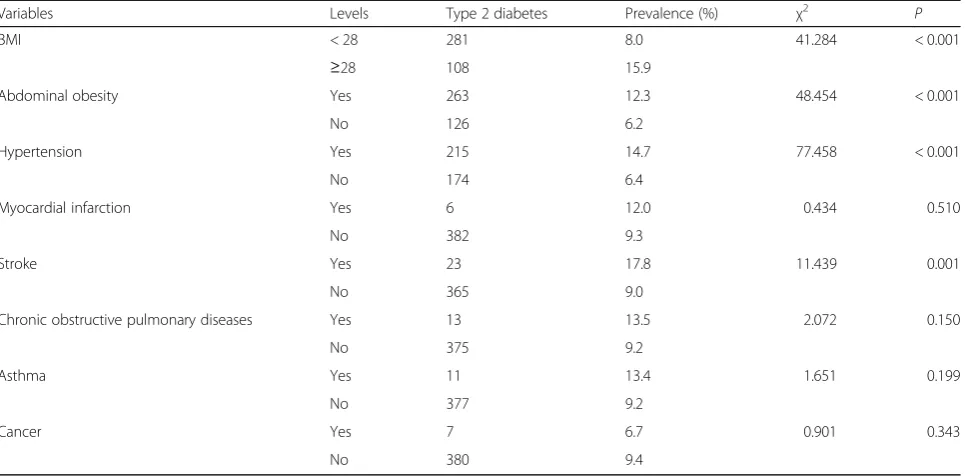
Comparing the prevalence of type 2 diabetes in people with different health statuses, the results showed that the prevalence of type 2 diabetes was statistically signifi-cant among subjects with different BMI, abdominal obesity, hypertension, and stroke, and the significance level was set at 0.05. The results are shown in Table3
HDL-C, and the significance level was set at 0.05. The results are shown in Table4
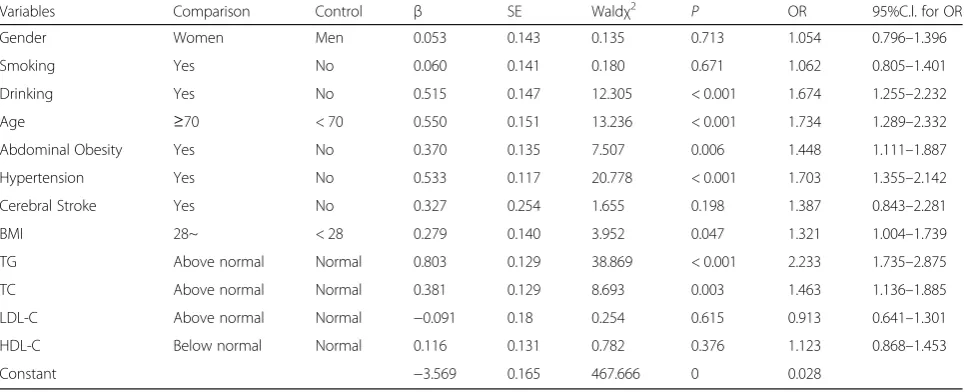
Logistic regression model
Inclusion of meaningful variables from the univariate ana-lysis in the multivariate logistic anaana-lysis showed that 7 vari-ables were statistically significantly associated with the onset of type 2 diabetes: drinking (P< 0.001, OR = 1.674), age (P< 0.001, OR = 1.734), waist circumference (P= 0.006, OR = 1.448), blood pressure (P< 0.001, OR = 1.703), TC (P= 0.003, OR = 1.463), BMI (P= 0.047, OR = 1.321), and TG (P < 0.001, OR = 2.233). See the table for details. As a predictor of the logistic model, the predictive model is:P= 1 / (1 + e (3.569–0.515 × drinking - 0.550 × age - 0.370 × abdominal obesity 0.533 × hypertension 0.381 × TC -0.297 × BMI -0.803 × TG)). Among them, P is the pre-dicted probability of the logistic regression model. Between 0 and 1, the closer P is to 1, the greater the probability of developing type 2 diabetes. Substituting the prediction model into the testing data set, with a critical value of 0.5, the results show that the prediction accuracy of the model was 90.8% and the area under the ROC curve was 0.711
(95% Cl: 0.697–0.724). The sensitivity of the ROC curve was 67.8%, and its specificity was 64.7%. The results are shown in Table5
BP neural network model
The 13 variables that were significant by the chi-square test were included in the neural network model. That is, 13 units were established in the input layer. The number of hidden layers can be 1 or 2. The hidden layer activation function is a hyperbolic tangent, the input layer activation function is the softmax, and the output layer has two units. First, when the hidden layer was 1, the area under the ROC curve of the model with a different number of hidden layer nodes was discussed. The results are shown in Table6. When the number of hidden layer nodes was 5, the area under the ROC curve was the largest, 0.780 (95% Cl: 0.767–0.792); the sensitivity was 72.94%; and the specificity was 72.42%. The results are shown in Table6
The area under the ROC curve of different hidden layer nodes with two hidden layers in the BP neural net-work model is shown in Table7
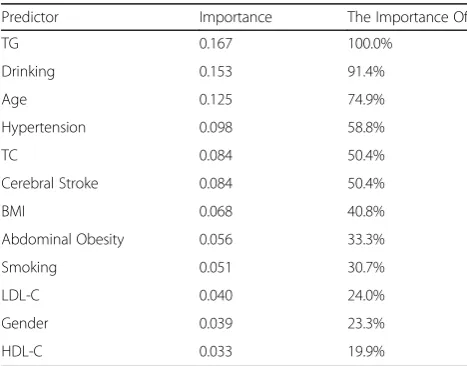
Finally, the BP neural network with 1 hidden layer and 5 hidden layer nodes was taken as the final prediction model. The BP neural network ranks the importance of predictor variables for different predictors, and the de-tails are shown in Table8
Dividing the predictor importance indicator by the max-imum indicator value yields a normalized predictor im-portance order. The results showed that the top five variables were TG (100.0%), alcohol consumption (91.4%), age (74.9%), hypertension (58.8%), and TC (50.4%). Using Table 1Comparison of the prevalence of type 2 diabetes in populations with different demographic characteristics (N= 4177)
Variables Levels Type 2 diabetes Prevalence (%) χ2 P
Gender Men 184 10.6 5.720 0.017
Women 205 8.4
Age < 70 314 8.5 23.801 < 0.001
≥70 75 15.3
Nation Han nationality 331 9.1 1.781 0.182
Minority 58 10.9
Place of residence Urban 215 9.4 0.042 0.837
Rural 174 9.2
Education level Primary or below 123 9.8 1.646 0.649
Junior middle school 133 9.4
Senior high school 77 8.3
College or higher 56 9.7
Marital status Married 321 9.2 0.111 0.739
Other 68 9.6
Occupation Physical work 228 9.0 2.639 0.267
Mental work 70 8.8
Retirement or other 91 10.8
Table 2Comparison of the prevalence of type 2 diabetes in different lifestyle groups (N= 4177)
Variables Levels Type 2 diabetes Prevalence (%) χ2 P Smoking Yes 115 10.9 4.005 0.045
No 274 8.8
Drinking Yes 119 13.4 22.315 < 0.001
the BP neural network model for prediction, with 0.5 as the predicted quasi-probability boundary value, the pre-diction accuracy of the model was 91.3% and the area under the ROC curve was 0.781 (95% Cl: 0.768–0.794). The results are shown in Table7
Decision tree model
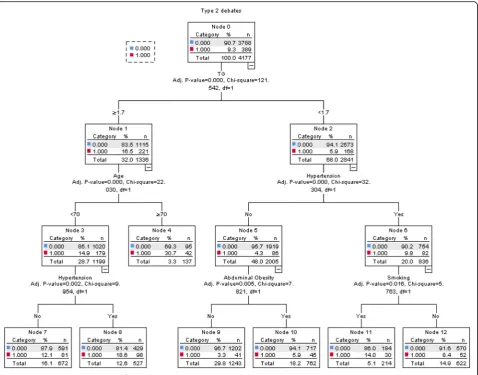
The decision tree for factors affecting the prevalence of type 2 diabetes is shown in Fig. 1. It can be seen from the figure that the first layer is TG, indicating that TG had the strongest correlation with type 2 diabetes and that the risk of type 2 diabetes was higher in people with higher TG than normal. The remaining variables were hypertension, age, smoking, and abdominal obesity. The accuracy of the prediction model was 90.7%, and the area under the ROC curve was 0.698 (95% CI: 0.684– 0.712). The sensitivity of the curve was 64.5%, and the specificity was 65.7%. The results are shown in Fig.1
Model comparison
The prediction accuracy of the three models and the area under the ROC curves are shown in Table 8. The area under the ROC curve is ranked from BP neural network model (0.780) to logistic regression model (0.711) to deci-sion tree model (0.698). Three models’AIC are 293.178, 281.895, 343.877. The results are shown in Table9
The areas under the ROC of different models are shown in Table 10. The results showed that the difference be-tween the ROC area values of the BP neural network model and the logistic regression model was statistically significant (P< 0.001), the difference between the ROC area values of the BP neural network model and the deci-sion tree model was statistically significant (P < 0.001), but the difference between the ROC area values of the logistic regression model and the decision tree model was not sta-tistically significant (P= 0.0711≥0.05).
Figure 2 shows the ROC curves of the three models. The ordinate is sensitivity, reflecting the ability of the Table 3Comparison of the prevalence of type 2 diabetes in different health status groups (N= 4177)
Variables Levels Type 2 diabetes Prevalence (%) χ2 P
BMI < 28 281 8.0 41.284 < 0.001
≥28 108 15.9
Abdominal obesity Yes 263 12.3 48.454 < 0.001
No 126 6.2
Hypertension Yes 215 14.7 77.458 < 0.001
No 174 6.4
Myocardial infarction Yes 6 12.0 0.434 0.510
No 382 9.3
Stroke Yes 23 17.8 11.439 0.001
No 365 9.0
Chronic obstructive pulmonary diseases Yes 13 13.5 2.072 0.150
No 375 9.2
Asthma Yes 11 13.4 1.651 0.199
No 377 9.2
Cancer Yes 7 6.7 0.901 0.343
No 380 9.4
Table 4Comparison of the prevalence of type 2 diabetes in different health status groups (N= 4177)
Variables Levels Type 2 diabetes Prevalence (%) χ2
P
TC Normal 210 7.3 46.512 < 0.001
Above normal 179 13.9
TG Normal 168 5.9 32.766 < 0.001
Above normal 221 16.5
LDL-C Normal 333 8.8 10.956 0.001
Above normal 56 13.9
HDL-C Normal 243 7.9 30.077 < 0.001
model to correctly identify a patient. The abscissa is 100-specific, reflecting the ability of the model to misjudge a patient. The larger the ordinate of the model, the smaller the abscissa. That is, the larger the area under the ROC curve and the closer to 1, the better the diagnostic effect of the model. As shown in Fig. 2, the BP neural network model has the largest area under the ROC curve, indicating that it has the best diagnostic value compared with the other two models
Discussion
Analysis of factors influencing type 2 diabetes
Multivariate logistic regression model, BP neural net-work model, and decision tree model predictions showed that the main risk factors for type 2 diabetes included TG, age, blood pressure, drinking, TC, waist circumference, and BMI. Among them, the most in-fluential factors associated with the onset of type 2
diabetes were TG (OR = 2.233), age (OR = 1.734), hypertension (OR = 1.703), alcohol consumption (OR =
1.674), and TC (OR = 1.463).
Hypertension, high triglycerides, and high total choles-terol were risk factors for diabetes and cardiovascular disease that have been previously confirmed [27]. This study showed that people aged 70 years and older were more susceptible to type 2 diabetes than those below 70. Most studies have presented the same result [28]. As age increases, collagen and elastin in blood vessels gradually decreases, the blood vessel wall becomes hard and brit-tle, blood pressure and blood lipids rise, and high density lipoprotein cholesterol decreases. The hardening and aging of blood vessels and the change in the normal function of the vascular wall caused by inflammatory re-actions and adipose tissue can also affect the expression of intracellular protein kinases, regulating the expression of inflammatory genes [29–31], affecting the normal function of islet β cells and reducing insulin secretion. Table 5Multivariate logistic regression analysis of factors affecting type 2 diabetes (N= 4177)
Variables Comparison Control β SE Waldχ2 P OR 95%C.l. for OR
Gender Women Men 0.053 0.143 0.135 0.713 1.054 0.796–1.396
Smoking Yes No 0.060 0.141 0.180 0.671 1.062 0.805–1.401
Drinking Yes No 0.515 0.147 12.305 < 0.001 1.674 1.255–2.232
Age ≥70 < 70 0.550 0.151 13.236 < 0.001 1.734 1.289–2.332
Abdominal Obesity Yes No 0.370 0.135 7.507 0.006 1.448 1.111–1.887
Hypertension Yes No 0.533 0.117 20.778 < 0.001 1.703 1.355–2.142
Cerebral Stroke Yes No 0.327 0.254 1.655 0.198 1.387 0.843–2.281
BMI 28~ < 28 0.279 0.140 3.952 0.047 1.321 1.004–1.739
TG Above normal Normal 0.803 0.129 38.869 < 0.001 2.233 1.735–2.875
TC Above normal Normal 0.381 0.129 8.693 0.003 1.463 1.136–1.885
LDL-C Above normal Normal −0.091 0.18 0.254 0.615 0.913 0.641–1.301
HDL-C Below normal Normal 0.116 0.131 0.782 0.376 1.123 0.868–1.453
Constant −3.569 0.165 467.666 0 0.028
Table 6Area under the ROC curve of different hidden layer nodes with one hidden layer in the BP neural network model (N= 4177)
Number of hidden layer nodes The area under ROC curve (95%Cl) Z P
1 0.725(0.711–0.738) 18.109 < 0.0001
2 0.737(0.723–0.750) 19.845 < 0.0001
3 0.746(0.732–0.759) 19.379 < 0.0001
4 0.755(0.741–0.768) 21.893 < 0.0001
5 0.780(0.767–0.792) 24.931 < 0.0001
6 0.778(0.765–0.790) 23.229 < 0.0001
7 0.765(0.752–0.778) 22.774 < 0.0001
8 0.754(0.741–0.767) 22.532 < 0.0001
9 0.735(0.721–0.748) 19.015 < 0.0001
Hypertension often coexists with diabetes [32], which may have a common risk factor, such as obesity.
This study suggests drinking is a risk factor for type 2 diabetes. Studies have shown that [33] moderate drinking can improve insulin sensitivity, increase high-density lipo-protein cholesterol and adiponectin levels, and reduce in-flammation, but heavy drinking increases energy intake and causes obesity, impairs liver function, and increases the pancreatic burden, which accelerate the progression of diabetes. Therefore, to control the prevalence of diabetes and its complications, smoking and drinking should be an important target for prevention and control.
Abdominal obesity and BMI > 28 are both considered obese and have been proven to be important risk factors for many chronic, non-communicable diseases. Adipose tis-sue can release a large number of inflammatory cytokines and biologically active regulatory factors that aggravate the body’s oxidation. The agonistic reaction produces an in-flammatory reaction, affects the secretion and regulation of
insulin, and causes the body to produce insulin resistance, which affects the stability of blood sugar levels.
Diabetes risk prediction
BP neural network model
The results of this study showed that when predicting the risk of type 2 diabetes, the prediction accuracy of the BP neural network model was 91.2% and the area under the ROC curve was 0.780. The BP neural network model was better than the logistic regression model and the decision tree model both in accuracy and the area under the ROC curve, and the differ-ence between them was statistically significant (P< 0.05).
Compared with the logistic regression model, the BP neural network model is not affected by the interactions be-tween variables and has nonlinear mapping abilities, self-learning and self-adaptive abilities, generalization abilities, and fault tolerance. It can handle complexities better than other models. The data have been widely used in the med-ical field. There have been many studies on BP neural net-works in the past. In Shi HY et al. [15], artificial neural network and logistic regression models were used together to predict in-hospital mortality after traumatic brain injury surgery. The results showed that the artificial neural net-work was a better prediction model in terms of accuracy and area under the ROC curve. Li Lixia et al. [34] used a lo-gistic regression model and a BP neural network model to predict liver cancer and also concluded that the BP neural network model was superior to the logistic regression model. When the BP neural network model was established in this paper, the area under the ROC curve with 1 layer and 2 layers of hidden layers and different hidden layer nodes was selected. The comparison result was that when the hidden layer was set to 1, the number of hidden layer nodes was 5. The area under the ROC curve was the lar-gest, and the prediction ability was the best. Previous stud-ies have shown that BP neural networks with a hidden layer of 1 better predict ischemic stroke [35]. However, the BP Table 7Area under ROC curve of different hidden layer nodes with two hidden layers in the BP neural network model (N= 4177)
Number of first hidden layer nodes Number of second hidden layer nodes The area under ROC curve (95%Cl) Z P
4 1 0.724(0.710–0.737) 18.900 < 0.0001
4 2 0.736(0.722–0.747) 18.895 < 0.0001
4 3 0.745(0.731–0.758) 20.495 < 0.0001
4 4 0.748(0.734–0.761) 19.944 < 0.0001
5 1 0.752(0.739–0.765) 19.326 < 0.0001
5 2 0.760(0.746–0.773) 23.355 < 0.0001
5 3 0.753(0.740–0.766) 19.337 < 0.0001
5 4 0.750(0.737–0.763) 20.810 < 0.0001
6 1 0.741(0.725–0.752) 19.730 < 0.0001
6 2 0.742(0.726–0.753) 20.365 < 0.0001
6 3 0.740(0.724–0.751) 19.095 < 0.0001
6 4 0.737(0.721–0.748) 18.460 < 0.0001
Table 8Importance of variables for predicting type 2 diabetes (N= 4177)
Predictor Importance The Importance Of
TG 0.167 100.0%
Drinking 0.153 91.4%
Age 0.125 74.9%
Hypertension 0.098 58.8%
TC 0.084 50.4%
Cerebral Stroke 0.084 50.4%
BMI 0.068 40.8%
Abdominal Obesity 0.056 33.3%
Smoking 0.051 30.7%
LDL-C 0.040 24.0%
Gender 0.039 23.3%
neural network model also has many shortcomings, such as an (1)“overfitting” phenomenon. If the BP neural network is too detailed from the training sample, the learned model does not correctly reflect the law applied in the sample. Therefore, grasping the degree of learning and the correct generation of rules is essential. (2) Determination of the number of hidden layers is also a shortcoming. There is no theoretical guidance for the choice of the number of layers and the number of cells in the hidden layer of the network, which are generally determined by experience or after re-peated experiments. Most of the existing research results show that a hidden BP neural network can reflect the data rules and characteristics well. When the BP neural network
model was established in this paper, the area under the ROC curve when the number of hidden nodes was 1 or 2 was compared. The results showed that the prediction was better when the number of hidden layers was 1. (3) The BP neural network cannot judge whether the variable is a pro-tective factor or a risk factor. (4) The model cannot per-form hypothesis testing or medical interpretation of the weighted coefficients.
Decision tree model
The decision tree model had a short computation time, and the results were simple and intuitive to display in a tree. The classification power of the results was more accurate. Fig. 1Decision tree model diagram of type 2 diabetes
Table 9Areas under the ROC curves for the three models
Predictive model Accuracy AUC SE 95%Cl P AIC
Logistic Regression model 90.8 0.711 0.0137 0.697–0.724 < 0.0001 293.178
BP Neural network model 91.2 0.780 0.0128 0.767–0.792 < 0.0001 281.895
However, when the classification increased, it affected the prediction results [36]. The decision tree model can only process categorical variables. Continuous variables cannot be included. Moreover, a common shortcoming of the BP neural network model and decision tree model is that the direction of the variable cannot be explained. The research factor cannot be judged to be a risk factor or a protective factor, whereas the logistic regression model can explain the direction of the variable well. The area under the ROC curve of the decision tree model in this paper was the smal-lest of the three prediction models, and the difference be-tween the BP neural network model and the logistic regression model was statistically significant. Some scholars have compared decision trees with other statistical models. Li Xianwen et al. [37] found that the prediction of a logistic regression model was better than that of a decision tree model in a study of health literacy in hypertensive patients, in agreement with the results of this paper.
Rapid and effective prediction of the risk of type 2 dia-betes can allow for preventative actions to be taken by members of high-risk groups. The results of this study showed that the BP neural network model was a good predictive model for type 2 diabetes, but for practical
applications, the logistic regression model can explain the variables and results more intuitively. The BP neural network model and the decision tree model lack the ability to interpret results. Therefore, for practical appli-cations, it is necessary to combine the advantages and disadvantages of each model and select the appropriate model to obtain the highest value in practice.
Conclusions
BP neural networks have a higher predictive power for identifying the associated risk factors of type 2 diabetes than Logistic regression model and decision tree model, but it is necessary to select a suitable model for specific situations.
Abbreviations
ROC:Relative operating characteristic curve; TG: Triglyceride; TC: Total cholesterol; OR: Odds ratio; AUC: Areas under curve; DM: Diabetes mellitus; BP: Back propagation; OGTT-2 h: Anhydrous glucose for 2 h; HbA1c: Glycated haemoglobin; LDL-C: Low density lipoprotein cholesterol; HDL-C: High density lipoprotein cholesterol; VIF: Variance inflation factor
Acknowledgements
Not applicable.
Author contributions
SL had the original idea for the study, and, with all co-authors, carried out the design. YG and PS provided valuable insight regarding the methodo-logical approach and organization of the manuscript. YS and JL were respon-sible for data collection. SL and MZ conduct data analyses. SL drafted the manuscript, which was revised by all authors. All authors read and approved the final manuscript.
Funding
The work was supported by funding from Ministry of Finance, National Health and Family Planning Commission (grant number: [2016]50). These organizations had no role in the design and conduct of the study; collection, management, analysis, and interpretation of the data; preparation, review, or approval of the manuscript; or the decision to submit the manuscript for publication.
Availability of data and materials
The datasets used and analysed during the current study are available from the corresponding author on reasonable request.
Ethics approval and consent to participate
The ethics were approved by the Ethics Committee of Fuwai Hospital of Chinese Academy of Medical Sciences (project identification code: 2014– 574), and written informed consent was obtained from all of the participants before data collection.
Consent for publication
Not applicable.
Competing interests
The authors declare that they have no competing interests.
Received: 10 December 2018 Accepted: 13 November 2019
References
1. Organization WH. Non-communicable diseases country profiles, vol. 50. Geneva: World Health Organization; 2011.
2. Chestnov O, Riley L, Bettcher DW. Liberating data: the WHO response. Lancet Diabetes Endocrinol. 2016;4(8):648.
3. Wild S, Roglic G, Green A, Sicree R, King H. Global prevalence of diabetes: estimates for the year 2000 and projections for 2030. Diabetes Care. 2004;27(5):1047–53.
Table 10Comparison of the area under the ROC of the three models
Predictive model SE Z P
BP Neural network model vs Logistic Regression model
0.0111 6.210 < 0.001
Logistic Regression model vs Decision tree model
0.0100 1.310 0.190
BP Neural network model vs Decision tree model
0.0108 7.649 < 0.001
4. Yanan Z: Research on risk prediction of type 2 diabetes mellitus based on data mining technology. Master Thesis.Yanshan University; 2017. 5. Lihua Z, Li Q, Lihua W, Li R, Yu Z, Jumei X, Jingwei L. Study on the effect of
experiential health education on diabetic complications. Chin J Nurs. 2018; 53(01):36–40.
6. van Dieren S, Beulens JW, van der Schouw YT, Grobbee DE, Neal B. The global burden of diabetes and its complications: an emerging pandemic. Eur J Cardiovasc Prevention Rehab. 2010;17(Suppl 1):S3–8.
7. Chang C. Progress in diabetes prevention and health education. Chin J Health Educ. 2008;10:790–2.
8. Norris SL, Kansagara D, Bougatsos C, Fu R. Force USPST: screening adults for type 2 diabetes: a review of the evidence for the U.S. preventive services task force. Ann Intern Med. 2008;148(11):855–U882.
9. Yumei H, Yanan Z, Lichun Z, Song W, Qiuye G. Application of decision tree model in predicting the risk of type 2 diabetes. Chin J Health Stat. 2016; 33(06):976–978+982.
10. Knowler WC, Barrett-Connor E, Fowler SE, Hamman RF, Lachin JM, Walker EA, Nathan DM. Reduction in the incidence of type 2 diabetes with lifestyle intervention or metformin. N Engl J Med. 2002;346(6):393–403.
11. Perreault L, Pan Q, Mather KJ, Watson KE, Hamman RF, Kahn SE. Effect of regression from prediabetes to normal glucose regulation on long-term reduction in diabetes risk: results from the Diabetes Prevention Program Outcomes Study. Lancet (London, England). 2012;379(9833):2243–51. 12. Wang C, Li L, Wang L, Ping Z, Flory MT, Wang G, Xi Y, Li W. Evaluating the
risk of type 2 diabetes mellitus using artificial neural network: an effective classification approach. Diabetes Res Clin Pract. 2013;100(1):111–8. 13. Kang S. Personalized prediction of drug efficacy for diabetes treatment via
patient-level sequential modeling with neural networks. Artif Intell Med. 2018;85:1–6.
14. SM SYK, Jung DC. Pre-operative prediction of advanced prostatic cancer using clinical decision support systems: accuracy comparison between support vector machine and artificial neural network. Korean J Radiol. 2011;12(5):588–94. 15. Shi HY, Hwang SL, Lee KT, Lin CL. In-hospital mortality after traumatic brain
injury surgery: a nationwide population-based comparison of mortality predictors used in artificial neural network and logistic regression models. J Neurosurg. 2013;118(4):746–52.
16. Perez-Gandia C, Facchinetti A, Sparacino G, Cobelli C, Gomez EJ, Rigla M, de Leiva A, Hernando ME. Artificial neural network algorithm for online glucose prediction from continuous glucose monitoring. Diabetes Technol Ther. 2010;12(1):81–8.
17. Zarkogianni K, Mougiakakou SG, Prountzou A, Vazeou A, Bartsocas CS, Nikita KS. An insulin infusion advisory system for type 1 diabetes patients based on non-linear model predictive control methods. Conf Proc IEEE Eng Med Biol Soc. 2007;2007:5972–5.
18. Jinqiu Y, Yali L, Kehu Y. Application progress of data mining technology based on artificial neural network in clinical practice. Library Info. 2010;03:95–8. 19. S W: Study on the status of adult chronic diseases and their risk factors in
Jilin Province.博士.Jilin University; 2015.
20. Jian S, Quanyong X, Shurong L, Xiaoqun P, Yu T, Jie Y, Jinyi Z, Yongqing Z, Ming W, Ran T. Relationship between body mass index, waist circumference and hypertension, diabetes and dyslipidemia in adults. Chin J Dis Control Prevent. 2015;19(07):696–700.
21. Group CMAEBO. Chinese adult obesity prevention expert consensus. Chin J Endocrinol Metabol. 2011;27(9):711–7.
22. Yuan H, Qiang Z, Xiaolan Z. Correlation between obesity, central obesity and hypertension and diabetes in Chinese adults. Military Med Res. 2015; 40(10):803–8.
23. Jia W, Xiang K, Zhu J, Lu J, Zhang X, Bao Y, Wang C, Yang M, Lu H, Li H. Optimal waist circumference cutoffs for abdominal obesity in Chinese. Atherosclerosis. 2008;201(2):378–84.
24. China's guidelines for the prevention and treatment of hypertension are released, continue to use the diagnostic criteria of 140/90 mmHg.Chinese Journal of Evidence-based Cardiovascular Medicine2018,10(09):1098. 25. Ming Z, Xiaoxia W, Xiaowei Z. Understanding the diabetes from the
evolution of diabetes diagnostic criteria. J Diagnostics Concepts Practice. 2014;13(02):226–8.
26. Junren Z, Runlin G, Shuiping Z, Guoping L, Dong Z, Jianjun L. Guidelines for the prevention and treatment of dyslipidemia in Chinese adults (revised edition 2016). China Circulation Magazine. 2016;31(10):937–53.
27. Xu F, Tavintharan S, Sum CF, Woon K, Lim SC, Ong CN. Metabolic signature shift in type 2 diabetes mellitus revealed by mass spectrometry-based metabolomics. J Clin Endocrinol Metab. 2013;98(6):E1060–5. 28. Liu M, Pan C, Jin M. A Chinese diabetes risk score for screening of
undiagnosed diabetes and abnormal glucose tolerance. Diabetes Technol Ther. 2011;13(5):501–7.
29. van Bussel BC, Schouten F, Henry RM, Schalkwijk CG, de Boer MR, Ferreira I, Smulders YM, Twisk JW, Stehouwer CD. Endothelial dysfunction and low-grade inflammation are associated with greater arterial stiffness over a 6-year period. Hypertension (Dallas, Tex : 1979). 2011;58(4):588–95. 30. Villarreal-Molina MT, Antuna-Puente B. Adiponectin: anti-inflammatory and
cardioprotective effects. Biochimie. 2012;94(10):2143–9.
31. Qingqing W, Jisha D, Yi H, Ying C. Relationship between diabetes and stroke. Modern Med Health Res E-Magazine. 2018;2(14):154–5. 32. Zhong X, Jinkui Y. Advances in the relationship between pre-diabetes
susceptibility genes and environmental risk factors and type 2 diabetes. Clin Metaphor. 2008;08:601–3.
33. Jin L, Huang Y, Bi Y, Zhao L, Xu M, Xu Y, Chen Y, Gu L, Dai M, Wu Y, et al. Association between alcohol consumption and metabolic syndrome in 19,215 middle-aged and elderly Chinese. Diabetes Res Clin Pract. 2011;92(3): 386–92.
34. Lixia L, Tong W, Fengxi F. Comparative study of BP neural network and logistic regression. Chin J Health Stat. 2005;03:138–40.
35. Ying T, Dele G, Shuiping H. Establishing a predictive model of recurrent ischemic stroke with artificial neural network. Chin J Health Stat. 2013;30(05): 687–9.
36. Yunlian X. Application of logistic regression combined with decision tree technique in hospitalization cost combination analysis of patients with coronary heart disease. Chin J Health Stat. 2015;32(06):988–989+992. 37. Xianwen L, Chunyu L, Kim M, Zhenji L, Degao H, Qinshu Z, Jinji J.
Application of decision tree and logistic regression in predicting health literacy of patients with hypertension. Nurse Training Magazine. 2012;27(13): 1157–9.
Publisher’s Note