Abstract:
Recently, the distribution of dental caries has been shown to be skewed, and precise prediction models cannot be obtained using all the data. We applied a balancing technique to obtain more appropriate and robust models, and compared their accuracy with that of the conventional model. The data were obtained from annual oral check-ups for schoolchildren conducted in Japan. Five hundred children were followed from ages 5 to 8, and the three-year follow-up data were used. The variables used were salivary levels of mutans streptococci and lactobacilli, 3-min stimulated saliva volume, salivary pH, fluoride usage, and frequency of consumption of sweet snacks and beverages. Initially, conventional models were constructed by logistic regression analysis, neural network (a kind of prediction method), and decision analysis. Next, the balancing technique was used. To construct new models, we randomly sampledthe same number of subjects with and without new dental caries. By repeated sampling, 10 models were constructed for each method. Application of the balancing technique resulted in the most robust model, with 0.73 sensitivity and 0.77 specificity obtained by C 5.0 analysis. For data with a skewed distribution, the balancing method could be one of the important techniques for obtaining a suitable and robust prediction model for dental caries. (J Oral Sci 51, 61-68, 2009)
Keywords: dental caries; predictor; data mining.
Introduction
Many attempts have been made to predict the future incidence of dental caries. Nearly two decades ago, a risk assessment conference was held at the University of North Carolina and the study group arrived at the following conclusions: Clinical variables are stronger than nonclinical variables; past caries experience is the most significant predictor; other important variables are socioeconomic status, fluoride exposure, tooth morphology and microbial agents; and regression models using multiple factors and longitudinal data are preferred (1). This concept may have Journal of Oral Science, Vol. 51, No. 1, 61-68, 2009
Correspondence to Dr. Yoh Tamaki, Department of Policy Sciences, National Institute of Public Health, 2-3-6 Minamai, Wako, Saitama 351-0197, Japan
Tel: +81-48-458-6179 Fax: +81-48-468-7983 E-mail: [email protected]
Construction of a dental caries prediction model
by data mining
Yoh Tamaki
1,2), Yoshiaki Nomura
3,4), Seiko Katsumura
5),
Ayako Okada
3), Hidenori Yamada
6), Shinpei Tsuge
7), Yoshinori Kadoma
8)and Nobuhiro Hanada
3,4)1)
Department of Policy Sciences, National Institute of Public Health, Saitama, Japan
2)
Division of Oral Health, Department of Health Science, Kanagawa Dental College, Kanagawa, Japan
3)Department of Oral Health, National Institute of Public Health, Saitama, Japan
4)
Department of Translational Research, Tsurumi University School of Dental Medicine, Kanagawa, Japan
5)The Second Department of Anatomy, Tsurumi University School of Dental Medicine, Kanagawa, Japan
6)
Department of Preventive Dentistry and Public Health, Tsurumi University School of Dental Medicine,
Kanagawa, Japan
7)
Gifu Dental Association, Gifu, Japan
8)
Department of Applied Functional Molecules, Division of Biofunctional Molecules, Institute of Biomaterials
and Bioengineering, Tokyo Medical and Dental University, Tokyo, Japan
(Received 4 July and accepted 11 December 2008)remained valid even to date.
Powell reviewed 33 articles and stated that since individual prediction models are developed for different purposes, it is difficult to select the best prediction model (2). The main result of this review was that the multifactorial prediction model was useful. The most commonly used method in the selected models was logistic regression, followed by linear discriminate analysis. Classification and regression tree analysis (CART) and Poisson regression analysis were used only in one paper each.
Recently, the prevalence of dental caries has shown a tendency to decline. High caries prevalence tends to be concentrated among a limited population of children, and thus the distribution of dental caries has become skewed. This tendency has been observed since 1985 (3). Under these conditions, conventional regression models such as logistic regression models and linear discriminant analysis are not always appropriate for the following reasons. It is well known that when applying logistic regression analysis to small samples or unbalanced independent variables, asymptotic solution of the odds ratio obtained by the maximum likelihood estimate is not guaranteed.
With advances in computer technology, the principle of data mining has been developed. This technique has been applied mainly in marketing. However, this methodology or concept is gradually being applied to medical research such as bioinformatics including gene expression profiles or proteomics (4,5), public health surveillance (6) and clinical decision making (7). Data mining aims to identify associations, anomalies, and statistically significant patterns in large volumes of data. Data mining is applied for practical use rather than theory establishment. In general, a proportion of the data are used to construct certain models by some methods, then the models are verified using the remaining data or more models are constructed by resampling the data, eventually allowing selection of the most useful model. These are called cross-validation or bootstrap methods, and are one of the characteristics of data mining. The reason for the above procedures is to obviate the problem of overfitting data to the model. One of the critical purposes of data mining is to examine how well its results can be generalized to the other data set. The main reason for construction of an unreliable model is overfitting of the data (8). In general, if the data are overfitted, then the model will explore the minute characteristics of the data, and will not be appropriate for application to other samples.
In this study, we attempted to construct a dental caries prediction model using data mining. Employing random sampling with a balancing technique, we tried to construct some models from a single database (9). The present
report describes a new method for deriving a caries prediction model using data mining.
Materials and Methods
Study population
The study population was a sample of pre-elementary schoolchildren (5 or 6 years old) residing in the Ena and Nakatsugawa areas of Gifu Prefecture, Japan. According to the water quality standards of the Japan Waterworks Law, the fluoride concentration of tap water should be kept at a level not exceeding 0.8 ppm. However, the concentration of fluoride in the public water supply in most districts of Japan has been reported to be less than 0.1 ppm (10,11). Among a total of 30 elementary schools in the two districts, 13 (9 from Ena and 4 from Nakatsugawa) were sampled. The children and parents were informed of the survey in a letter sent to each family regarding their entrance to elementary school. A total of 560 children participated in this study. Twelve children dropped out before the baseline examinations. The primary reasons for drop-out were relocation and missing check-ups due to illness. After 2.5 years of follow-up, 48 children (8.6%) had dropped out. The reasons were missing at least one check-up and relocation. We obtained clinical samples and completed questionnaires during the preschool medical check-ups, and also obtained informed consent. Details have been described in our previous report (12).
Clinical examination and clinical samples
Dentists conducted oral examinations under artificial light using dental mirrors. Dental conditions were scored as sound, decayed or filled. The decayed or filled teeth were identified according to the WHO standard method and criteria (13). Saliva samples were collected by asking subjects to chew a gum base containing no flavor additives for 3 min. The 3-min chewing stimulated salivary flow, and salivary buffering capacity was evaluated using pH testing paper (Toyoroshi, Tokyo, Japan).
Microbial procedures
To estimate mutans streptococci (MS) and lactobacilli (LB) in saliva, we performed microbial procedures according to the methods described previously (14,15). The saliva samples were vortexed for ten seconds and inoculated onto Mitis-Salivarius agar (MS; Difco, Tokyo, Japan) medium for total streptococci. Other media used were Rogosa SL agar medium (Nippon Becton Dickinson Company, Ltd. Tokyo, Japan) for lactobacilli, and modified MSB agar medium for mutans streptococci, which is MS agar supplemented with 20% sucrose (Wako Pure Chemicals Co., Osaka, Japan), 20 mg/ml yeast extract
(Becton Dickinson MD, USA), 0.25 U bacitracin (Sigma, Inc., St. Louis, MO, USA), 10 mg/ml colistin (Wako Pure Chemicals Co., Osaka, Japan), 10 mg/ml nalidixic acid (Wako), 4 mg/ml gramicidin (Sigma), and 1% tellurite solution (16,17). These media were inoculated using an Eddy Jet spiral system (Gunze Sangyo, Inc., Tokyo, Japan). MS and modified MSB agar media were incubated for 48 h anaerobically for 74 h. After the anaerobic incubation, we counted the colonies to determine the number of bacteria on each agar medium using a spiral system counting grid, and the count per ml whole saliva was calculated.
Questionnaires
Questionnaires were distributed by post, along with a notification of the requirements for school participation. The questionnaires were collected at preschool medical check-ups. The questionnaire consisted of five items concerning fluoride use and diet. Fluoride use was evaluated on the basis of daily use of fluoride-containing dentifrices (yes or no), a history of professional topical fluoride at a private dental office or at usual health care check-ups (yes or no) and daily use of mouthwash containing fluoride (yes or no). The questionnaire on dietary sugar intake consisted of two items: the frequency of drinking sweet juice, and the frequency of eating sweet snacks (once, twice, three times or more than four times per day).
Modeling and its assessment
A descriptive analysis of the baseline data has been given in our previous report (12). Before the analysis, patients were divided into two groups: those with incident dental caries and those without incident caries of permanent teeth during the follow-up period of 2 and a half years. To analyze microbiological factors, the bacteriological counts were log10-transformed prior to statistical analysis to normalize the variances.
First, we used all the data for conventional modeling. The methods of modeling were logistic regression analysis, neural network, and C 5.0. C 5.0 is a tool for discovering patterns and regularities in databases, presenting them in an intelligible form, and using them to make predictions. A C 5.0 model works by splitting the sample based on the field that provides the maximum information gain. Each subsample defined by the first split is then split again, usually based on a different field, and the process repeats until the subsamples cannot be split any further. Finally, the lowest level splits are reexamined, and those that do not contribute significantly to the value of the model are removed or pruned (9). For logistic regression analysis, all the predictors were first entered, and then a stepwise
method was used to improve the precision. The neural network model was constructed with 12 input layers, 3 hidden layers and 1 output layer. For C 5.0 analysis, 10-fold cross-validation was used.
Next, the balancing technique was applied. A data set was constructed containing all 74 subjects with incident dental caries and a roughly equal number of subjects randomly sampled from the subjects without incident caries. By random sampling of the subjects without incident caries 10 times, 10 independent data sets were obtained. Using these samples, 10 models were constructed for each of the methods described above. For model assessment, the 10 balanced sample sets were applied to the models. Then sensitivity and specificity were calculated for each sample. Model selection was performed by choosing the highest mean of the sum of sensitivity and specificity. This modeling and assessment were performed using Clementine ver 9.0 (SPSS, Tokyo Japan).
Results
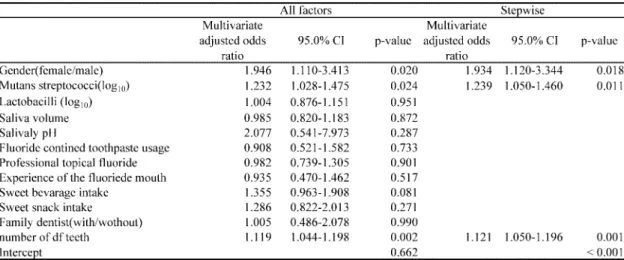
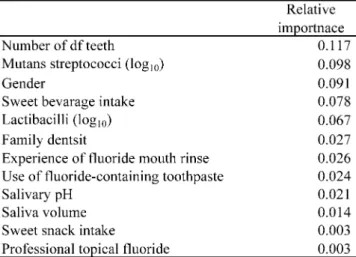
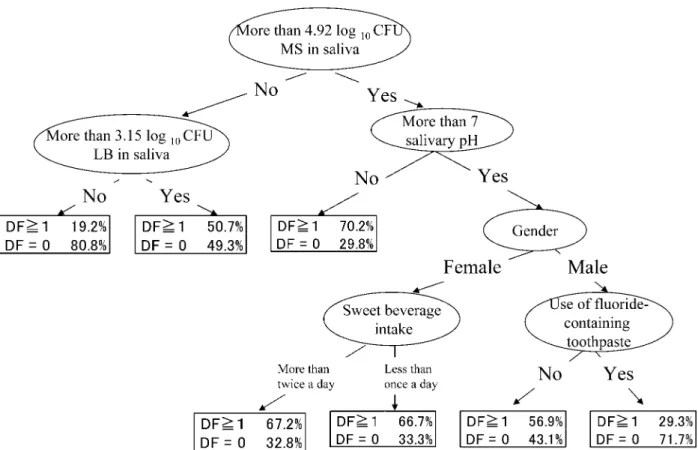
The mean number of decayed and filled (DF) teeth was 0.054 ± 0.327 at the baseline and 0.256 ± 0.721 after 2.5 years. In this study, 74 of the 500 subjects had new incident dental caries of permanent teeth (14.8%). First, we used all the data and conducted the logistic regression analysis, neural network and decision analysis. Results of the logistic regression analysis and decision analysis are given in Table 1 and Fig. 1, respectively. The results of relative importance obtained by neural network are shown in Table 2.
First the above models were assessed using all the data. Sensitivity and specificity were calculated to evaluate these models. Cross-tabulation of the observed group versus the predicted group, and the sensitivity and specificity of each model are shown in Table 3. Although high specificity was obtained, most of the samples were predicted to have no incident dental caries. On the other hand, sensitivity was very low. Thus, these models were not appropriate for predicting incident dental caries in these subjects.
Next, a balancing technique was applied to assess the above models constructed from whole data (Table 4). Cross-tabulation was performed on all the subjects with incident dental caries (n = 74) versus a similar-sized sample (n = around 70) randomly selected from subjects without incident dental caries. An example of the tabulation is shown in Table 4 (A). By the same procedures, 10 samples of subjects without incident caries were selected independently and tabulation was conducted. Sensitivity and specificity were calculated for each tabulation, and the mean and standard deviation of these parameters for 10
tabulations are shown in Table 4 (B). Most of the subjects were classified into the no incident caries group and the sensitivities were low. From these assessments, we concluded that the conventional models are not appropriate for predicting subjects who will have incident dental caries.
Then, using the data sets obtained by the balancing technique, 10 models were constructed by logistic
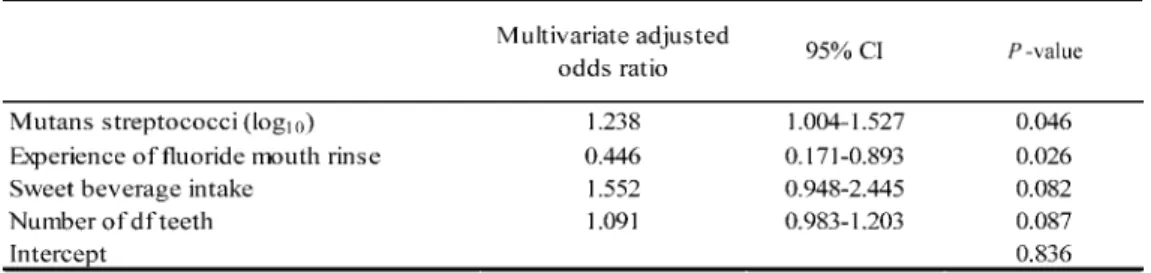
regression, neural analysis and C 5.0 analysis. The most robust models obtained by the three methods using the balancing technique are shown in Table 5 and Fig. 2. The evaluation of these models is shown in Table 6. Even when these models were evaluated by applying all the data, the sensitivity was clearly improved. From the evaluation results, the model obtained by decision analysis was most useful for prediction of incident dental caries in this young
Table 1 Odds ratio obtained by conventional logistic regression analysis constructed by whole date
Fig. 1 The results of C 5.0 analysis using all the data. MS: mutans streptococci, LB: lactobacilli
school-aged population.
Discussion
Use of the highest predictive model constructed using randomly sampled data in this study showed that subjects having high MS levels in saliva are at high risk of dental caries. The presence of both S. mutansand S. sobrinusis
more strongly correlated with early caries lesions than the presence of S. mutansalone (18,19), although in this study we could not observe any difference between S. mutans
and S. sobrinusdue to the cost and effort involved. Our results suggest that these salivary MS and LB tests could be useful for predicting caries in primary and mixed dentition. In this predictive model, salivary pH and gender were predictive indicators of the incidence of new dental caries. Also, a high consumption of sweet beverages was a risk indicator for dental caries in young children.
The methodology of data mining is broadly classified into two groups: supervised and unsupervised. For unsupervised methods such as clustering and principal component analysis, the main objective is to detect a special pattern. For supervised methods including the conventional regression method, neural network and decision analysis, the most important goal is prediction.
For prediction, the robustness of the model is one of the most important factors. Gansky et al. used the data of the Rochester Caries Study and constructed prediction models by logistic regression, neural network and decision analysis (20). They concluded that the prediction performance of the neural network approach is better than that of logistic regression or decision analysis.
In this study, the most robust model was obtained by decision analysis. The relationship between the predictors and response may be non-linear and include interactions
Table 2 Relative importance obtained by the conventional neural network model constructed by whole data
Table 5 Multivariate adjusted odds ratio obtained by logistic regression analysis and relative importance obtained by neural network analysis in the most accurate model
between the predictors. Decision analysis is, in particular, highly adaptable to nonparametric procedures for predictive patterns and detection of interactions among the predicting variables. Unlike regression models, decision analysis is robust for outliers. In addition, the results are easy to understand, explain and apply. In this study, we used C 5.0 for the decision analysis. Classification and regression tree (CART) is the major method used in decision analysis. The differences between C 5.0 and CART are in the way of splitting criteria, pruning method and noisy handling. In our preliminary analysis, more robust models were
obtained by C 5.0 than by CART, and therefore we adopted C 5.0 analysis.
For dental caries prediction models, the target performance is 0.75 sensitivity and 0.85 specificity (21). Most of the models reviewed by Powell did not attain this target (2). Our default model using all the data had a sensitivity of less than 0.2 and a specificity greater than 0.9, while the most robust model shown in Fig. 2 had a sensitivity of 0.73 and a specificity of 0.77. Although even the most robust model in this study did not satisfy the target criteria, the accuracy of this model is not inferior
Table 6 Using randomly sampled data and all data to evaluate the most accurate model in each method
Fig. 2 C 5.0 analysis: the highest predictive model constructed using randomly sampled data. MS: mutans streptococci
compared to the models in Powell’s review. However, the sample used in this study was only one study population, and whether it is representative of the general Japanese population has not been confirmed. Further study is needed to expand the population to other regions or nations. In addition, to improve the sensitivity of the caries prediction model, other parameters will have to be explored. The balancing technique could be a useful tool for construction of robust and accurate models.
References
1. Beck JD, Weintraub JA, Disney JA, Graves RC, Stamm JW, Kaste LM, Bohannan HM (1992) University of North Carolina Caries Risk Assessment Study: comparisons of high risk prediction, any risk prediction, and any risk etiologic models. Community Dent Oral Epidemiol 20, 313-321. 2. Powell LV (1998) Caries prediction: a review of the
literature. Community Dent Oral Epidemiol 26, 361-371.
3. Bohannan HM, Klein SP, Disney JA, Bell RM, Graves RC, Foch CB (1985) A summary of the results of the National Preventive Dentistry Demonstration Program. J Can Dent Assoc 51, 435-441.
4. Roden JC, King BW, Trout D, Mortazavi A, Wold BJ, Hart CE (2006) Mining gene expression data by i n t e r p r e t i n g p r i n c i p a l c o m p o n e n t s . B M C Bioinformatics 7, 194.
5. Morand JP, Macri J, Adeli K (2005) Proteomic profiling of hepatic endoplasmic reticulum-associated proteins in an animal model of insulin resistance and metabolic dyslipidemia. J Biol Chem 280, 17626-17633.
6. Madigan EA, Curet OL (2006) A data mining approach in home healthcare: outcomes and service use. BMC Health Serv Res 6, 18.
7. Kircher A, Granfeldt H, Babic A, Antonsson J, Lönn U, Ahn HC (2000) Knowledge representation forms for data mining methodologies as applied in thoracic surgery. Proc AMIA Symp, 428-432. 8. Harrell FE Jr (2001) Regression modeling strategies
with applications to linear models, logistic regression and survival analysis. Springer Verlag, New York, 35-48.
9. Clementine8.0 User’s Guide. SPSS Inc, Chicago 10. Takeuchi K, Nakagaki H, Toyama Y, Kimata N, Ito F, Robinson C, Weatherell JA, St-osser L, Künzel WT (1996) Fluoride concentrations and distribution in premolars of children from low and optimal fluoride areas. Caries Res 30, 76-82.
11. Mihata T, Toda S, Komiyama M, Kushida M, Song W, Arakawa H, Uchimura N, Iizuka Y (1999) Study on the fluoride concentration in drinking water in Japan. Results around Kanto area. Kouku Eisei Gakkai Shi 49, 294-30. (in Japanease)
12. Nomura Y, Tsuge S, Hayashi M, Sasaki M, Yamauchi T, Nobuyoshi U, Hanada N (2004) A survey on the risk factors for the prevalence of dental caries among preschool children in Japan. Pediatric Dental Journal 14, 79-85.
13. Barmes DE, Infirri JS (1977) WHO activities in oral epidemiology. Community Dent Oral Epidemiol 5, 22-29.
14. Hamada S, Masuda N, Ooshima T, Sobue S, Kotani S (1976) Epidemiological survey of Streptococcus mutansamong Japanese children. Identification and serological typing of the isolated strains. Jpn J Microbiol 20, 33-44.
15. Juárez Tomás MS, Bru de Labanda E, de Ruiz Holgado AP, Nader-Macías ME (2002) Estimation of vaginal probiotic lactobacilli growth parameters with the application of the Gompertz model. Can J Microbiol 48, 82-92.
16. Hanada N, Imai S, Nishizawa T, Fukushima K, Mukasa H (2003) Clinical biology of the mutans streptococci. Quintessenz, Tokyo, 82-89. (in Japanease)
17. Katsumura S, Nishikawara F, Tamaki Y, Nakamura Y, Sato K, Nomura Y, Hanada N (2007) A randomized controlled trial by the 3DS for dental caries. Pediatric Dent J 17, 1-7.
18. Köhler B, Bjarnason S, Finnbogason SY, Holbrook WP (1995) Mutans streptococci, lactobacilliand caries experience in 12-year-old Icelandic urban children, 1984 and 1991. Community Dent Oral Epidemiol 23, 65-68.
19. Babaahmady KG, Challacombe SJ, Marsh PD, N ew m a n H N ( 1 9 9 8 ) E c o l o g i c a l s t u d y o f
Streptococcus mutans, Streptococcus sobrinusand
Lactobacillus spp. at sub-sites from approximal dental plaque from children. Caries Res 32, 51-58. 20. Gansky SA (2003) Dental data mining: potential pitfalls and practical issues. Adv Dent Res 17, 109-114.
21. Disney JA, Graves RC, Stamm JW, Bohannan HM, Abernathy JR, Zack DD (1992) The University of North Carolina Caries Risk Assessment study: further developments in caries risk prediction. Community Dent Oral Epidemiol 20, 64-75.