METHODOLOGY
Identification of vocal individuality
in male cuckoos using different analytical
techniques
Yang Li
1, Canwei Xia
1*, Huw Lloyd
2, Donglai Li
3and Yanyun Zhang
1Abstract
Background: Individuality in vocalizations may provide an effective tool for surveying populations of the Com-mon Cuckoo (Cuculus canorus) but there remains few data on which technique to use to identify individuality. In this research, we compared the within- and between-individual variation in cuckoo calls using two different analytical methods, and discuss the feasibility of using call individuality to count male cuckoos within a population.
Methods: We recorded vocalization from 13 males, and measured 15 spectro-temporal variables for each call. The majority of these call variables (n = 12) have greater variation between individuals than within individual. We first cal-culated the similarity (Pearson’s R) for each paired calls in order to find a threshold that could distinguish calls emitted from the same or different males, and then counted the number of males based on this distinction. Second, we used the more widely accepted technique of discriminant function analysis (DFA) to identify individual male cuckoos, and compared the correct rate of classifying individuals between the two analytical methods.
Results: Similarity of paired calls from the same male was significantly higher than from different males. Under a relatively broad threshold interval, we achieved a high (>90%) correct rate to distinguish calls and an accurate esti-mate of male numbers. Based on banded males (n = 3), we found the similarity of paired calls from different days was lower when compared with paired calls from the same day, but this change did not obscure individual identification, as similarity values of paired calls from different days were still larger than the threshold used to distinguish calls from the same or different males. DFA also yielded a high rate (91.9%) of correct classification of individuals.
Conclusions: Our study suggests that identifying individual vocalizations can form the basis of an appropriate survey method for counting male cuckoos within a population, provided the performance of different analytical techniques are compared.
Keywords: Vocal individuality, Avian acoustics, Common Cuckoo, Correlation analysis, Discriminant function analysis
© The Author(s) 2017. This article is distributed under the terms of the Creative Commons Attribution 4.0 International License (http://creativecommons.org/licenses/by/4.0/), which permits unrestricted use, distribution, and reproduction in any medium, provided you give appropriate credit to the original author(s) and the source, provide a link to the Creative Commons license, and indicate if changes were made. The Creative Commons Public Domain Dedication waiver (http://creativecommons.org/ publicdomain/zero/1.0/) applies to the data made available in this article, unless otherwise stated.
Background
Due to the ability of the Common Cuckoo (Cuculus canorus) to parasitize up to 300 different bird species (Erritzøe et al. 2012), their presence may mirror the overall richness of their potential avian hosts and even the overall bird diversity of a region (Morelli et al. 2015; Tryjanowski and Morelli 2015). However, estimating the
abundance of a cuckoo population remains problematic. First, the home range of an individual cuckoo can be quite large and covers an area up to 135 km2 in the
breed-ing season (Vogl et al. 2004; Williams et al. 2015). Second, although male cuckoos are territorial, it is not unusual to find several male cuckoos occurring in close proximity to each other during the breeding season (Møller et al.
2016a, b). Consequently, there are risks of double-count-ing the same individual (overestimation) or misidenti-fying different individuals as being the same individual (underestimation) when using typical survey methods
Open Access
*Correspondence: [email protected]
1 Ministry of Education Key Laboratory for Biodiversity and Ecological Engineering, College of Life Sciences, Beijing Normal University, Beijing 100875, China
that rely on visual observations such as line transects or point counts.
Male cuckoo utters a loud, characteristic “cuck-ooo” call during the breeding season. Two recent studies have found that inter-individual variation of the cuckoo call is greater than intra-individual variation (Jung et al. 2014; Zsebők et al. 2017). In these studies, the authors applied discriminant function analyses (DFA) to classify calls to individual males and found extremely high correct classi-fication rate, almost 100%, revealing clear inter-individual difference in call features (Zsebők et al. 2017). However, we still do not know for certain whether acoustic fea-tures in the cuckoo call remain stable over time, since in above mentioned study, individuals of calling cuckoo males were recorded only once. Stability of individual acoustic features forms the basis to monitor and re-iden-tify individuals based on vocal individuality (Fox 2008; Xia et al. 2010). Even for estimating population density based on vocal individuality, stability of individual acous-tic features is a key assumption during the survey interval (Dawson and Efford 2009; Frommolt and Tauchert 2014). Temporary changes of acoustic features may result in greater variation in calls within individuals, rather than between different individuals, and this would result in incorrect identification. DFA is one analytical method applied to classify individuals based on call character-istics (Gilbert et al. 1994). The use of DFA is dependent on collecting an adequate number of calls per male, with previous recommendations stating that this should be at least three times larger than the number of variables used in the DFA (Williams and Titus 1988). In the only pre-vious study on vocal individuality in cuckoos, individu-als deemed to have an insufficient number of calls (i.e. less than ten) were removed from the DFA (Zsebők et al.
2017). Since it is known that a quarter of male cuckoos generally emit less than ten calls within one calling bout (Møller et al. 2016a, b), the application of DFA for iden-tifying vocal individuality in cuckoos could be restricted.
In this study, we compared within- and between-indi-vidual variation in male cuckoo calls in a Northeast Asian population. We used correlation analysis and DFA to assess the feasibility of using call individuality to discrim-inate between individual males. We estimate the number of different male cuckoos based on the correlation analy-sis. Based on the repeated recording from banded males, we also investigated the stability of call features in male cuckoos over a 5-day period.
Methods
Study area and sound recording
Field work was conducted from July 10th to July 17th in 2016, in the Liaohe Delta Nature Reserve (41.033929°N; 121.725244°E), Liaoning Province, northeast China. This
region is one of the most important estuarine wetlands in the country and has the largest area of reed-bed habi-tat along the coastal region of China. Here, the Common Cuckoo is a summer breeding species, and mainly para-sitizes the Oriental Reed Warbler (Acrocephalus orienta-lis) during late May to early August (Li et al. 2016). Using mist nets, we trapped 48 individual cuckoos during the first 3 days of the study. Individuals were immediately banded with a numbered metal band, and marked by waterproof paint applied to the abdomen of the bird to enable observers to distinguish individuals from distance.
We recorded cuckoo vocalizations using a TASCAM HD-P2 portable digital recorder (Tascam Co., Japan) and a Sennheiser MKH416 P48 external directional micro-phone (Sennheiser Co., Germany), with a sampling rate of 44.1 kHz and a sampling accuracy of 16 bits. In the study area, male cuckoos regularly call when perch-ing on electrical wires (Li et al. 2016), which enabled us to approach within 10‒30 m of calling males and obtain the best possible recording with minimal background noise. Consequently, we were able to record vocalizations of 13 different males, three of which were individually marked (banded) before recording. The fate of the other 45 banded cuckoos was unknown. Although we did not band the other ten males, we avoided repeated sampling from the same male by travelling along roads within half a day and recording new males that were at least 2 km away from males which had been recorded. For the three banded males, we recorded each individual’s calling on two, three, and five successive days respectively.
Sound analysis
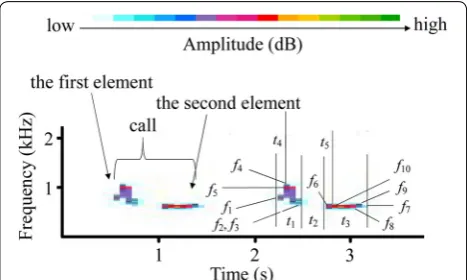
We used Avisoft-SASLab Pro software (Avisoft Bioacous-tics, Berlin, Germany) to resample the recordings using an 8 kHz sampling frequency and created spectrograms with the following settings: sample size, 16 bits; Fast Fou-rier transform length, 256 points; Hamming window with a frame size of 100% and an overlap of 50%; frequency resolution, 31 Hz; and time resolution of 16 ms. Male cuckoo calls comprise of two elements (Fig. 1) and we manually separated each element, which is a continuous signal in the spectrogram, following the procedure used in previous studies (see Fuisz and de Kort 2007; Wei et al.
2015; Zsebők et al. 2017). We then automatically meas-ured each element: firstly, we used Avisoft-SASLab Pro software to automatically search the maximum ampli-tude in each element, and then determine the start and end points of each element at approximately 16 dB lever lower than the maximum amplitude. At 16 dB lever, most measured elements were explicit and above the background noise. The following variables were meas-ured: duration of the element (tdur1, tdur2); duration from
within that element (tdis1, tdis2); frequency at the start
point of the element (fsta1, fsta2); frequency at the end
point of the element (fend1, fend2); minimum frequency of
the element (fmin1, fmim2); maximum frequency of the
ele-ment (fmax1, fmax2); frequency of the maximum amplitude
within the element (fpeak1, fpeak2); time interval between
the first and second element (tint). We measured ten calls
for each male from each day. For two males with less than ten calls, we measured the total number of seven calls. Original measurement data of call features can be seen in Additional file 1: Table S1.
Data analyses
We collected two sets of acoustic data. The first data set contained 94 calls from ten unbanded males, and 30 calls from the three banded males, all of which were recorded on the same day. The second data set contained only recordings from the three banded males, and consisted of 20 calls from the male recorded on two continuous days, 30 calls from the male recorded on three continuous days, and 38 calls from the male recorded on five contin-uous days. The consistency of call features was examined using only the second (banded male) data set, whereas all other analyses were based on the first data set (combined banded and unbanded males).
We statistically described the frequency and temporal characteristics of cuckoos’ call using the average meas-urements for each male. We used coefficients of varia-tion (CV) for each variable to compare differences within (CVw) and between (CVa) individuals (Robisson et al.
1993). We computed CV for each individual based on
all calls belonging to that individual, and then calculated the mean as CVw. We used the average value for each
individual to compute CVa. The ratio of CVa/CVw is the
measurement of potential individual coding (PIC) which shows the importance of each variable used in identifying individuals (Charrier et al. 2001, 2003). We determined candidate variables for identifying individuals when the variable PIC value was >1, meaning that the variable showed greater variation between individuals than within an individual.
Using the first data set (combined banded and unbanded males), we standardized 12 variables, which PIC value was greater than 1, using the formula:
(value−mean)
standard deviation. Based on these 12
standardized variables, we calculated the similarity of all pairs of calls using Pearson’s R for both within indi-viduals and between indiindi-viduals. Budka et al. (2015) set a value, called a ‘threshold’ that enabled them to separate the similarity of pair calls of the same male from that of different males, as the former was generally larger than the latter. Following this method, we attempted to find a threshold for individual male cuckoo identification through trial and error. We also estimated the number of males based on the threshold value: if a call’s maximum similarity (the maximum similarity between this call and all other calls) was less than the threshold, this call was identified as being from a new male. Spectrogram cross-correlation (e.g. Xia et al. 2011) was not used due to the volume of background noise in the recordings.
To compare the similarity values calculated from both the first and the second data sets, we standardized all var-iables from the second data set, which only contained the calls from banded males, using the mean and standard deviation calculated from the first (unbanded and banded combined) data set: (value−mean)
standard deviation.
Then using the second data set, we calculated similarity (Pearson’s R) for each possible combination of calls from the same male in order to test the consistency of call fea-tures over time. We hypothesized that the similarity of all combinations of calls from different days within the same individual male would be larger than the similarity of all combinations of calls from different males.
We also used DFA (linear combination of variables that maximally separate the data points pertaining to differ-ent categories) based on the original data set with 15 variables. In the first data set, results from jack-knifed classifications are reported as percentages of songs cor-rectly assigned. In jack-knifed classifications, each song was assigned to an individual on the basis of discrimi-nant functions calculated from all songs in the data set except the one being classified. In the second data set, we used the 13 discriminant functions (corresponding to 13 males) constructed based on the first data set to classify
calls recorded from different days. All analyses were performed using R v. 3.3.1 (R Core Development Team
2016).
Results
Based on 124 calls from 13 males, we found that the first element of the male cuckoo’s call had a relatively shorter duration and higher frequency than the second element (paired samples t test, t123 = −25.754, p < 0.001, for
dura-tion; t123 = 45.812, p < 0.001, for frequency of the
maxi-mum amplitude) (Table 1). Besides duration of the first element (t-dur1) and duration from the start of element to the location of the maximum amplitude (t-dis1, t -dis2), all other variables showed higher between-individ-uals variation than within-individual variation (Table 1).
Based on the first data set (combined banded and unbanded males), similarity of paired calls from the same male was 0.615 ± 0.243 (mean ± SD, the same below), which was significantly higher than the similarity of paired calls from different males (−0.050 ± 0.384) (inde-pendent samples t test, t7624 = 30.522, p < 0.001) (Fig. 2).
We found that as the threshold increased, the prob-ability of assigning calls to different males, that actually belong to the same male increased, while the probabil-ity of assigning calls belonging to different males to the same male decreased (Fig. 3). When the threshold was set at 0.6 (ranging from 0.561 to 0.640), both the number of calls belonging to the same male assigned to different males divided by the total number of calls, and the num-ber of calls belonging to different males assigned to the
same male divided by the total number of calls were less than 10%, and the number of estimated individual males identified from the analyses ranged from 12 to 14, which was very close to the real (observed) number of 13 males (Fig. 3).
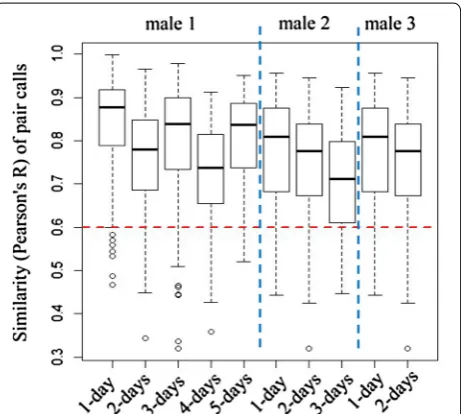
Based on the second (banded male) data set, the simi-larity of calls from all pairs of males from different days (0.756 ± 0.121) showed a slight decrease when com-pared to the similarity from the same day (0.795 ± 0.127) (independent samples t test, t1471 = 5.543, p < 0.001).
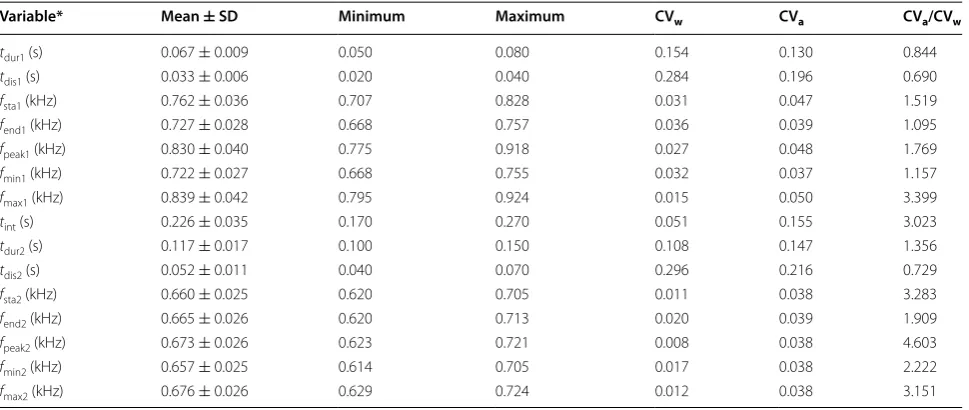
Table 1 Call features of male Common Cuckoos based on 124 calls from 13 males
* Duration of the element (tdur1, tdur2); duration from the start of element to the point of maximum amplitude within that element (tdis1, tdis2); frequency at the start
point of the element (fsta1, fsta2); frequency at the end point of the element (fend1, fend2); minimum frequencies of the element (fmin1, fmin2); maximum frequency of the
element (fmax1, fmax2); frequency of the maximum amplitude within the element (fpeak1, fpeak2); time interval between the first and second element (tint)
Variable* Mean ± SD Minimum Maximum CVw CVa CVa/CVw
tdur1 (s) 0.067 ± 0.009 0.050 0.080 0.154 0.130 0.844
tdis1 (s) 0.033 ± 0.006 0.020 0.040 0.284 0.196 0.690
fsta1 (kHz) 0.762 ± 0.036 0.707 0.828 0.031 0.047 1.519
fend1 (kHz) 0.727 ± 0.028 0.668 0.757 0.036 0.039 1.095
fpeak1 (kHz) 0.830 ± 0.040 0.775 0.918 0.027 0.048 1.769
fmin1 (kHz) 0.722 ± 0.027 0.668 0.755 0.032 0.037 1.157
fmax1 (kHz) 0.839 ± 0.042 0.795 0.924 0.015 0.050 3.399
tint (s) 0.226 ± 0.035 0.170 0.270 0.051 0.155 3.023
tdur2 (s) 0.117 ± 0.017 0.100 0.150 0.108 0.147 1.356
tdis2 (s) 0.052 ± 0.011 0.040 0.070 0.296 0.216 0.729
fsta2 (kHz) 0.660 ± 0.025 0.620 0.705 0.011 0.038 3.283
fend2 (kHz) 0.665 ± 0.026 0.620 0.713 0.020 0.039 1.909
fpeak2 (kHz) 0.673 ± 0.026 0.623 0.721 0.008 0.038 4.603
fmin2 (kHz) 0.657 ± 0.025 0.614 0.705 0.017 0.038 2.222
fmax2 (kHz) 0.676 ± 0.026 0.629 0.724 0.012 0.038 3.151
Furthermore, the similarity with 4-day interval (com-paring calls from day 1 to calls from day 5) was 0.799 ± 0.113, which was significantly larger than 0.6 (one-sample t test, t39 = 11.114, p < 0.001) (Fig. 4).
DFA based on the 13 individuals from the first data set yielded a high rate (91.9%) of correct classification of individuals. For calls recorded from different days (sec-ond dataset), the rate of correct classification was 82.1% for male recorded on five continuous days (100% for the same day, 1-day interval and 2-day interval; 50% for the 3-day interval and 4-day interval), and 100% for the other two males that were recorded across two and three con-tinuous days.
Discussion
In this study, we found that calls from the same male were significantly more similar in their characteristics than calls from different males, i.e., between-individual varia-tion in calls was much greater than within-individual var-iation. Studies of male cuckoos in Korea using Principal Component Analyses (PCA) and ANOVA tests revealed that individual males produce different calls in terms of spectral and temporal features and that between-male variation was also greater than within-individual variation (see Jung et al. 2014). DFA has also been used successfully to achieve almost 100% correct rate of clas-sifying calls to individual males, indicating very high variability in the call characteristics between different males (Zsebők et al. 2017). Thus, across different cuckoo
populations, it appears that individual male cuckoos may use vocal characteristics to identify different individu-als. In some populations, males are highly territorial and
Fig. 3 Probability of mistakenly assigning calls to same male or different males and counted males number changed with different threshold, based on the first data set (combined banded and unbanded males). Red dotted line indicates the optimal threshold used to assign calls to same male or different males
expend a lot of time and energy dealing with territorial disputes with neighbors, so recognizing different individ-uals would be beneficial for males by reducing the need for territorial conflict (Jung et al. 2014).
Using two different analytical methods, we achieved a high rate of correct classification of individual male cuckoos. Using DFA, we achieved a correct rate of clas-sification for 13 different males of 91.9%. High rates of correct classification were also achieved using the Pear-son’s R correlation analysis. Correlation analysis has only previously been used in a study to distinguish Corn-crake (Crex crex) individuals based on call features (see Budka et al. 2015). DFA requires an adequate number of calls per male to construct robust discriminant func-tions (Williams and Titus 1988). Correlation analysis can be conducted with much smaller sample sizes (Budka et al. 2015), thus reducing the need to omit males with fewer recordings from the analyses (Zsebők et al. 2017). We suggest that either technique may be suitable for identifying individuality in male cuckoo calls but future studies need to review the data requirements of either method. This is an important consideration, particularly in light of the fact that we failed to identify a threshold to completely separate calls from the same or different males. However, we were still able to achieve a high cor-rect rate to distinguish calls and obtain an accurate num-ber of males under a relatively broad threshold interval (e.g. ranging from 0.561 to 0.640). Threshold is crucial to identify individuals based on correlation analysis. If the threshold is too high, calls belonging to the same male will be assigned to different males, which may lead to overestimate male numbers; by contrast, low threshold may lead to underestimate male numbers.
Based on the calls of the three banded males, we found the similarity of paired calls from different days decreased slightly when compared with the similar-ity values of paired calls from the same day. In addition, the similarity of paired calls from the same male across a 4-day interval was also larger than the threshold used to distinguish calls from the same or different males, which means that the slight change in call characteristics does not influence individual identification, at least across a 4-day interval, and only considering one individual.
Conclusions
In conclusion, we suggest that vocal individuality rep-resents a suitable basis from which to develop a new and rapid systematic survey method for estimating the abundance of male cuckoos within populations, and that future surveys should consider testing more than one analytical approach to correctly classify individuals based on acoustic signals. As cuckoo occurrence can be used to reflect bird species richness (Morelli et al. 2015;
Tryjanowski and Morelli 2015), our findings may also provide an effective and convenient tool to monitor the bird diversity.
Authors’ contributions
CX, YZ designed the experiments; YL, DL participated in the field work; YL, CX carried out the analyses; YL, CX drafted the earlier version of the manuscript and HL, DL, YZ revised it. All authors have read and approved the final manuscript.
Author details
1 Ministry of Education Key Laboratory for Biodiversity and Ecological Engi-neering, College of Life Sciences, Beijing Normal University, Beijing 100875, China. 2 School of Science and Environment, Manchester Metropolitan Univer-sity, Manchester M1 5GD, UK. 3 Provincial Key Laboratory of Animal Resource and Epidemic Disease Prevention, College of Life Sciences, Liaoning University, Shenyang 110036, China.
Acknowledgements
This study was supported by the Youth Scholars Program of Beijing Normal University (No. 31601868 to CX), National Natural Science Foundation of China (No. 31301888 to DL), General scientific research project of Education Depart-ment of Liaoning Province (L2015196 to DL) and Open Fund of Ministry of Education Key Laboratory for Biodiversity Sciences and Ecological Engineer-ing, Beijing Normal University (K1401 to DL). We thank Dr. Selvino de Kort for commenting on an earlier version of the manuscript
Competing interests
The authors declare that they have no competing interests.
Ethical standards
Our research protocol was approved by the Animal Management Commit-tee at the College of Life Sciences, Beijing Normal University under license number CLS-EAW-2016-017. Bird capture and banding were permitted by the National Bird-banding Center of China under license number H20110042.
Received: 19 January 2017 Accepted: 1 August 2017
References
Budka M, Wojas L, Osiejuk TS. Is it possible to acoustically identify individuals within a population? J Ornithol. 2015;156:1–8.
Charrier I, Mathevon N, Jouventin P, Aubin T. Acoustic communication in a black headed gull colony: how do chicks identify their parents? Ethology. 2001;107:961–74.
Charrier I, Mathevon N, Jouventin P. Individuality in the voice of fur seal females: an analysis study of the pup attraction call in Arctocephalus tropicalis. Mar Mamm Sci. 2003;19:161–72.
Dawson DK, Efford MG. Bird population density estimated from acoustic signals. J Appl Ecol. 2009;46:1201–9.
Erritzøe J, Mann CF, Brammer FP, Fuller RA. Cuckoos of the world. Bloomsbury: Christopher Helm; 2012.
Fox EJS. A new perspective on acoustic individual recognition in ani-mals with limited call sharing or changing repertoires. Anim Behav. 2008;75:1187–94.
Frommolt KH, Tauchert KH. Applying bioacoustic methods for long-term monitoring of a nocturnal wetland bird. Ecol Inf. 2014;21:4–12. Fuisz TI, de Kort SR. Habitat-dependent call divergence in the common
cuckoo: is it a potential signal for assortative mating? Proc R Soc Lond B Biol. 2007;274:2093–7.
Additional file
• We accept pre-submission inquiries
• Our selector tool helps you to find the most relevant journal
• We provide round the clock customer support
• Convenient online submission
• Thorough peer review
• Inclusion in PubMed and all major indexing services
• Maximum visibility for your research
Submit your manuscript at www.biomedcentral.com/submit
Submit your next manuscript to BioMed Central
and we will help you at every step:
Gilbert G, McGregor P, Tyler G. Vocal individuality as a census tool: Practical considerations illustrated by a study of two rare species. J Field Ornithol. 1994;65:335–48.
Jung WJ, Lee JW, Yoo JC. “cu-coo”: can you recognize my stepparents? A study of host-specific male call divergence in the common cuckoo. PLoS ONE. 2014;9:e90468.
Li DL, Ruan YN, Wang Y, Chang AK, Wan DM, Zhang ZW. Egg-spot matching in common cuckoo parasitism of the oriental reed warbler: effects of host nest availability and egg rejection. Avian Res. 2016;7:21.
Møller AP, Morelli F, Mousseau TA, Tryjanowski P. The number of syllables in chernobyl cuckoo calls reliably indicate habitat, soil and radiation levels. Ecol Ind. 2016a;66:592–7.
Møller AP, Morelli F, Tryjanowski P. Cuckoo folklore and human well-being: cuckoo calls predict how long farmers live. Ecol Ind. 2016b;72:766–8. Morelli F, Jiguet F, Reif J, Plexida S, Valli AS, Indykiewicz P, Simova P, Tichit M,
Moretti M, Tryjanowski P. Cuckoo and biodiversity: testing the correlation between species occurrence and bird species richness in Europe. Biol Conserv. 2015;190:123–32.
R Core Development Team. R: a Language and environment for statistical computing. Vienna: R Foundation for Statistical Computing; 2016. https:// www.R-project.org.
Robisson P, Aubin T, Bremond JC. Individuality in the voice of the emperor penguin Aptenodytes forsteri: adaptation to a noisy environment. Ethol-ogy. 1993;94:279–90.
Tryjanowski P, Morelli F. Presence of cuckoo reliably indicates high bird diver-sity: a case study in a farmland area. Ecol Ind. 2015;55:52–8.
Vogl W, Taborsky B, Taborsky M, Teuschl Y, Honza M. Habitat and space use of European cuckoo females during the egg laying period. Behaviour. 2004;141:881–98.
Wei CT, Jia CX, Dong L, Wang DP, Xia CW, Zhang YY, Liang W. Geographic vari-ation in the calls of the common cuckoo (Cuculus canorus): isolation by distance and divergence among subspecies. J Ornithol. 2015;156:533–42. Williams BK, Titus K. Assessment of sampling stability in ecological applications
of discriminant analysis. Ecology. 1988;69:1275–85.
Williams HM, Willemoes M, Klaassen RH, Strandberg R, Thorup K. Common cuckoo home ranges are larger in the breeding season than in the non-breeding season and in regions of sparse forest cover. J Ornithol. 2015;157:461–9.
Xia CW, Xiao H, Zhang YY. Individual variation in brownish-flanked bush war-bler songs. The Condor. 2010;112:591–5.
Xia CW, Huang R, Wei CC, Nie PW, Zhang YY. Individual identification on the basis of the songs of the asian stubtail (urosphena squameiceps). Chin Birds. 2011;2:132–9.