O R I G I N A L A R T I C L E
Open Access
Development aid for energy in Small Island
Developing States
Aaron Atteridge
*and Georgia Savvidou
Abstract
Background:Energy is given high priority in the national development agendas of most Small Island Developing States (SIDS) because it is intertwined with social, economic and environmental challenges. Many SIDS experience heavy fiscal burdens associated with imported fuels, some have very low electricity access rates, and islands also have a strong interest in the transition to cleaner energy because they are particularly vulnerable to the impacts of climate
change. This paper presents a global mapping of development finance for SIDS’energy sectors. We analyse whether
energy aid has increased following international commitments to support developing countries tackle climate change and whether this is supporting renewable energy, whether finance has been targeted to different recipient countries based on either their income status or their electricity access rates and whether electricity access rates have
substantially improved during this time, and whether financial commitments are actually being disbursed.
Methods:Focusing mainly on the period 2002–2016, we use data reported by bilateral and multilateral sources to the
Organisation of Economic Cooperation and Development’s Development Assistance Committee on financial support
to 37 SIDS. Our analysis includes almost 5700 energy-related transactions between 2002 and 2016. Data on populations
and electricity access rates of individual countries come from the World Bank’s Open Data platform.
Results:We observe an increase in funding since 2009 and a shift towards renewables, and solar particularly, though oil-fired plants and other non-renewables continue to be funded. Energy aid is unevenly spread between SIDS, on a total and a per capita basis. There is little correlation between the allocations made to individual countries and either their income or energy access gaps, and improvements in electricity access have been slow in those countries where the gap is largest. We also identify low disbursement rates, suggesting implementation problems.
Conclusions:There is an urgent need to improve the quantity and quality of aid to help SIDS tackle their significant energy challenges. While the trend towards more funding for renewables is positive, low disbursement levels and limited support for strengthening local human and institutional capacities may be limiting its effectiveness.
Keywords:Energy, Finance, Aid, Small Island developing states, Electricity access, Renewables
Introduction
Energy challenges in SIDS
Among the many challenges that governments and com-munities in Small Island Developing States (SIDS) have to manage is access to, and the cost burdens of, energy. Most SIDS rely heavily on imported fossil fuels, mainly oil, for electricity generation and primary energy supply, as well as for transport [1], a situation that creates direct financial burdens, supply risks and indirect costs associated with climate change. High and potentially volatile fuel prices,
high transport costs in the energy supply chain and ineffi-cient use in diesel generators mean SIDS tend to suffer from higher electricity costs than other countries [2–4]. Fossil fuels also create a drain on government budgets and current accounts; fuel imports in the Pacific region are worth on average around 10% of gross domestic product (GDP) [5], a salient fact given that SIDS are among the most indebted countries in the world [6]. Some estimates suggest SIDS globally would save around $3.3 billion an-nually if they switched all energy to renewable sources, equivalent on average to around 3.3% of their GDP though some countries could achieve much higher percentage savings, especially in the Pacific and Indian Oceans [1].
© The Author(s). 2019Open AccessThis article is distributed under the terms of the Creative Commons Attribution 4.0 International License (http://creativecommons.org/licenses/by/4.0/), which permits unrestricted use, distribution, and reproduction in any medium, provided you give appropriate credit to the original author(s) and the source, provide a link to the Creative Commons license, and indicate if changes were made.
* Correspondence:[email protected]
SIDS give high priority to the energy sector in their national development plans, in their Nationally Deter-mined Contributions (NDCs) submitted to the United Nations Framework Convention on Climate Change (UNFCCC) [7] and in joint declarations like the Samoa Pathway [8]. The Samoa Pathway highlights access to af-fordable, modern energy services, renewable energy and energy efficiency as key elements of SIDS sustainable de-velopment strategies. These priorities mirror those of the Sustainable Development Goals (SDGs), specifically SDG7, under the United Nations’Agenda 2030 [9].
SIDS tend to have high renewable resource potentials relative to energy demand, particularly wind and solar resources [1]. Many have shown strong interest in intro-ducing cleaner, more financially sustainable options par-ticularly for electricity generation, driven by both economic and risk considerations [10]. Some have adopted targets for scaling up renewable energy that are at the most ambitious end of the spectrum globally [11]—the Cook Islands, Cape Verde, Fiji, Saint Vincent and the Grenadines, Vanuatu and Samoa all aim to in-crease the share of renewable energy in their power mix to between 60 and 100%.
Addressing SIDS energy challenges is no easy task. A wide range of barriers have been cited: lack of informa-tion and awareness [1, 12, 13]; high costs and lack of suitable financing [1, 3, 11–15] including limited finan-cial services in some countries; the absence of supportive regulatory frameworks such as rules that make it diffi-cult for utilities to undertake grid extensions in rural areas, or the presence of poorly designed subsidies that keep energy prices artificially low and discourage invest-ment [1,3,11–14,16]; small energy markets which con-strain the establishment of independent regulatory agencies that can be crucial to the development of new policy measures that will support energy investment [11]; resistance by incumbent—usually state-owned— power companies to new technologies [1,11,17]; limited technical capacity for working with new sources of en-ergy including renewables [3, 14, 18]; lack of negotiating capacity [19]; low financial transparency and sustainabil-ity of utilities [18]; lack of long-term planning and polit-ical commitments [20], mirrored by the short-term horizons of international donors [14]; weak regional co-ordination, particularly noted in the case of African SIDS [21]; and in some cases, the need for social or cul-tural changes in order to switch energy sources or tech-nologies [16,18].
Role of development aid in SIDS energy sectors
The International Renewable Energy Agency (IRENA) [3] stresses access to finance as a critical issue that has constrained the ability of SIDS to expand renewable en-ergy, noting insufficient local equity and government
funding. Renewables also pose a different kind of finan-cing challenge in that the main costs are driven by sig-nificant upfront capital investment, compared to fossil fuel-based power systems where fuel consumption is the main cost and is spread over the asset’s operating life and in some SIDS may require strengthened transmis-sion systems. IRENA [3] also finds that around three quarters of the SIDS they surveyed are not budgeting for the long-term operation and maintenance of renewable energy projects funded by donors.
These barriers constrain private investment, and as a result, the public sector, and particularly international development finance, has been heavily relied upon for expanding and maintaining energy assets and for finan-cing energy imports [16,22–24]. Some suggest that pub-licly financed energy systems are not necessarily a bad thing in SIDS because foreign financial interest in energy assets would otherwise result in capital outflows from their economies that could be particularly damaging due to the high ratio of electricity consumption as a share of GDP in some countries [25].
This reliance on external aid creates its own chal-lenges. One is that technology choices are often made by donors and are not necessarily compatible with local needs or expectations [16], and Dornan [14] suggests off-grid rural electrification projects implemented by do-nors and governments have rarely been sustainable. It has also been noted that although donors and other re-gional and international organisations emphasise policy development, for renewables, for instance, the same or-ganisations often do not follow the policies when making critical funding decisions [16]. Keeley [18] highlights concerns about the high volume of aid eroding the com-mercial characteristics of renewable energy applications and effectively making it harder for the private sector to play a role, thus reinforcing a dependence on public fi-nance in future. Hemstock and Smith [16] describe lock-in effects such as where donors fund diesel genera-tors and then, in future years, target their aid at budget relief in order to offset the high costs of importing fuel to run the generators. Dornan and Shah [11] note that aid has preferentially targeted grid-based renewable en-ergy projects over rural electrification or cleaner cooking programmes, even in countries like Vanuatu and Papua New Guinea where energy access rates remain very low by world standards. One review of sustainable energy initiatives in countries (not SIDS) where energy access deficits are greatest finds low levels of disbursement of energy commitments by donors and attributes this to legal and contractual issues at the country level, tech-nical difficulties in executing projects and donor-side de-lays related to loan agreements [26].
has been increasing globally [27], partly because of com-mitments made under the UNFCCC to help developing countries tackle climate change [28,29]. Declarations like the Samoa Pathway have reiterated calls for international partners to maintain and extend this support to help SIDS pursue their energy access and clean energy agendas.
Mapping energy aid
The significance of SIDS’ energy challenges and the in-creasing flows of financial aid for clean energy globally lead us to be interested in questions about what energy-related aid is being provided to SIDS and what effects it is having. There has been relatively little ana-lysis published of what energy aid these countries have received over recent decades, particularly for renewable energy [11]. Most analysis has focused on the Pacific [12,18,22], or the Caribbean and Pacific jointly [19,23]. A further study [30] summarises finance from the Asian Development Bank (ADB) in the energy sector in Asia and the Pacific, which includes the region’s SIDS but does not address them specifically.
This literature offers some insights into the character of energy aid. A growing emphasis by donors on targeting aid towards reforming energy policy and on institutional technical assistance is widely highlighted [11, 12, 30]. Another common finding is that grid-based electricity has received considerably more funding than off-grid energy [11,12]. Keeley [18] finds that since 1970, around 80% of renewables funding in the Pacific went to hydro pro-jects—and is consequently concentrated in a small
num-ber of countries which have the potential for
hydropower—though notes a recent trend towards more solar projects. Niles [19] examines finance from the multi-lateral development banks, which tends to be less conces-sional than Official Development Assistance (ODA), and finds that more than 89% and 97% of energy assistance has been provided as debt in the Pacific and Caribbean SIDS respectively. Around half of renewables finance to the Pacific from 1970 to 2014 was provided as loans, though this picture is skewed by large hydro projects; other renewables have mostly been targeted with grants [18]. Despite disbursement challenges [31], some analysis has concluded that aid has positively affected capital for-mation in the energy sector in SIDS [32].
In this paper, we provide an updated and more com-prehensive mapping of development finance for energy activities in SIDS globally. Using data reported to the Organisation for Economic Cooperation and Develop-ment (OECD) DevelopDevelop-ment Assistance Committee (DAC) by countries, multilateral funds and development banks, we examine the following questions: whether vol-umes of finance for SIDS’energy sectors have increased following UNFCCC commitments; whether aid is responding to the global energy transition needed to
tackle climate change and to SIDS’own emphasis of re-newable energy; what financial instruments have been used to deliver this support; whether aid is targeting the most needy in terms of energy access gaps (specifically, electricity access) and, related, whether it has catalysed improvements in access rates; who is providing energy aid for SIDS; and, the ratio of disbursements of aid rela-tive to commitments, as a proxy for identifying potential implementation challenges.
Research outline and methodology Scope
The analysis is focused on mapping development aid to SIDS’energy sectors during the last 15 years from 2002 to 2016. This covers a period when we would expect to see increased financial flows to clean energy following commitments under the UNFCCC. For historical con-text, it begins by showing data from 1973 (when the first data is available). Even though the data quality is not comprehensive prior to the early 1990s, it offers useful context prior to focusing our analysis on more recent trends over the last 15 years.
Our analysis covers 37 SIDS globally.1Seven are from the African and Indian Ocean region, and fifteen from each of the Caribbean and Pacific regions. Thirty-five are UN-member states (we exclude Singapore, Bahrain and Bahamas because they are high-income countries) and the remaining two—the Cook Islands and Niue—are independent sovereign states which are members of the regional governing bodies for the Pacific even though they do not have the same UN status. Apart from the Cook Islands and Niue, we exclude the other eighteen non-UN SIDS members from our analysis because they are overseas territories of France, the Netherlands, the UK or the USA, and the financial support they receive is linked with these relationships. We include data on finance re-ported to countries and also regional contributions, where these are reported separately for the Caribbean (‘West Indies’in the CRS) and Pacific (‘Oceania’).
Data
The analysis is based on data available in the Creditor Reporting System (CRS) database of the OECD DAC. This database was chosen as to the best of our know-ledge it is the most comprehensive and accessible data set on foreign aid flows to developing countries. The CRS contains detailed information on development
as-sistance as reported by OECD countries, some
financial flows that do not meet the (concessionality) criteria of ODA and can include grants made for commercial purposes or to support private investment in developing countries, contributions where the grant-equivalent is less than 25% of the value of the support, and funding that aims to facilitate donor country exports.3
Each transaction recorded in the CRS database is linked with a ‘sector’ and a ‘purpose’ (which is a sub-sector, for example a type of energy). Our analysis includes all transactions that were coded under the
sec-tors: energy policy; energy generation (renewable
sources); energy generation (non-renewable sources); ergy distribution; hybrid energy plants; and nuclear en-ergy plants (DAC sector codes 231 to 236). We do not include energy-related interventions in the transport sector because the CRS database does not distinguish these from other transport sector activities.
In total, we find almost 5700 transactions with energy sector codes between 2002 and 2016. Note that one pro-ject on the ground may consist of multiple, separately reported transactions in the database. The finance amounts in our analysis are presented in constant 2014 prices, as recommended by the OECD DAC4to account for inflation and exchange rate fluctuations. Some do-nors have reported loan repayments as a negative dis-bursement in the CRS database, meaning it appears in the same column as actual disbursements from donors to recipients. Therefore, prior to our analysis, we re-moved all negative disbursement amounts from the data. Additional data used in our analysis, specifically on populations and electricity access rates of individual countries, are taken from the World Bank’s Open Data platform [33].
Data limitations
The CRS data has some significant limitations. Some non-OECD sources of finance are not included in the database, such as China which is a notable gap because recent analysis shows China to be a significant financier in the Pacific islands at least [34]. An important qualifi-cation is that the data is reported by donor organisations and is not validated by recipients. Another is the possi-bility of mis-coding by sector. For instance, some energy-related support may have been coded by donors under ‘General Environment Protection’ or the ‘ Multi--sector’code, and if so, these transactions are not in our analysis. There is also evidence of errors in data entry (e.g. very low figures that are unlikely to be correct) or missing data, which we assume these to be the product of incomplete or erroneous reporting. In our analysis, we take all commitments and disbursements at face value as they are reported.
The CRS data is incomplete prior to 1990, offering only a partial picture of global aid. This has no substan-tial effect on our analysis, since we focus primarily on the period 2002 to 2016; the exception to this is the snapshot provided in Fig. 1, which we include despite the incomplete coverage in early years because we con-sider an historical picture still provides useful context for our subsequent focus on more recent trends. Finally, before 2015, the CRS did not include a separate Purpose code for ‘energy conservation and demand side effi-ciency’ until 2015. This means we cannot separately identify finance for this objective in earlier years.
Results—Development aid for energy in SIDS Trend over time
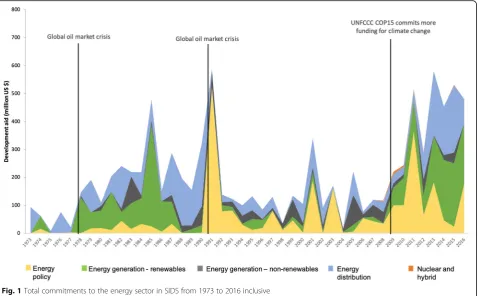
From 2002 to 2016 inclusive, total energy aid commit-ments to SIDS were US$4128 million. Before diving more deeply into this period, Fig. 1 provides some his-torical perspective by representing total energy-related donor commitments aggregated for all SIDS annually since the 1970s.
Although the coverage of data prior to 1990 is incom-plete, the figure nonetheless illustrates that there have been several sharp and unsustained peaks in energy aid. Some sharp changes in the level of funding at different points in time may be correlated anecdotally with changes in the international context. The first increase visible in the figure in 1978–1979 coincides with a global energy crisis triggered by extremely high world oil prices. Another spike in funding around 1990–1991 co-incides with another global oil crisis precipitated by the Iraqi invasion of Kuwait in August 1990. However, on closer inspection of the data, this large spike in 1991 consists mainly of two large finance packages from the Inter-American Development Bank, for Jamaica and Trinidad and Tobago respectively, rather than a pattern of expanded energy support to SIDS generally. In fact, immediately after this spike in the years 1992 to 1998, energy-related aid actually declined to its lowest levels in over two decades.
The increase in finance over the last decade reflects an increase in the volume of aid overall and also a greater emphasis on energy issues within aid portfolios. Total aid commitments to SIDS—including not only the en-ergy sector—rose from US$2.55 billion in 2002 to a peak of US$10.86 billion in 2010, and from 2011 onwards sta-bilised around US$7–8 billion per year. Between 2002 and 2010, the energy sector received an average of 3% of development finance flows to SIDS, whereas from 2011 to 2016, the average increases rapidly to 7%.
Types of energy projects
Figure2 breaks down the US$4128 million of energy-re-lated aid to SIDS during the 2002 to 2016 period into different energy sectors.
When renewable and non-renewable generation are combined, ‘energy generation’ has received the most funding overall. In total, renewables have received more than three times the amount of funding commitments than non-renewables over these 15 years. Significant funding has also been targeted to ‘energy policy’and to
‘distribution’. The ‘energy policy’component is mislead-ing, because a closer look at the data shows that donors have reported a wide variety of projects in this category, including some that are clearly electricity generation projects. Support for power transmission and distribu-tion has been heavily concentrated in the Caribbean. In all regions, finance for transmission and distribution
tends to be concentrated in a few large investments, and thus commitments spike in individual years rather than spread evenly over time.
From 2002 to 2016, US$1.23 billion was committed to renewables. Figure 3 shows negligible renewables funding prior to 2009, but a dramatic change from 2009 onwards, after which renewables support has exceeded support for non-renewables in every year except 2012. This reflects large increases in funding for solar energy particularly. Over this period, com-mitments to solar energy (US$281 million) surpassed commitments to hydro projects which were previously the largest share of renewables. Most of this targeted the Pacific (US$207 million) compared with the Caribbean (US$39 million) and African and Indian Ocean (US$59 million) regions. Support for solar has been unevenly spread between countries. Nine SIDS actually received no finance for solar energy (unless funds were channelled through programs reported by donors using the ‘regional’ codes rather than anno-tated for individual countries). These are Antigua and Barbuda, Barbados, Papua New Guinea, Saint Kitts
and Nevis, Saint Lucia, Saint Vincent and the
Grenadines, the Seychelles, Suriname, and Trinidad and Tobago. A further eight received less than US$1 million. The Maldives and Cook Islands were by far the largest recipients of aid for solar (US$50 million and US$47 million, respectively).
Fig. 2Total energy-related aid from 2002 to 2016 inclusive, disaggregated
Wind energy did not receive significant support, in total only US$31.5 million. The largest wind commit-ments were in the Caribbean (US$22 million), with very little focus in the Pacific (US$9 million). Wind has been supported in only eight countries: Cabo Verde, Cuba, Dominican Republic, Grenada, Jamaica, Micronesia, Saint Kitts and Nevis, and Samoa. How-ever, the largest of these commitments is only US$9 million, in Jamaica. In Cabo Verde, Cuba and St Kitts and Nevis, the commitments are less than US$1 mil-lion. Such small amounts suggest development aid has perhaps been used for background studies or pre-paratory work but not for any large-scale investments in wind power (unless it has played a minor role in enabling larger commercially funded projects, which is not determinable from the CRS data).
Some funding for geothermal energy materialised in 2016, the largest of which are projects in the Carib-bean funded by the Green Climate Fund and by the United Arab Emirates. Very few commitments target biofuel-fired power plants and more than half are for activities in Mauritius. Note that renewables commit-ments to the African and Indian Ocean SIDS have
been coded by donors mainly using the ‘multiple
technologies’ category, which masks what kinds of
technologies have been employed in this region.
Non-renewables investment totalled US$386 million. The largest recipient was Cabo Verde (US$107 million), followed by the Dominican Republic and Samoa. Figure3 shows oil-fired power plants receive funding consistently throughout the period (US$188 million), most likely for maintenance or refurbishment of old plants which pro-vide the only grid supply of electricity in some countries. By far the largest share of this went to the Pacific (US$108 million).
Financial instruments
In 2016, the annual funding commitments are relatively evenly split between grants, concessional loans and OOF, as indicated in Fig. 4. Since 2012, grants have de-clined in overall importance (not necessarily in overall amounts) while OOF has slightly increased in signifi-cance. As a share of total funding, and in absolute vol-ume, renewables have received the highest amount of grant funding. By contrast, energy distribution has been funded mostly via ODA loans and OOF. For SIDS classi-fied, as of March 2018, as least developed countries (LDCs), nearly 70% of the total energy funding they were approved was in the form of grants, with the remainder as ODA loans.
Overall, the data shows very little equity has been available to the energy sector via ODA or OOF, and this
is only in 2003 and 2005. This suggests either recipient governments or the private sector—or possibly the MDBs through other capital contributions not reported to the CRS—are providing the equity needed for energy investments. The reported equity is mostly coded under
‘energy policy’ but appears actually to be a handful of investments in national power companies in the Caribbean. The single largest equity contribution, from the UK to Mauritius in 2003, is cryptically described in the database, so it is unclear what this was for.
Figure 4 highlights the important role grant funding has played for renewables, more so than for other sector codes. The less concessional flows provided as OOF ap-pear to target mainly energy distribution and energy pol-icy, although as above, the energy policy category includes a lot of generation activities which are a more likely target for the more commercially-oriented flows of OOF. The same applies for the equity commitments re-ported under energy policy; these are actually not for policy support (which would make little sense for equity) but rather for generation.
Recipients and effects of aid on electricity access
Between 2002 and 2016, the total figure of US$4128 million in commitments to energy activities in SIDS is heavily skewed by large amounts to a few recipients. The
top four recipient countries—Dominican Republic,
Mauritius, Haiti and Cabo Verde—account for about half of the total commitments during the period of the analysis, and almost half of this was concentrated in the Dominican Republic.
Figure 5 breaks down energy aid by region. The
Caribbean, which has most countries and the largest population, received the greatest share by volume. The figure also breaks down this support according to the sub-sector targeted (using CRS Purpose Codes). As mentioned, the ‘energy policy’ code is used mislead-ingly by reporters to the CRS; the large chunk coded as energy policy in the Caribbean includes activities relating to generation, energy efficiency, capacity building, and policy and administrative support.
The figure also shows per capita commitments to each region, which we calculate using population data from the World Bank for 2016.5 On this score, African and Indian Ocean SIDS have on average received by far the largest commitments (US$203 k per capita over 15 years) compared with the Pacific (US$85 k per capita) and Caribbean (US$52 k per capita).
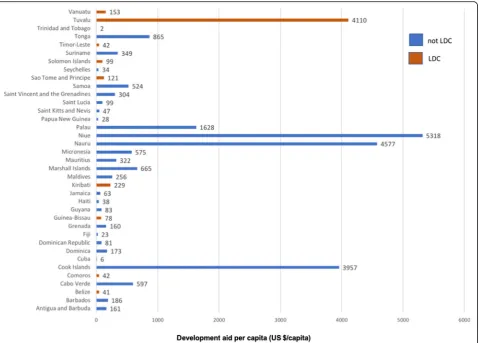
However, average per capita commitments at a re-gional level are distorted by commitments to their most populous countries. Therefore, in Fig. 6, we show per capita energy aid for each SIDS country. The difference between the highest and lowest amounts spans four or-ders of magnitude. Nine of the ten highest recipients are
actually Pacific islands, while the Pacific regional average is lowered by the fact its most populous countries, Papua New Guinea and Fiji, are at the lower end of the spectrum.
Figure6also distinguishes (by colour) those SIDS that are, as of March 2018, classified as LDCs. With the ex-ception of Tuvalu at the upper end of the spectrum, the other LDCs are around the middle of the per capita range, meaning the LDCs have not received more fund-ing per capita than the other SIDS.
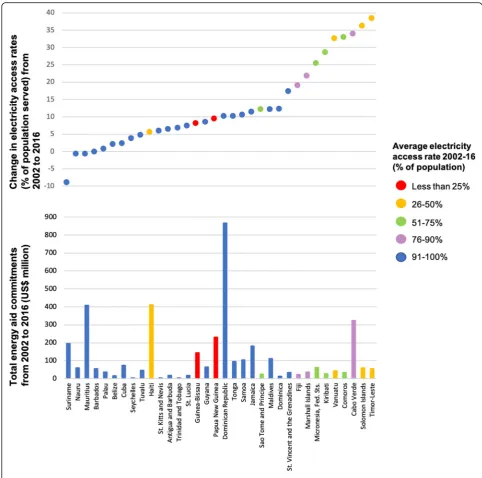
Figure 7 pairs energy aid commitments with
country-level electricity access statistics from the World Bank’s Open Data platform. Average electricity access rates in each country over the period 2002 to 2016 are shown in percentiles, by colour. Overall, SIDS with the lowest electricity access rates are not receiving more energy-related aid than other SIDS. The two countries with the lowest electricity access rates, Guinea Bissau and Papua New Guinea, are towards the upper end of the spectrum in total energy aid commitments, but both are at the lower end in commitments per capita (Fig. 6). Of the other four countries which have electricity access rates below 50%, only Haiti is among the highest energy aid
recipients in total amounts, but again, Haiti’s per capita figure is at the lower end of the spectrum. Timor Leste, Solomon Islands and Vanuatu are on the lower side of the spectrum in terms of total commitments for energy, and Timor Leste is also low on the per capita spectrum.
The data suggests some countries with relatively low electricity access rates have achieved gains since 2002. In Fig.7,changes in electricity access rates over the period 2002 to 2016 are plotted against the upper y-axis. Timor Leste, the Solomon Islands, Cabo Verde and Comoros have achieved the most significant improvements, in-creasing coverage to an additional 30–40% of the popu-lation over the last 15 years. These gains were achieved despite these countries being towards the lower end of the spectrum for receiving energy aid on a per capita basis (and with the exception of Cabo Verde, also in total commitments). Kiribati and Vanuatu too have im-proved electricity access by over 25% during the
period. The Dominican Republic—which received
more than double the commitments of the next high-est recipient in our analysis—achieved for the first time in 2016 an electricity access rate of 100%, having improved from 89% in 2002.
The data also highlights some cases where progress has been relatively limited. The countries at the left
side of Fig. 7 are those experiencing the lowest
improvement in access rates, though most of these are at or close to 100%, so there is little progress to be made on this front. However, in Suriname, electri-city access has gone backwards, dropping from 96% in 2002 to 87% in 2016, despite being towards the upper-middle of the spectrum in terms of per capita commitments of energy aid and the sixth highest
overall in total finance terms. Haiti only expanded access to an additional 5.7% of the population over the 15 years and reached only 39% by 2016. Papua New Guinea expanded by 9.5% but electricity access remained at a very low 23% in 2016. The lowest electricity access figure among all SIDS in 2016 was 14% in Guinea Bissau, and this is after an improvement of only 8% over 15 years. Another of the LDCs, Sao Tome and Principe, remains at 65% in 2016 and has made relatively slow progress, improving 12%.
Funding sources
Figure8shows the main providers of energy aid in each of the SIDS regions. Knowing who the donors are is important because these entities effectively influence the norms and policy frameworks as much as material investments that shape SIDS energy sectors. The largest shares were committed by the multilateral development banks. The World Bank has played a large role, via the International Bank for Reconstruction and Development (IBRD) in the Caribbean and via the International Development Association (IDA)—a part of the Bank that focuses specifically on the world’s poorest countries—in the African and Indian Ocean region. The regional
development banks—ADB, the African Development
Bank (AfDB) and Inter-American Development Bank
(IADB)—have all been important sources in their
respective geographies.
Japan is the largest bilateral source of energy finance and has focused on the Pacific and Africa and the Indian Ocean regions. Other important bilateral partners have been the United Arab Emirates (Pacific and Caribbean), New Zealand (Pacific), the USA (Caribbean), the UK and France (Africa and Indian Ocean) and European Union Institutions (mainly in the Pacific).
The most important finance sources for renewable en-ergy have been the IADB, the ADB, the European Union and Japan. The ADB has worked on the generation side almost exclusively with renewables, while it has also prioritised transmission and distribution. The AfDB has targeted mainly transmission and distribution activities. The largest providers of finance for non-renewable en-ergy generation have been the IBRD, Japan and France.
Disbursements
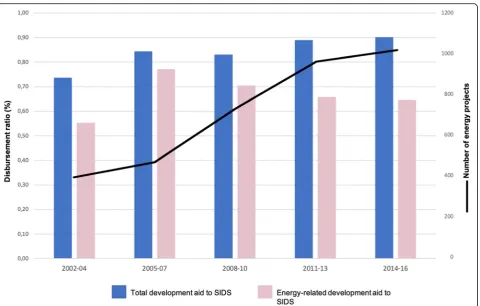
In the sections above, all values shown and discussed are the amounts committed (i.e. approved) by donors; how-ever, this rarely reflects what actually ends up being spent. Looking also atdisbursementdata tells us whether aid commitments are actually materialising on the ground. We use the term‘disbursement ratio’to refer to the total volume of disbursements as a portion of the total volume of commitments during the same period. A large difference between commitments and disburse-ments (i.e. a low disbursement ratio) might indicate that there are implementation challenges. Changes in the dis-bursement ratio over time provide insight into whether the actors involved—donors and recipients—are learning and becoming more effective at project design and implementation.
Figure 9 shows disbursement ratios aggregated for all SIDS between 2002 and 2016. It presents 3-year aver-ages, in order to look at whether disbursement ratios have changed over time. It also compares these average disbursement ratios in the energy sector with ratios for all development aid to SIDS (i.e. not only in the energy sector). The figure reveals two important patterns. First, disbursement ratios in the energy sector are not increas-ing over time, as we might expect if the fundincreas-ing entities and project developers are getting better at implement-ing energy projects. In fact, disbursement ratios for en-ergy have steadily declined since 2005–2007, which contrasts with improving disbursement ratios for all aid over the period. Second, disbursement ratios in the en-ergy sector are consistently lower than those for total development aid.
Figure9also shows the number of energy projects re-corded in the CRS database each year has steadily in-creased between 2002 and 2016, more or less tripling. The number of projects was compiled by collating trans-actions that used the same project identification number in the CRS as a single‘project’, which means the number of individual transactions is considerably higher than this. This dramatic increase in the number of activities might be creating absorption problems for recipient countries, particularly since many SIDS rely on relatively small public sectors to manage and implement this in-creasing volume of aid projects.
Disbursement ratios in the different SIDS regions are relatively similar, although the African and Indian Ocean region has a slightly lower ratio (54% average over the period 2002 to 2016) than the Pacific (63%) and Caribbean (66%) regions. Projects in the LDCs appear more difficult to execute because these SIDS have an average disbursement ratio of 66% between 2002 and 2016, compared with 86% in non-LDC SIDS. Comparing aggregated disbursement ratios with other developing countries (non-SIDS), the data indicates that since 2011 the disbursement ratios for energy activities in non-SIDS have been comparable with those for SIDS.
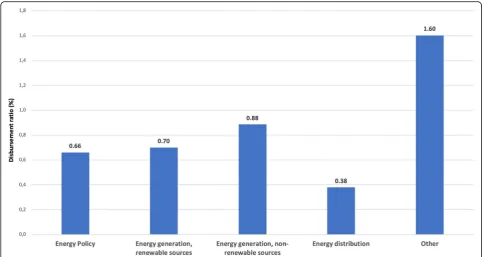
There is significant variation in disbursement ratios for different types of energy projects, as shown in Fig.10. Over the period, non-renewable projects have a high average disbursement rate of 88%, suggesting donors, project developers and recipients are familiar with, and have the expertise necessary to execute, these projects. This compares with an average ratio of 70% for renew-ables projects. Projects targeting energy distribution have a much lower ratio of 38%, indicating some signifi-cant difficulties in implementation.
Discussion
Previous literature on energy aid to SIDS has been sparse, and we are aware of no other studies which have looked at this for SIDS on a global scale. This paper pro-vides a first comprehensive analysis of energy aid to all SIDS and an updated analysis to previous regional stud-ies [12,18,22,23].
2002 to 2016 were US$5.9 million per country per year. If we also exclude Mauritius, Haiti and Cabo Verde, each SIDS was committed on average US$3.8 million per year for energy activities. For a capital-intensive sector like energy, these are relatively small amounts with which to catalyse meaningful change in the types, coverage and reliability of energy.
Energy aid does appear to be supporting a shift to-wards cleaner energy sources. The trend toto-wards renew-ables is important from a climate perspective but also because, if it displaces oil imports, this could improve energy security and reduce fiscal pressures for SIDS. There appears a growing appetite among donors and re-cipient countries for expansion of solar energy, also noted previously [12, 27]. As it is nearly a decade since this surge in solar investments began, now would be a good time to take stock of how these projects have fared from a technical and financial perspective. It is also im-portant to understand whether the early projects have contributed to a gradual scaling up in size and ambition for solar projects, or to a diversity of applications. By contrast, the fact very limited support has been provided for the development of wind power is to us a surprise, especially since some SIDS have plentiful wind resources. The reason for this is not evident from the finance data but would be valuable to explore further. Some donors including the IBRD, France and Japan are still providing significant sums of aid for non-renewable energy projects. In the near term, it may be difficult to completely shift away from any support for
non-renewable energy, given that many SIDS are still reliant on diesel-based power stations for electricity and that transitioning from these to cleaner energy takes time.
The data suggests that donors and finance institutions have not strategically targeted their energy aid towards those countries with the greatest electricity access gaps. This echoes findings by a study of energy finance from the World Bank which concludes that energy access is rarely a motivating factor in project selection [35]. Moreover, across all SIDS, our findings suggest mixed effectiveness of aid in improving electricity access and little correlation between the amounts of energy aid pro-vided and improvements in electricity access. In 2016, electricity access figures among several of the SIDS re-main very low: Guinea Bissau is at 14% and Papua New Guinea at 23%. A lack of progress also stands out in Haiti, which has seen little improvement even from a low base. Meanwhile, five of the nine LDCs expanded electricity access to a further 25% or more of their popu-lations in these 15 years, and LDCs actually make up five of the seven most improved countries in our analysis. It would be instructive to better understand what countries like Timor Leste, Comoros and the Solomon Islands have done to help achieve what looks like substantial progress relative to their SIDS peers.
under the UN of achieving universal energy access by 2030 is to be met. Four of the nine countries with the lowest electricity access rates have improved coverage at less than 1% per year. Even those SIDS having made most progress have achieved change at 2–3% per year, which given the size of the electricity access deficits these countries still face makes the 2030 target look fa-cetious. At current rates of progress, Guinea Bissau might achieve universal electricity access in 156 years, Haiti in 161 years and Papua New Guinea in 122 years.
One reason for such limited progress is suggested in the disbursements data. Those disbursement ratios for energy aid are lower than for total (non-energy) aid and show a declining trend over recent years is indicative of implementation problems in this sector, though the data does not tell us what these problems are. A previous study [26] finds similar disbursement challenges in en-ergy aid in Africa and Asia (not SIDS) and identifies some general explanations which may also be useful to examine in SIDS, including political issues, donor and recipient bureaucracy, and weak human capacity. Trans-mission and distribution (T&D) projects appear to be particularly challenging to implement, which is problem-atic because many SIDS emphasise reducing losses and expanding grid access as critical goals. In most SIDS, T&D investment and planning is the responsibility of state-owned, vertically integrated utilities, so low dis-bursement rates in T&D points at possible institutional problems within these utilities.
We observe that the LDCs have a significantly lower average disbursement ratio than countries that are not LDCs, which might be the result of institutional weak-nesses such as capacity gaps in the public sector or inad-equate cost recovery mechanisms in local electricity markets. However, for comparison, we also note that en-ergy projects in other countries (not SIDS) have similar disbursement ratios, suggesting the problem may be to do with the sector and the nature of the activities them-selves rather than the recipient countries. Regardless of the cause, low disbursement rates mean missed invest-ment and a wasted opportunity for SIDS to pursue their energy objectives and could have a stagnating effect on
other sustainable development goals. Encouraging
greater coordination between funders might help reduce transaction costs, since the proliferation of energy pro-jects appears to be having a negative effect on
absorp-tion capacities. However, the ability of SIDS
governments to bring disparate donor funding together into larger programmes relies on having strong institu-tions that can coordinate across government and negoti-ate with donors, and previous literature suggests many SIDS already struggle with this. A previous study [18] has identified several‘success factors’behind the expan-sion of renewable energy programmes in some Pacific
SIDS, including clear policy targets and action plans, ef-fective regulation, and a financially sound electricity util-ity. Another study [16] has suggested that donors commonly do not spend aid in line with national policies even where these do exist.
A final observation is that donors have spent virtually nothing on energy education and training (or at least have not coded support to this objective in the CRS). If the data is accurate, this is a significant gap in light of previous findings that capacity to manage especially re-newable energy in the grid is limited and constrains ex-pansion of clean energy [3,14,18] and that training and institutional strengthening are critical for the long-term sustainability of the renewable energy sector in SIDS [23]. It is worth noting that if supply options shift to-wards micro-grids and/or household generation, which seems particularly relevant for remote rural populations, energy access and grid connectivity may in future be-come increasingly decoupled; a trend towards off-grid projects by donors has previously been noted in the Pacific islands [12].
Conclusions
Overall, this paper adds an updated and global view of what is happening in the energy aid space for SIDS. The CRS data is helpful in seeing financing patterns at a rela-tively coarse level, even though there are problems with the data quality including errors in coding that distort the picture, as described in the‘Data limitations’section. But mapping energy aid is only a first step, albeit an im-portant one, in understanding the effectiveness of devel-opment finance. It provides a platform for further research evaluating the success of SIDS and their devel-opment partners in addressing energy-related challenges, since this is fundamental to the broader sustainable de-velopment agendas of small islands.
There is a critical need for more analysis of the out-comes and impacts of aid in SIDS, including its contri-bution to long-term energy transition pathways, its effectiveness in addressing access gaps and high costs and evaluation of the technical and financial sustainabil-ity of the solutions being implemented. In our analysis, we only looked at electricity access rates but not other relevant metrics for aid effectiveness, like changes in electricity costs, energy system reliability, the fiscal bur-den of energy or the environmental sustainability of SIDS energy systems. These would also be interesting to examine in future research, especially for those SIDS where energy access rates are already high and therefore access is presumably not the focus of current aid pro-grams. Finally, in evaluating energy aid’s contribution to the sustainable development agenda, it would be valu-able to see future work examine who bears the costs of new energy projects, since different energy choices imply an uneven distribution of costs and benefits. It could also examine the types of innovation in public policy that might ensure clean energy is rolled out efficiently and equitably and that it enhances livelihoods for the poorest without creating new financial burdens.
International development finance remains a critical resource for island states. Its effectiveness in funding material improvements in energy access, costs and sus-tainability will influence the broader sustainable develop-ment agendas of small island communities. To this end, more finance and more effective use of these funds are required to tackle SIDS energy challenges.
Endnotes 1 Seehttp://unohrlls.org/about-sids/country-profiles/. 2 See: http://www.oecd.org/dac/financing-sustainable- development/development-finance-standards/What-is-ODA.pdf. 3
OOF is defined at: https://data.oecd.org/drf/other-of-ficial-flows-oof.htm
4
See:http://www.oecd.org/dac/stats/crsguide.htm
5
World Bank population data was accessed at:https:// data.worldbank.org/indicator/sp.pop.totl
Abbreviations
ADB:Asian Development Bank; AfDB: African Development Bank;
CRS: Creditor Reporting System; DAC: Development Assistance Committee of the OECD; GDP: Gross domestic product; IADB: Inter-American Development Bank; IBRD: International Bank for Reconstruction and Development; IDA: International Development Association; IRENA: The International Renewable Energy Agency; LDCs: Least developed countries; NDCs: Nationally Determined Contributions submitted to the UNFCCC; ODA: Official Development Assistance (remove second abbreviation, on p4); OECD: Organisation for Economic Cooperation and Development; OOF: Other official flows; SDGs: Sustainable Development Goals; SIDS: Small Island Developing States; UNFCCC: United Nations Framework Convention on Climate Change
Acknowledgements Not applicable.
Funding
Funding for this study was provided from the Swedish International Development Agency, Sida, to the Stockholm Environment Institute.
Availability of data and materials
All data used for this analysis is publicly available from the OECD DAC Creditor Reporting System. Seehttps://stats.oecd.org/Index. aspx?DataSetCode=crs1
Authors’contributions
All authors have collaboratively contributed to all phases of the research and in the development of the manuscript. Both authors read and approved the final manuscript.
Ethics approval and consent to participate Not applicable
Consent for publication Not applicable
Competing interests
The authors declare that they have no competing interests.
Publisher’s Note
Springer Nature remains neutral with regard to jurisdictional claims in published maps and institutional affiliations.
Received: 5 December 2018 Accepted: 5 March 2019
References
1. Blechinger P et al (2016) Global analysis of the techno-economic potential of renewable energy hybrid systems on small islands. Energy Policy 98:674–687 2. Colmenar-Santos A, Monzón-Alejandro O, Borge-Diez D, Castro-Gil M (2013)
The impact of different grid regulatory scenarios on the development of renewable energy on islands: a comparative study and improvement proposals. Renew Energy 60:302–312
3. Journeay-Kaler P, Taibi E, Roesch R, Benmarraze S, Cioci M (2017). SIDS Lighthouses Quickscan: interim report. International Renewable Energy Agency, Abu Dhabi.
4. Mofor L, Isaka M, Wade H, Soakai A (2013) Pacific lighthouses: renewable energy roadmapping for islands. International Renewable Energy Agency, United Arab Emirates
5. IRENA (2012) Policy challenges for renewable energy deployment in Pacific island countries and territories. International Renewable Energy Agency. United Arab Emirates
6. King D (2014) Debt and development in SIDS: issues, institutions, and insights. In: Debt and development in small island developing states. Palgrave Macmillan, US, pp 251–265.https://doi.org/10.1057/ 9781137392787_12
7. Pauw P et al (2017) NDC Explorer.https://doi.org/10.23661/ndc_explorer_ 2017_2.0
8. SP. SIDS accelerated modalities of action (SAMOA) pathway. (2014) 9. United Nations General Assembly. Transforming our world: the 2030
Agenda for Sustainable Development. (2015)
10. Dornan M, Jotzo F (2015) Renewable technologies and risk mitigation in Small Island Developing States: Fiji’s electricity sector. Renew Sust Energ Rev 48:35–48
11. Dornan M, Shah KU (2016) Energy policy, aid, and the development of renewable energy resources in Small Island Developing States. Energy Policy 98:759–767
12. Betzold C (2016) Fuelling the Pacific: aid for renewable energy across Pacific Island countries. Renew Sust Energ Rev 58:311–318
13. Timilsina GR, Shah KU (2016) Filling the gaps: policy supports and interventions for scaling up renewable energy development in Small Island Developing States. Energy Policy 98:653–662
14. Dornan M (2014) Access to electricity in Small Island Developing States of the Pacific: issues and challenges. Renew Sust Energ Rev 31:726–735 15. van Alphen K, Kunz HS, Hekkert MP (2008) Policy measures to promote the
16. Hemstock S, Smith R (2012) The impacts of international aid on the energy security of Small Island Developing States (SIDS): a case study of Tuvalu. Cent Eur J Int Secur Stud 6:81–102
17. Ince D, Vredenburg H, Liu X (2016) Drivers and inhibitors of renewable energy: a qualitative and quantitative study of the Caribbean. Energy Policy 98:700–712
18. Keeley AR (2017) Renewable energy in Pacific Small Island Developing States: the role of international aid and the enabling environment from donor’s perspectives. J Clean Prod 146:29–36
19. Niles K (2012) Energy aid in Caribbean and Pacific small island developing states (SIDS). University of Otago, Dunedin
20. IEA EGRD (2016) Island energy–status and perspectives. IEA Experts’Group on R&D Priority Setting and Evaluation (EGRD), International Energy Agency, Paris 21. Lim Tung OJ (2017) Towards a regional energy framework for African SIDS:
prospects and challenges. J World Energy Law Bus 10:220–234
22. Yu X, Taplin R (1997) A survey: international aid for renewable energy in the Pacific Islands since the 1970s. Energy Policy 25:501–516
23. Niles K, Lloyd B (2013) Small Island Developing States (SIDS) & energy aid: impacts on the energy sector in the Caribbean and Pacific. Energy Sustain Dev 17:521–530
24. Wade H, Syngellakis K, Soakai A (2013) Nauru energy sector summary report. Secretariat of the Pacific Community (SPC), Deutsche Gesellschaft fur Internationale Zusammenarbeit (GIZ), and the International Renewable Energy Agency (IRENA), Nauru
25. Weisser D (2004) On the economics of electricity consumption in small island developing states: a role for renewable energy technologies? Energy Policy 32:127–140
26. Gualberti G, Lyons L (2017) Missing the mark: gaps and lags in
disbursement of development finance for energy access. Sustainable Energy For All, Washington DC
27. IRENA & CPI (2018) Global Landscape of Renewable Energy Finance. International Renewable Energy Agency and Climate Policy Institute, Abu Dhabi
28. UNFCCC (2010) Report of the Conference of the Parties on Its Fifteenth Session, Held in Copenhagen from 7 to 19 December 2009. United Nations Framework Convention on Climate Change, Bonn
29. UNFCCC (2008) Report of the conference of the parties on its thirteenth session, held in Bali from 3 to 15 December 2007. United National Framework Convention on Climate Change, Bonn
30. Delina LL (2011) Clean energy financing at Asian development bank. Energy Sustain Dev 15:195–199
31. Gualberti G, Singer CE, Bazilian M (2013) The capacity to spend development funds in the energy sector. Util Policy 26:36–44 32. Gualberti G, Martins LF, Bazilian M (2014) An econometric analysis of the
effectiveness of development finance for the energy sector. Energy Sustain Dev 18:16–27
33. World Bank. World Bank Open Data. Available at:https://data.worldbank. org/indicator/eg.elc.accs.zs?year_high_desc=false. Accessed 1 Oct 2018 34. Brant P (2018) Mapping Chinese aid in the pacific. Lowy Institute, Sydney 35. Kim SE, Urpelainen J (2013) International energy lending: who funds fossil