© Universiti Tun Hussein Onn Malaysia Publisher’s Office
IJIE
Journal homepage: http://penerbit.uthm.edu.my/ojs/index.php/ijie
The International
Journal of
Integrated
Engineering
ISSN : 2229-838X e-ISSN : 2600-7916
*Corresponding author: [email protected]
147
Measurement of Odour on Source of Drinking Water Using
Threshold Odour Number and Modified Olfactometry
Syafinah Yusoff
1, Nastaein Qamaruz Zaman
1,*, Nurashikin Yaacof
1, and Nurul
Hana Mokhtar Kamal
11School of Civil Engineering,
Universiti Sains Malaysia, 14300 Pulau Pinang, MALAYSIA
*Corresponding Author
DOI: https://doi.org/10.30880/ijie.2019.11.01.016
Received 16 May 2018; Accepted 13 August 2018; Available online 10 May 2019
1.
Introduction
In general, unpleasant odour in drinking water may have biological and industrial origins. Odour that comes from natural sources maybe the effect of the human activities. For example, the dumping of raw sewage in the aquatic environment may enhance biological growth and consequently a foul odour. Odour can be measured either in air or water. The most common measurement in air is at the point of emission. Normally, the source of pollution manifested by an odour problem differs from one water source to another. However, the measurement of the odour on water should also be considered because odour is also one of the parameter that can contribute to water quality. Threshold Odour Number (TON) is the one of the acceptable method to measure odour in water based on the Standard Method [1].
TON involves serial dilution of the sample with equal volume of odour free water that is perceivable by 50% of a panel of judges under controlled test conditions [2]. To determine the TON, one indicate at the lowest TON that is conceivable and that the water sample has a recognizable odour. If the water samples are undiluted and have no detectable odour then it should be reported as “odourless” [1]. In odour measurement, no standard TON value has been
Abstract: Concerns on odour of water have increased rapidly. However, odour measurement in water for drinking
sources has yet to be established in Malaysia. More study is needed for an approach to quantify the odour incidences in water supply, one that is effective and applicable as a guideline towards the early identification of contamination occurrences. Thus, the objective of this study was to identify correlation (if any) between Threshold Odour Number (TON) test with a portable olfactometry plus odour wheel (POPOW) combination method for assessing odour in drinking water. Water samples collected from a drinking water supply system was tested for odour concentration as well as its character based on an odour wheel. Results from the Pearson correlation showed that the TON and POPOW gave the r-value of 0.833 which indicates that both method highly correlate with a level of confidence of 99 percent. Sample water that was taken near the main source of drinking water was given off as earthy smell, indicating geosmin as a likely contaminant. On the other hand, treated water samples taken directly at the treatment plant had a distinctive, chlorinous odour, which was expected from it use of chlorine as a disinfectant. This study has demonstrated the effectiveness of the portable olfactometer and odour wheel combination method for detecting odour in drinking water supply with at par results to the standard TON. More importantly, POPOW would enable the assessment of odour at site and at a shorter test preparation time, traits which are important especially for remotely located sites.
recommended for determining the acceptability of odours in drinking water, although water with a TON of 2 may lead to more consumer complaints than water with a TON of 4 [3].
In some instance, small concentrations of few substances in water can cause intense odours that result in large TON values. These large values normally will give the consumer uncomfortable feeling lead to complaint [3]. As such, olfactometry which is commonly applied for ambient odour assessment may be considered as an alternative measurement for odour in water. Similar with TON, odour determination using olfactometer, also involves sample dilution and its detection by 50% of panellist to represent an odour unit. However, instead of water, the diluting medium is air, meaning that odour emanating from the odorous water will be measured instead [4]. Natural Resources and environment Board (NREB) has used such approach on water from two rivers in Sarawak and resulting in the same size of order for the correlation factor. Having said that, the finding was limited in terms of the odour characteristics. Although the study by NREB was promising, the results also show the need for more investigations, especially more valid determinations of TON [4]. The odour character were described in the study however, the character of odour can be characterise by using odour wheel which is more specific and useful for indicating the contaminant as well [5].
Odour wheels are used to characterize a particular odour in term of quality, note, type, group or category and determine the intensity of each characteristic. Normally in determination of odour in water, the research only focus on concentration and intensity of the odour. Odour wheels can be used by expert odour panels to characterise the details of each odour characteristic and intensity and to express their responses in terms similar to their particular community. Odour wheel is the development of a common language or a “periodic table” of odour responses. Drinking water suppliers aim to produce water that does not have any taste or odour problems. Natural products produce different types of smell, such as grass, hay, wood, fishy, fruity and flowery and they are present in water resources including lakes, streams and groundwater, they also produce background dissolved organic matter and suspended solids of these water bodies [5]. The study by Fischer et al. [6] is an example of a recent application of odour wheel in the management of odour from municipal wastewater sludge. Their study had effectively identified the causes of odour nuisance. The odour wheel was able to link between odour and odorants to the process conditions and its effective abatement and management practices.
The second method used indicates the potentiality of using the OU method for the determination of odour. In this study, an olfactometer was used to measure odour in air. In Malaysia, a standard known as MS 1963:2007 has been developed to assess environmental odour [7]. A portable olfactometer was used. This method has been modified to suit with the required measurement. olfactometer was used in this study because the odour unit of a given odour is small [4]. This method was modified on the basis of traditional olfactometry. The sample were prepared in accordance with a Danish procedure [8]. A water sample was placed in a bottle or sealed tight case. The bottle then filled with filtered air and collected in a bag sample. A previous study showed that the odour of an air sample were prepared in accordance with a Danish procedure [8]. The underlying principle involves the simulation of wind blowing over a river or a pond surface. When the wind blows over a liquid surface, compounds dissolved in the liquid evaporate and become carried by the wind. A 1-L glass bottle was filled to the shoulder with a water sample. Carbon filtered air from the room was pumped through a sintered glass tube just above the surface (1 L/min). Air was collected in a sampling bag made of Tedlar in accordance with the European Standard for odour analysis.
Chlorine is added to a water treatment plant as a disinfection in the final stages of treatment to kill harmful microorganisms that may be present in water. In Malaysia the limit of free chlorine in water is 0.2-5.0 mg/L [9]. Changes in water temperature can also influence chlorine concentrations; for instances, high chlorine concentrations are detected in winter [10]. Occasionally, chlorine concentration is increased to deal with operational issues. The chlorine concentration found in drinking water are not harmful. However, some people are more sensitive to the state and smell of chlorine than others. For instance, chlorine odours that may be produce from hypochlorous acid are detected at low pH levels in which it is preferred to odourless hypochlorite ion. The pH of a solution can influence the rates of chemical reactions that lead to the production of odours. This phenomenon can be an important consideration because insufficient attention to the influence of pH may lead to the production and buildup of odour in the water mains [11].
The pH value of the water indicates whether it is acidic or alkaline. In Malaysia, the permissible limit pH of drinking water is 6.5 - 9 [9]. A previous study showed that highly alkaline water may cause excessive mucous membrane formation and alkalosis. The toxicity of certain substances present in water may increase because of their interaction with high or low pH levels; consequently, their increased toxicity may be detrimental to an organism [12]. For pH, it can be related to odour when it is in the neutral form, and it forms an odour under circumstances in which it controls the equilibrium distribution between the neutral and ionic forms of a substance that gives rise to an odour.
2.
Methodology
2.1 Sampling Location
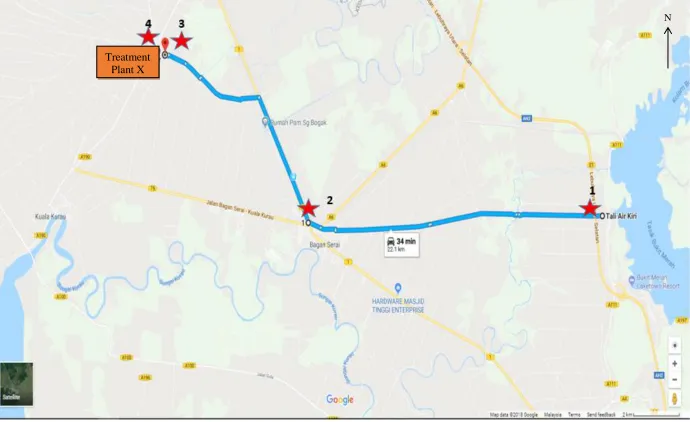
The sample was taken from four different points. The main source of this water come from Tasik Bukit Merah, which is the main source of clean water around the area. Water then flows into a river and a canal surrounding the area. The sampling point was chosen on the basis of the accessibility of the places. The first point with coordinates of 5.0175764, 100.6516289 was the nearest to the main sources. The second sampling point, with the coordinates of 5.0146766,100.5328988 was around Bagan Serai near the bridge crossing. The third (5.065038, 100.477462) and fourth sampling point (5.065066, 100.476585) were at treatment plant X. The third point was at the intake before the entry point of the treatment plant. The final point was taken at the outlet of the lab of the treatment plant.
Fig. 1 presents the map of the four sampling points. The distance from first point to the second point was approximately 22 km, whilst the distance from the second point to the third and final point was 20 km by car.
2.2 Threshold Odour Number (TON) test
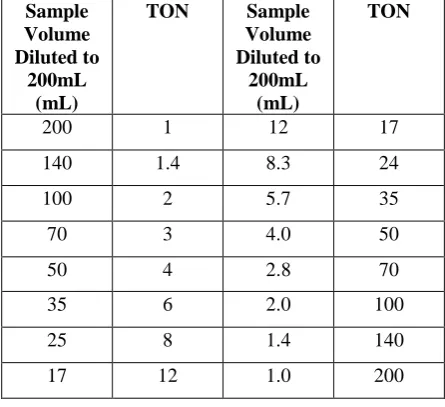
Each of the sample was analysed by using the TON method. Firstly, the samples were added to four wrinkle bottles with the volume of 200, 50, 12 and 2.8 mL. A sufficient amount of odour-free water was added to all of the flask to create a total volume of 200 mL. The sample were maintained at 40°- 60°C. The flasks were arranged in an ascending order and it is swirled before sniffed by the operator (Fig. 2). The first flask with a detectable odour was labelled. The next dilution was prepared on the basis of Table 1 below for the panels to test [1].
Table 1 - Table of dilutions of various odour intensity
Table 2 - Threshold odour numbers corresponding to various dilution
Sample Volume Diluted to 200mL (mL) TON Sample Volume Diluted to 200mL (mL) TON
200 1 12 17
140 1.4 8.3 24
100 2 5.7 35
70 3 4.0 50
50 4 2.8 70
35 6 2.0 100
25 8 1.4 140
17 12 1.0 200
Sample Volume in Which Odour is First
Noted (ml)
Volumes To Be Diluted To 200 ml
200 200,140,100,70,50
50 50, 35, 25, 17, 12
12 12, 8.3, 5.7, 4, 2.8
-
Sampling PointsFig. 1 - The map of the sampling points
N
Two flasks containing odour-free water were added as blanks. A panellist was given a questionnaire and instructed to detect and describe the odour of a particular sample. TON was determined from the least concentration of the water sample that was first noted by the panellist. The operator could determine the TON based on Table 2.
Fig. 2 - One of the panellist is sniffing the samples
2.3 Portable olfactometry plus odour wheel (POPOW) combination method
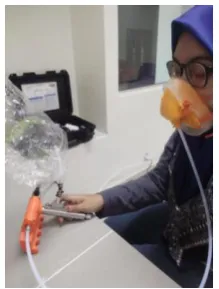
Only one operator is needed for this method. The sample was analysed by using a SM100 portable olfactometer. The air sample was prepared in accordance with a Danish procedure [8]. Fig. 3 and Fig. 4 show the equipments used and how the experiment is being carried out. Intensity of the odour will be determined from this method, which give the result in ou/m3.
Fig 3. - The sample collected into the sampling bag to be tested
Fig. 4 - Operator analyzes the sample using portable olfactometer
2.4 Determination of Odour Characteristics using Drinking Water Odour Wheels
Fig. 5 - Odour Wheel [16]
2.5 Determination of Chlorine
All samples taken was also determined their content of chlorines. The chlorine was determined by using the titration method following the standard method in APHA 21st edition [11].
2.6 Determination of pH
The pH of all samples were determined by using YSI Professional Plus multi-parameter instrument. The equipment was first calibrated before taking the reading of pH.
2.7 Data Analysis
All of the data collected were analyzed. Data for TON, odour intensity (ou/m3), chlorine and pH were analysed by using IBM SPSS Statistic 21.0. From SPSS, Pearson’s correlation (r-value) was used to determine the correlation between these two methods (TON and POWOW) as well as with the parameters (chlorine and pH). The linear correlation (R2-value) of all the data was also determined by using SPSS. Results from the odour wheels were also determined by using SPSS by using the pie chart to present the percentage of the characteristics that can be determined from each of the samples.
In this study, a Pearson correlation matrix was used to determine the relationship between variables. The classification was based on Guildford’s rule of thumb for interpreting the Pearson product moment correlation [14] (Table 3).
Table 3 - Guildford’s rule of thumb for interpreting correlation coefficient [17]
r-value Interpretation
0.0 to 0.29 Negligible or little correlation 0.3 to 0.49 Low correlation
0.5 to 0.69 Moderate or marked correlation 0.7 to 0.89 High correlation
0.9 to 1.00 Very high correlation
3. Results and Discussion
3.1 Odour Profile of Sampled Drinking Water
100% chlorinous or bleachy smell (Fig. 12). According to the odour wheel, the sample contained free chlorine or chloramine.
These results indicated that each sample had different kinds of contaminants because all of the samples were obtained from various places. Even if the samples had the same flows, the values of the contaminants might differ in each place and water was flowing. For example, Sample 4 was taken from the outlet of treatment plant X, whose water has been treated. As such, other contaminants are not detected. However, the smell of chlorine was also the highest in this sample because chlorine is used to treat the water. The value of chlorine was also the highest in this sample amongst the detected chlorine in the other samples, but this result does not suggest that water containing chlorine is a healthy risk because this method only measure odour intensity [5].
Fig. 9 - Characteristic in sampling point 1
Fig. 10 - Characteristics in sampling point 2
Fig. 11 - Characteristic in sampling point 3
Fig. 12 - Characteristic in sampling point 4
3.2 Correlation of the methods and the parameters
Table 4 below shows the correlation of the methods and other parameter. The results were as follows.
Table 4 - Result of correlation of the methods and parameter
Correlation TON OU CHLORINE pH
TON 1
OU 0.833** 1
CHLORINE 0.808** 0.734** 1
pH 0.202 0.301 1
**correlation is significant at the 0.01 level
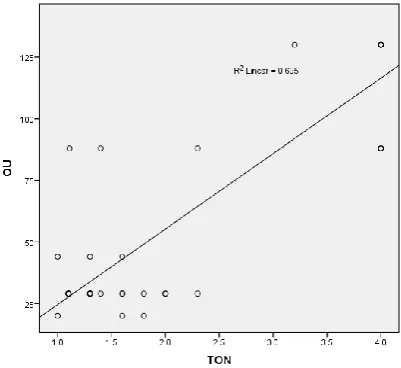
Pearson’s correlation indicated that r was 0.833 which corresponded to a high correlation between both methods (Table 3). The results also significant to the confidence level of 99 percent. Fig 6 shows that both methods were positively correlated. R2 was 0.695 suggesting that the data were scattered around and fitted in the model because most variability of the response data was scattered around its mean. This result shows that TON and OU is highly related.
Samples 3 Characteristics
TON was more known to measures the dilution number, not odour intensity [15]. Where else, OU was a method used to measure the odour intensity. This is why it is important that both of this method need to be correlated.
The others graph revealed the correlation between other parameters based on the measured values of each method. Both methods were correlated with chlorine. Fig. 7 shows the significantly high correlation between TON and chlorine (r of 0.808 and 99% confidence level). The correlation was high because r was close to 1. The graph also indicated that the linear correlation between TON and chlorine had less variance and was less scattered. R2 from the graph is 0.653. Fig. 8 illustrates the correlation between Chlorine and OU. Pearson’s correlation suggested that these two parameters were moderately correlated with a value of 0.734 and R2 was 0.539, implying that the linear correlation was lower than the Pearson’s correlation. As for the pH value, the correlation for pH with both TON (0.202) and OU (0.301) was very weak. The pH value was not correlated to both OU and TON because pH for all of the sample were almost the same. The range of the pH value were between 6 to 7. This however, showed that there might be an influence to the odour since, it can be related to odour when it is in the neutral form [11].
A previous study by NREB [8] determined the correlation between these methods by using correlation factors and showed that the correlation factor range of all rivers was 5 to 17. However, NREB study still need more valid determinations of TON especially. The characters of odour was described but it does not mention what references was used. Therefore, in this study we used odour wheel to described the odour characteristics so that we can predict the odour contamination.
Fig. 6 - Correlation between TON and OU
Fig. 8 - Correlation between Chlorine and OU
4.0 Conclusion
This study mainly reveals the correlation between the two methods. Both of the methods measure odour and its intensity in water. TON is calculated by using the dilution method. In the OU method, the result was given on the basis of the analysis of the olfactometer in ou/m3. The correlation of TON and OU is high with a value of 0.833. This result shows that both methods are highly correlated. However, different sampling points have various odour characteristics. For example, Sample 1 has 100% earthy smell, and Sample 2 has a mixture of musty (50%), earthy (37.5%) and fishy (12.5%) smells. This phenomenon may be caused by the different compounds in water. Since the river is always flowing and a non-stagnant water therefore, each point may have different contaminant. Therefore, this study shows that odour in water can be measured using both methods. However, the modified olfactometer is easy and efficient. An odour wheel can also be used to determine characterize odour and water contaminants. In the future, further analysis on the contaminant is proposed to confirm that the contaminants exist in the water.
Acknowledgement
The author would like to acknowledge the financial support provided by the Ministry of Higher Education through the FRGS grant, project code F1182.
References
[1] Easton A. (2005). Method 2150B, Standard methods for the examination of water and wastewater. Washington: APHA-AWWA-WEF.
[2] American Public Health Association (2005). Standard methods for the examination of water and wastewater (21st ed.). Washington: American Public Health Association.
[3] Baker, R. A. (1964). Dechlorination and sensory control. Journal - American Water Works Association, 56(12), 1578-1592.
[4] Danish International Development Assistance (2005). Natural Resources and Environment Board Sarawak. Copenhagen: Danish International Development Assistance.
[5] Suffet I. H. and Rosenfald P. (2007). The anatomy of odour wheels for odours of drinking water, wastewater, compost and the urban environment, Water Science and Technology, 55(5), 335-344.
[6] Fisher, R., Barczak, R., Suffet, I., Hayes, J. and Stuetz, R. (2018). Framework for the use of odour wheels to manage odours throughout wastewater biosolids processing. Science of the Total Environment, 634, 214-223. [7] European Standard (2007). Air quality - determination of odour concentration by dynamic olfactometry.
Brussels: EN 13725:2003/AC.
[8] Boholt, K. (1997). Procedure for measurement of odour measurement from open area sources without outgoing air. Copenhagen: The Danish Environmental Protection Agency Danish.
[9] Ministry of Health (2010). Drinking Water Quality Surveillance Programme. Retrieved on Jun 22, 2018 from http://kmam.moh.gov.my/public-user/drinking-water-quality-standard.html
[10] Komathi J., Thamimum A. and Balasubramaniam A. (2017). Physicochemical Characteristics of surface water in vellore district. International Journal of Current Research in Chemistry and Pharmaceutical Sciences, 4(3), 6-10. [11] Health Canada (1979). Guidelines for Canadian Drinking Water Quality. Guideline Technical Document. Ottawa:
[12] Swapnil, R., Joann M. and Walter C. (2006). Iron intake and the risk of type 2 diabetes in women. Diabetes Care, Vol 29, 6., 1370-1376.
[13] Rice, E. W., Baird, R.B., Eaton, A. D. and Clesceri, L. S. (2012). standard methods for the examination of water and wastewater (22nd ed.) Washington: American Public Health Association.
[14] Kura, N., Ramli, M., Sulaiman, W., Ibrahim, S., Aris, A. and Mustapha, A. (2013). evaluation of factors influencing the groundwater chemistry in a small tropical island of Malaysia. International Journal of Environmental Research and Public Health, 10(5), 1861-1881.
![Table 3 - Guildford’s rule of thumb for interpreting correlation coefficient [17]](https://thumb-us.123doks.com/thumbv2/123dok_us/8436193.1699576/6.595.202.395.72.275/table-guildford-s-rule-thumb-interpreting-correlation-coefficient.webp)