THE DETERMINANTS OF FINANCIAL LEVERAGE FOR
SURVIVING LISTED COMPANIES IN MALAYSIA
Haslindar Ibrahim
Universiti Sains MalaysiaTeik-Cheng Lau
Universiti Sains MalaysiaABSTRACT
This paper investigates the relationship between the determinants and financial leverage of the surviving public listed companies in Malaysia. A total of 151 surviving publicly listed companies in the Bursa Malaysia were selected from year 2000 to 2015 (16 years), after filtering from the total of 474 companies. The descriptive statistics result was gathered before performing panel data analysis by using fixed effect model. This study applies four determinants as independent variables, namely asset tangibility, growth opportunities, profitability and liquidity with firm size as a control variable. The financial leverage is measured by the short term debt ratio, long term debt ratio and debt ratio acting as the dependent variables. The findings reveal that asset tangibility and growth opportunities are both significant positively related to long term debt and debt ratio, showing that firms prefer to use long term debt to finance their fixed assets and growth, support the trade-off theory. Profitability and liquidity are found to be significant negatively related to short term debt ratio and debt ratio, consistent with the pecking order theory, implying that more profitable and liquid surviving companies tend to use internal sources (retained earnings) as priority in making their financial leverage decisions by utilizing these funds to finance business activities and expecting to have lower leverage. This study corroborates the use of internal sources as priority for financial leverage decisions as compared to external sources for surviving and performance sustainability.
Keywords: Surviving company; Short term debt ratio; Long term debt ratio; Debt ratio; Trade off Theory; Pecking order Theory.
1. INTRODUCTION
The issues on credit expansion have been widely debated or discussed all over the time and became an important issue of concern since the past 40 years. Many firms have struggled with strong capital structures over the past 4 decades and always failed to make sure sufficient liquidity to survive in the unavoidable contractions during the financial credit expansion cycles. From the finance point of view, capital structure is considered the method how firm's asset been financed via the combination of equity, debt, or hybrid securities. In short, it is a mixture of company's debts, common and preferred equity (San and Heng, 2011).
Corresponding author: Haslindar Ibrahim, School of Management, Universiti Sains Malaysia, 11800 USM, Penang, Malaysia;
According to Gorriz and Fumas (2005), they explained about the surviving listed firms refer to those companies which can maintain and remain listed in the stock market for at least 15 years continuously. In their study, they found that the performance of the surviving family listed firms in Spanish have higher productive efficiency than surviving non-family listed firms. Therefore, this study adopted the year of surviving at least 15 years remain listed on the Bursa Malaysia as defined by Gorriz and Fumas (2005) to select the companies for this study. With regards to the leverage, Booth, Aivazian, Demirguc-Kunt, and Maksimovic(2001), in their cross-country study indicated that the Malaysian market has a significant proportion of total equity capitalization and among six countries (Brazil, Mexico, Zimbabwe, Jordan, Turkey, Thailand) which categorized as a low-debt country category. Malaysia accumulates relatively less foreign borrowings than other Southeast Asian countries. Moreover, the country's economy falls under a low inflation group amongst the developing countries and enjoy a high real-growth rate, but have a high business risk. The Malaysian data for their study comprised of abbreviated financial statements for only the largest companies in the country from 1980 to 1990 collected by International Finance Corporation (IFC).
There are increasing researches done on capital structure determinants in Malaysia nowadays and consist of some sectors. For instance, Pandey (2004) found a saucer-shape relationship between profitability and capital structure in Malaysia due to agency costs, costs of external financing and interest. Furthermore, a research study done by Mat Kila and Mahmood (2008), their results showed that Malaysian firms have unique characteristics. However, the sample size was too small for this research, whereby only 17 companies were taken into consideration. In addition, Pratomo and Ismail (2006) conducted their research on capital structure focused just only in the Islamic bank performance. Besides, Mahmood et al. (2011) had focused on the property sector in their research study. Results showed that companies in the property sector normally rely heavily or mainly on external funding to support their investment activities. Also, findings suggested that capital structure in the property sector cannot reflect overall situation as explained by the specific determinants. In addition, the research conducted by Mahmood and Zakaria (2007) was also limited to the property and construction sectors only.
On the other hand, Jamal et al. (2011) highlighted that growth opportunity, liquidity and tangibility influence firm's financing decisions in the Malaysian trading and services sector. However, profitability and firm size does not appear to have any significant effect on their capital structure decision. Therefore, good financial decision cannot be generating based on existing results whereby insufficient evidence to prove the relationship between the factors influencing the capital structure decisions in Malaysian firms. Hussain et al. (2015), they investigated profitability, size, growth opportunity, asset tangibility and liquidity which are firm specific factors determine the capital structure of Malaysia’s listed companies in food producer sector. Furthermore, Mat Nor et al. (2000) also discussed about the key factors used by the researches to determine the capital structure in Malaysia’s companies are size, firm reputation, profitability, tangibility asset, liquidity, growth opportunities, cash flows, age, non – debt tax shield, taxation, size of the board, presence of non-executive directors on the board, presence of independent non-executive directors on the board and CEO/Chair duality.
been practice in Malaysia and those findings cannot represent whole firms in Malaysia due to uniqueness of the industry.
Therefore, the aim of the study is to investigate the relationship between asset tangibility, growth opportunities, profitability, and liquidity as the core determinants of debt level or capital structure decisions to survive their companies. The interest to conduct this research is to determine which factors are important in the selection of a mix of capital structure. The empirical results from the study can be used by business corporate managers to set their financial policy and help investors make better investment decision while investing in sustainable, profitable, surviving listed companies in Malaysia. Besides, this research also contributes to the literature by examining the determinants of firm capital structure in Malaysia.
The remainder of this paper is organized as follows. Section 2 discusses the relevant literature on leverage, determinants and hypothesis development. Section 3 describes the methodology and data. Section 4 presents the main results and discussions of the empirical analysis. Section 5 concludes and provides some implications.
2. LITERATURE REVIEW
Countless literatures in Malaysia and abroad had been reviewed on the research study of Modigliani and Miller (MM), Trade-off Theory (TOT) and Pecking Order Theory (POT). Based on Quan (2002) research, POT been applied to propose a rational justification to the prediction of a preference of debt to equity in the decision making process made by the firm when there is a need for fund raising capital outside the company in the light of the MM suggestion and other existing theoretical hypotheses as well.
The Trade-off theory (TOT) defines that the corporation’s capital structure decisions involve a trade-off situation between the tax benefits of debt financing and the costs of financial distress. The cost of financial distress is depending on the financial distress and cost of bankruptcy. In fact, this implication points out that there is no reasonable amount of debt for any individual corporation. As a result, the optimal debt ratio (debt capacity) varies from firm to firm. Miller (1977) proposes TOT which mentioned that firms choose the proportion of debt finance and equity finance after balancing the tax advantages of debt against the costs of possible financial distress (Chee, 2010). According to Titman and Wessels (1988), the corporations which have safe tangible assets and various taxable incomes have high debt ratio. Furthermore, TOT also clarify that most of the profitable corporations gain benefit from the tax shield by debt financing because there is low possibility for them to go bankrupt. Thus, profitable firms are capable to raise their debt ratio more than those less profitable companies. Although the TOT has dominated firm finance circles for a long time, interest is also being paid to the pecking-order theory.
information asymmetries between insiders and outsiders of company. According to theory, companies follow a preferential order of financing sources, and that before seeking debts, they would use internal funds. Thus, the more profitable companies would tend to have fewer debts and conversely low profitable companies use debt financing due to insufficient resources generated internally.
The literature on capital structure has focused around two main theories, the trade-off theory and the pecking order theory. Prior to providing empirical evidence on their relevance, the descriptive analysis of this thesis attempts to document the broad financing patterns of firms in Malaysia especially by focusing on the surviving listed firms. This process involves exploring the data for possible distinct financing trends, and relating the observed patterns to the movement in the economy for a period spanning 16 years from 2000 to 2015. Following the lead of many prior empirical studies (Myers, 1984b; Titman and Wessels, 1988; Rajan and Zingales, 1995; Wiwattanakantang, 1999), this paper investigates the determinants of capital structure based on firm-specific factors, especially those variables found in Malaysian-based studies by focusing on the behavior of surviving listed companies in making their capital structure decision or financial leverage.
2.1. Hypothesis Development
This study will examine the relationship between the capital structure determinants such as asset tangibility, growth opportunities, profitability, and liquidity and short term debt, long term debt, and debt ratio of surviving listed companies in Malaysia.
2.1.1. Asset Tangibility and Leverage
According to Titman and Wessels (1988) and Harris and Raviv (1991), asset tangibility is the major factor in determining the firm’s debt level. The empirical studies proved that the above theoretical prediction and empirical findings include Long and Maltiz (1985), Friend and Lang (1988), Rajan and Zingales (1995) and Wald (1999). Theoretically, asset tangibility is positively related to debt ratio (Williamson, 1988; Harris and Raviv, 1991). Jensen and Meckling (1976) found that the agency cost of debt exists as the firm may shift to riskier investment after the issuance of debt, and transfer wealth from creditors to shareholders to exploit to the option nature of equity. This also supported by Wickramanayake (2009) which used the small medium enterprises (SEMs) in Malaysia as the sample study.
Ahsan et al. (2016) in their studies found that a positive relationship between asset tangibility and long term debt, but a negative relationship with short term debt. These research findings implied that Pakistani companies prefer retained earnings to finance their business operation. Besides, debt is easily available for experienced companies as well. Besides, other recent study by Hussain et al. (2015), examined the capital structure determinants of Malaysian listed companies in food producer sector. The research study done on 45 companies listed under food producer sector at Bursa Malaysia for the period of year 2003-2012, total observations is 450 firms. From the findings, that asset tangibility is founds positively related to total debt ratio consistent with Cekrezi (2013), Vergas et al. (2015) and Chadha and Sharma (2015). Thus, below are the testable hypotheses for this study.
H1a: Asset tangibility is negatively related to short term debt ratio of surviving companies. H1b: Asset tangibility is positively related to long term debt ratio of surviving companies. H1c: Asset tangibility is positively related to debt ratio of surviving companies.
2.1.2. Growth Opportunities and Leverage
This variable can be explained by two theories: agency cost theory and pecking order theory. Both theories displayed contradictory position. According to Sinha (1992), there is a positive relationship between growth and leverage since higher growth opportunities implies a higher demand for funds, and, ceteris paribus, a greater preference on external financing through the preferred source of debt according to the pecking-order theory. This theory contends that management prefers internal to external financing and debt to equity if it issues securities (Myers, 1984a). Thus, it suggests the higher proportion of debt in capital structure of the growing enterprises than that of the stagnant ones. Chung (1993), Chaplinsky and Niehaus (1990) showed the evidence contrary to the pecking order theory.
As for agency cost theory, there is negative relationship between growth opportunities and debt ratio. Agency cost theory suggests that equity controlled firms tend to invest sub-optimally to expropriate wealth from the enterprises’ bondholders (Jensen and Meckling, 1976). The agency cost is likely to be higher for enterprises in growing industries which have more flexibility in their choice of future investment (Baral, 2004). In addition, Abor and Biekpe (2009) found that growth and long-term debt are positively related while growth and short-term debt are negatively related.
Ahsan et al. (2016) found growth has significant positive relationship with long term and total debt, but negative relationship with short term debt. In addition, Vergas et al. (2015) found that growth opportunities positively, in explaining the debt. Also, there were significant changes in the determinants of market valuation, growth opportunities and tangibility due to the 2008 financial crisis. Besides, Ohman and Yazdanfar (2017) in their research study proved that a positive and significant association among growth, short and long term debt, meaning that small medium enterprises with a relatively high growth rate prefer to use more external financing. However, Hussain et al. (2015) found that the growth opportunity is to be positively but insignificant with total debt ratio.
growth opportunities and all measures of capital structure (short term, long term, debt ratio), which is statistically significant and is consistent with the trade-off theory (Alipour et al., 2015). Therefore, below are the testable hypotheses for this study.
H2a: Growth opportunities are negatively related to short term debt ratio of surviving companies. H2b: Growth opportunities are positively related to long term debt ratio of surviving companies. H2c: Growth opportunities are positively related to debt ratio of surviving companies.
2.1.3. Profitability and Leverage
According to Rajan and Zingales (1995), there are conflicting theoretical predictions on the effects of profitability on leverage. According to Pecking Order Theory (POT), firms will prefer to finance from retained earnings first, then from debt and finally from issuing new equity. This suggests a negative relationship between profitability and debt ratios (Myers and Majluf, 1984). While, Jensen (1986) predicted a positive relationship if the market for corporate control is effective. Rajan and Zingales (1995) suggested that debt suppliers should be more willing to lend to profitable firms. Vergas et al. (2015), in their empirical finding results stated a negative relationship of profitability and the total debt. Also, Chadha and Sharma (2015), their findings indicated that variables for example size, growth, profitability, uniqueness and ownership are significantly negative correlated with the firm’s financial leverage. Profitability and size of the firm coefficient results is supporting the pecking order hypothesis.
Furthermore, Frank and Goyal (2009), Cekrezi (2013) and Alipour et al. (2015) found negative relationship between profitability and capital structure as measured by short term debt, long term debt and total debt. Therefore, it is consistent with the pecking order argument, whereby the coefficients for profitability is significant negative, implying more profitable firm prefer and tend to use internal sources (retained earnings) as priority in financing decisions if compared to less profitable firm, resulting firms shall borrow less as compare to less profitable firms. The existence of a significant negative relationship between debt and profitability depends on information asymmetry between managers and investors, whereby the amount of debt depends on the amount of information asymmetry. Furthermore, the presence of debt in firms’ capital structures relies on past profitability and investment opportunities (Alipour et al., 2015).
Consistent with Ahsan et al. (2016), their findings proved that profitability is negatively associated but with long term debt. Also, Ohman and Yazdanfar (2017), the results deeper present that profitability is negatively and significantly related to the short term debt and long term debt, meaning that more profitable Swedish SMEs are less likely to use external financing. Furthermore, in recent research, Hussain et al. (2015) found profitability, size and liquidity are negatively significant related to total debt ratio in their research done in Malaysia. Below are the testable hypotheses for this study.
2.1.4. Liquidity and Leverage
The pecking order theory (POT) suggests that corporations generally prefer internal funds first as the main source of finance. So, firms with enough liquid assets can utilize these funds to finance business activities and expecting to have lower leverage. Ahsan et al. (2016), found that a negative relationship between liquidity and short term debt and total debt whereas this relationship becomes positive with long term debt. On the other hand, Chadha and Sharma (2015), in their research concluded that dividend pay-out ratio, liquidity, interest coverage ratio, cash flow coverage ratio, inflation and GDP are found to be statistically insignificant. However, liquidity and inflation has a negative coefficient.
Al-Ajmi et al.(2009) who investigated a research on capital structure decisions in Saudi Arabia by using sample of 53 firms from year 2003 to 2007 found that liquidity was significantly negative to short term debt, long term debt and debt ratio and in line with pecking order theory as well as static trade off theory. The pecking order theory suggests that corporations generally prefer internal funds first as the main source of finance. So, firms with enough liquid assets can utilize these funds to finance business activities and expecting to have lower leverage.
Alipour et al. (2015) in their study showed mixed results regarding the effect of liquidity and capital structure. The results showed that liquidity variables (current ratio) is positively related to short-term debt ratio, but negatively related to long-short-term debt ratio. Furthermore, working capital ratio also used to evaluate the liquidity of firms, proved to have a significant negative relationship with two measurements of capital structure (short-term and total debt ratio), explaining about liquid firms more prefer internal resources for financial needs consistent with the pecking order theory. As a result, the reason for negative liquidity relationship in Iran because of firms tends to utilize its liquid assets to finance their investment in the situation of external debt raising. This result is supported and consistent with Hussain et al. (2015), which their findings found that liquidity is negatively significant related to total debt ratio. Below are the testable hypotheses for this study.
H4a: Liquidity is negatively related to short term debt ratio of surviving companies. H4b: Liquidity is negatively related to long term debt ratio of surviving companies. H4c: Liquidity is negatively related to debt ratio of surviving companies.
3. METHODOLOGY
The following section shall be discussed on the methodology, data collection, and measurements of determinants and financial leverage.
3.1. Samples Selection
economic problems in Malaysia are considered lesser if compared to other countries example like Thailand, Indonesia and Korea (Weller, 1998).
Table 1: Description of Data Sample from Main Board Companies Year 2000-2015
Description of Selected Companies Number of Surviving
Listed Companies Total companies listed in KLSE main market as at Year 2000 474
Minus: Finance related companies 45
Minus: Companies fall in (PN4, PN17, delisted, non-survived) Minus: Companies with incomplete data
219 59
Final sample for the study 151
Table 1 summarized the sample selection procedures. The selections of the samples in this study were considered as following selection process. The process initially considered all the companies listed in Kuala Lumpur Composite Index (KLCI) which listed on the main board only in year 1999. There are a total number of 474 listed companies on the Main Board of Bursa Malaysia as at 31 December 1999. The final sample for the study are 151 surviving listed companies, after deduction of those firms with incomplete data, finance related companies, listed companies fall in PN4, PN17, delisted, and non-survived for a continuous at least 15 years in stock market. PN4 and PN17 are the criteria and obligations pursuant to paragraph 8.14 and 8.14c respectively of the listing requirements in the Bursa Malaysia. Both PN4 and PN17 occur when the firms having financial difficulties and PN4 is further amended to PN17 and effective on 3 January 2005.
Table 2 shows the number of surviving listed companies in Malaysia according to the industry or sector. The highest number of 38 companies survived in industrial, then follows by 34 surviving companies in trading and services industry. There are only 2, 3, and 4 surviving companies in hotels, technology, and infrastructure industry respectively.
Table 2: Number of Surviving Listed Companies According to Industry
No Industry Surviving Listed Companies
1 Trading & Services 34
2 Constructions 10
3 Property 25
4 Hotels 2
5 Industrial 38
6 Plantation 14
7 Technology 3
8 Consumer 21
9 Infrastructure 4
Figure 1: Short term debt, long term debt and debt ratio for surviving listed companies for year 2000-2015
Figure 1 exhibits the surviving listed companies in Malaysia over the period of year 2000 to 2015 show the trend for the difference of financial leverage as measured by short term debt, long term debt, and debt ratio. There are increasing debts happened since year 2000 until 2003, especially long term debt to finance assets, as surviving companies need more debts for recovery after the economic crisis, and then slowly decreasing and stable throughout the years.
3.2. Dependent Variables
The following section shall be presenting the debt ratio, short term debt ratio, and long term debt ratio.
3.2.1. Debt Ratio
Debt ratio is measured by the total debt divided by the total asset (Friend and Lang, 1988; Titman and Wessels, 1988; Rajan and Zingales, 1995; Amidu, 2007; Viviani, 2008; Hall et al., 2004; Ezeoha, 2008; Su, 2010; Alipour et al., 2015; Chadha and Sharma, 2015; Hussain et al., 2015; Ahsan et al., 2016). The total debt includes both the short term and long term interest of debt financed by listed company. It is shown by:
Debt Ratio (DR) =
TotalAsset TotalDebt Whereby:DR = Debt Ratio
∑ Total Debt = Total Debt ∑ Total Asset = Total Asset
0 0.05 0.1 0.15 0.2 0.25 0.3
2000 2001 2002 2003 2004 2005 2006 2007 2008 2009 2010 2011 2012 2013 2014 2015
M
e
a
n
Year
Short Term Debt, Long Term Debt, Debt Ratio
3.2.2. Short Term Debt Ratio
Short term debt ratio is measured by the short term debt divided by the total asset (Song, 2005; Rajan and Zingales, 1995; Hall et al.,2004; Li et al., 2009; Viviani, 2008; Ezeoha, 2008; Sogorb-Mira and How, 2005; Eldomiaty and Azim, 2008; Titman and Wessels, 1988; Alipour et al., 2015; Ahsan et al., 2016; Ohman and Tazdanfar, 2017). It is shown by:
Short Term Debt Ratio (STDR) =
TotalAsset ebt ShortTermD Whereby:
STDR = Short Term Debt Ratio
∑ Short Term Debt = Total Short Term Debt ∑ Total Asset = Total Asset
3.2.3. Long Term Debt Ratio
Long term debt ratio is measured by the long term debt divided by the total asset (Song, 2005; Rajan and Zingales, 1995; Eldomiaty and Azim, 2008; Ezeoha, 2008; Sogorb-Mira and How, 2005; Hall et al., 2004; Amidu, 2007; Alipour et al., 2015; Ahsan et al., 2016; Ohman and Tazdanfar, 2017). It is shown by:
Long Term Debt Ratio (LTDR) =
TotalAsset bt LongTermDe Whereby:
LTDR = Long Term Debt Ratio
∑ Long Term Debt = Total Long Term Debt ∑ Total Asset = Total Asset
3.3. Independent Variables
This section shall be discussing on the asset tangibility, growth opportunities, profitability and liquidity.
3.3.1. Asset Tangibility
Asset Tangibility is the total fixes asset divided by the total asset (Rajan and Zingales, 1995; Titman and Wessels, 1988; Friend and Lang, 1998; Wald, 1999; Pandey, 2001; Suto, 2003; Abor and Biekpe, 2009; Karadeniz et al., 2009; Su, 2010; Sheikh and Wang, 2011; Cekrezi, 2013; Chadha and Sharma, 2015; Alipour et al., 2015; Hussain et al., 2015; Ahsan et al., 2016; Ohman and Tazdanfar, 2017). It is given by:
Asset Tangibility (TANG) =
1 1
A FA
Whereby:
TANG = Asset Tangibility ∑ FA1= Total Fixed Asset
3.3.2. Growth Opportunities
Growth Opportunities is defined by annual percentage change of total asset (Titman and Wessels, 1988; Pandey, 2001; Pandey, 2004; Abor and Biekpe, 2009; Karadeniz et al., 2009; Eriotis et al., 2007; Ooi, 1999; Deesomsak et al., 2004; Chadha and Sharma, 2015; Alipour et al., 2015; Hussain et al., 2015; Ahsan et al., 2016; Ohman and Tazdanfar, 2017), it shown by:
Growth Opportunity (GROWTH) =
100
0 0 1
X TA
TA TA
Whereby:
GROWTH = Growth Opportunities ∑ TA1 = Total Asset for current year
∑ TA0 = Total Asset for previous year
3.3.3. Profitability
Profitability is the ratio of the earnings before interest and taxes (EBIT) to total assets (Myer, 1977; Friend and Lang, 1988; Titman and Wessels, 1988; Rajan and Zingales, 1995; Wald, 1999; Pandey, 2002; Suto, 2003; Su, 2010; Abor and Biekpe, 2009; Ezeoha, 2008; Sheikh and Wang, 2011; Cekrezi, 2013; Chadha and Sharma, 2015; Alipour et al., 2015; Hussain et al., 2015; Ahsan et al., 2016; Ohman and Tazdanfar, 2017). It is stated as:
Profitability (PROF) =
1 1EBIT A Whereby:
PROF = Profitability
EBIT1 = Earnings Before Interest and Taxes,
∑A1 = Total Asset
3.3.4. Liquidity
Liquidity is the ratio of current assets to current liabilities will be used in this study (Deesomsak et al., 2004; Al-ajmi et al., 2009; Eldomiaty and Azim, 2008; Eldomiaty, 2007; Sheikh and Wang, 2011; Cekrezi, 2013; Chadha and Sharma, 2015; Alipour et al., 2015; Hussain et al., 2015; Ahsan et al., 2016; Ohman and Tazdanfar, 2017). It is stated as:
Liquidity (LIQ) =
CL CA Whereby:
LIQ = Liquidity
∑ CA = Total Current Assets ∑ CL = Total Current Liabilities
3.4. Regression Model
The regression model (panel data analysis) for this study has shown as below.
Leverage = α + β1 TANG + β2 GROWTH + β3 PROF + β4 LIQ+ β5 SIZE + µ
Whereby:
α = Intersect
TANG = Asset Tangibility
GROWTH = Growth Opportunities PROF = Profitability
LIQ = Liquidity SIZE = Firm Size µ = Error Term
Due to the merits of concerning time-series analyses and cross-section factor, panel data analysis will be used to estimate the above model. There are three possible variations of panel data analysis which are ordinary least square (OLS), the fixed effects model and the random effects model in the panel data analysis. After the Hausmans test, the fixed effects model is found to be the most appropriate model to be used in this study.
4. RESULTS AND DISCUSSION
The following part shall be discussing about the results and discussions for this research study.
4.1. Descriptive Statistics
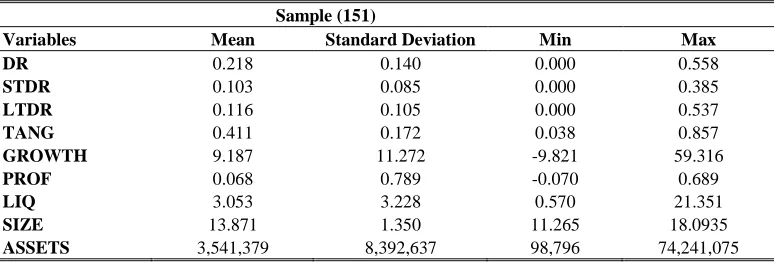
Table 3 represents the descriptive statistics for surviving companies in Malaysia for year 2000 until 2015 for 16 years continuously. The computed results comprise of minimum, maximum, mean and standard deviation of the variables such as debt ratio (DR), short term debt ratio (STDR), long term debt ratio (LTDR), asset tangibility (TANG), growth opportunities (GROWTH), profitability (PROF), liquidity (LIQ), control variable as firm size (SIZE) and ASSETS (total assets) (’000) for full samples of surviving listed companies in Malaysia.
Table 3: Descriptive Statistics for Surviving Listed Companies in Malaysia for year 2000 until 2015
Sample (151)
Variables Mean Standard Deviation Min Max
DR 0.218 0.140 0.000 0.558
STDR 0.103 0.085 0.000 0.385
LTDR 0.116 0.105 0.000 0.537
TANG 0.411 0.172 0.038 0.857
GROWTH 9.187 11.272 -9.821 59.316
PROF 0.068 0.789 -0.070 0.689
LIQ 3.053 3.228 0.570 21.351
SIZE 13.871 1.350 11.265 18.0935
ASSETS 3,541,379 8,392,637 98,796 74,241,075
The descriptive statistics present an average mean value of short term debt, long term debt and debt ratio for surviving companies are 10.3 percent, 11.6 percent and 21.8 percent respectively. Furthermore, maximum total short term debt, long term debt and debt ratio value are 38.5 percent, 53.7 percent and 55.8 percent respectively. While, an average mean value of total assets for all surviving companies amounts to RM3,541.38 million. On the other hand, mean and standard deviation value for asset tangibility for samples are 41.1 percent and 0.172, indicating that on average all company’s fixed assets are 41.1 percent of total assets which have been utilized in their companies. Indeed, the average growth opportunities of surviving companies during the observation period are 9.187 percent and standard deviation is 11.272 respectively. In addition, surviving companies are only able to make average profit of 6.8 percent from their total assets inconsistent with Hussain et al. (2015) research findings that most of the Malaysian food producer companies generated 8 percent profit as well. Overall, the average liquidity shows that surviving companies’ current assets are 3 times (mean value is 3.053) more than it current liabilities and can be considered healthy and able to pay off their current liabilities. The higher the current ratio is the higher the margin of safety.
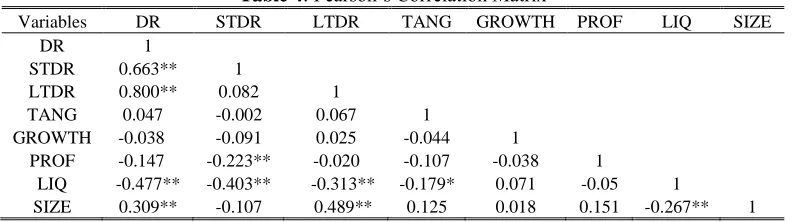
According to correlations between study variables as depicted in Table 4, liquidity (r=-0.477, p<0.01) and firm size (r=0.309, p<0.01) have negative and positive relation to debt ratio respectively. In addition, profitability (r=-0.223, p<0.01) and liquidity (r=-0.403, p<0.01) correlate with short term debt ratio in negative manner. Meanwhile, liquidity (r=-0.313, p<0.01) and firm size (r=0.489, p<0.01) are negative and positive relation to long term debt ratio respectively.
Table 4: Pearson’s Correlation Matrix
Variables DR STDR LTDR TANG GROWTH PROF LIQ SIZE
DR 1
STDR 0.663** 1
LTDR 0.800** 0.082 1
TANG 0.047 -0.002 0.067 1
GROWTH -0.038 -0.091 0.025 -0.044 1
PROF -0.147 -0.223** -0.020 -0.107 -0.038 1
LIQ -0.477** -0.403** -0.313** -0.179* 0.071 -0.05 1
SIZE 0.309** -0.107 0.489** 0.125 0.018 0.151 -0.267** 1
** Correlation is significant at the 0.01 level (2-tailed). * Correlation is significant at the 0.05 level (2-tailed).
Note: Debt ratio (DR), short term debt ratio (STDR), long term debt ratio (LTDR), asset tangibility (TANG), growth opportunities (GROWTH), profitability (PROF), liquidity (LIQ) and control variable as firm size (SIZE)
4.2. The Multiple Regression Model
Table 5: Regression results of the model
Variables Short Term Debt Long Term Debt Debt Ratio
Intercept 0.052
(1.042)
-0.727 (-13.035)***
-0.700 (-10.399)***
TANG 0.016
(1.322)
0.125 (9.179)***
0.145 (8.793)***
GROWTH -0.00006
(-1.586)
0.0002 (4.343)***
0.0001 (2.447)**
PROF -0.210
(-8.925)***
-0.022 (-0.849)
-0.231 (-7.274)***
LIQ -0.006
(-12.506)***
0.0005 (0.853)
-0.006 (-8.497)***
SIZE 0.006
(1.611)
0.057 (14.512)***
0.064 (13.563)***
Observation 2416 2416 2416
R² 0.601 0.647 0.692
Adj R² 0.574 0.623 0.671
F-stat (p-value) 21.518 (0.000) 26.750 (0.000) 32.759 (0.000) Hausman Test 18.447 (0.000)*** 25.127 (0.000)*** 43.695 (0.000)***
***significant at 0.01 level. **significant at 0.05 level. *significant at 0.10 level
Note: Debt ratio (DR), short term debt ratio (STDR), long term debt ratio (LTDR), asset tangibility (TANG), growth opportunities (GROWTH), profitability (PROF), liquidity (LIQ) and control variable as firm size (SIZE). Value in the parentheses ( ) is the t statistic value.
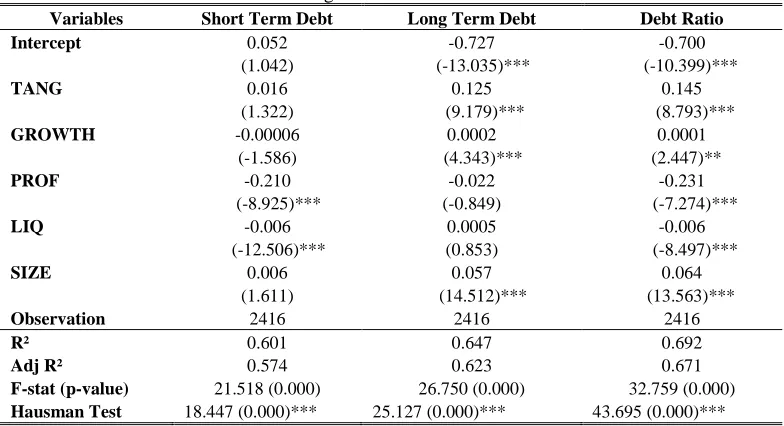
Table 5 exhibits that all the capital structure determinants as proxied by asset tangibility (TANG), growth opportunities (GROWTH), profitability (PROF), liquidity (LIQ), and firm size (SIZE) are negative and positive significant to debt ratio at 1 percent and 5 percent level respectively. Asset tangibility is significant positively related to long term debt ratio and debt ratio, but insignificant positively related to short term debt ratio. Therefore, this study supports H1b and H1c but not support H1a. These findings are consistent with Cekrezi (2013) and Ahsan et al. (2016) indicating that firms does not finance their fixed assets with short term debt but by using long term debt and support the trade-off theory. Therefore, it is important for their longevity in their business operation to survive in the market.
2013; Alipour et al.,2015; Hussain et al., 2015; Ohman and Yazdanfar, 2017). Thus, they support H3a and H3c.
Again, liquidity is found to be significant negatively related to short term debt ratio and debt ratio respectively at 1 percent significant level. These results are consistent with Al-Ajmi et al.(2009), Hussain et al. (2015) and Ahsan et al. (2016) and support H4a and H4c. Therefore, it proves that to sustain the business operation in the market, corporations generally prefer internal funds first as the main source of finance and thus, firms with enough liquid assets can utilize these funds to finance business activities and expecting to have lower leverage. In addition, the firm size is found to be positively significant association with long term debt ratio and debt ratio at 1 percent level. but positively insignificant with short term debt ratio. The larger organizations may issue debt at lower costs and can approach easily to the capital market compared to smaller organizations (Rajan and Zingales, 1995). Besides, Ahsan et al. (2016) in their study had discovered that firm size is significant positively linked with long term debt and debt ratio which matched with the trade-off theory.
5. CONCLUSION
This main purpose of this paper is to examine the impact of assets tangibility, growth opportunities, profitability and liquidity on financial leverage as proxies by short term debt ratio, long term debt ratio and total debt ratio. Moreover, the uniqueness of this study is by taking the 151 surviving public listed companies in Malaysia from year 2000 to 2015 (16 years) to be as a sample of the study. The findings of this research study conclude all the capital structure determinants are significant positive and negative to debt ratio. Asset tangibility, growth opportunities and firm size are significantly positive related to long term debt ratio whereby the rest are insignificant. Overall, asset tangibility and growth opportunities are positively significant to the debt ratio, while profitability and liquidity are negatively significant to the debt ratio. Based on these empirical findings, surviving companies prefer to use internal sources as their main priority for financial leverage decisions to sustain the business operation. Furthermore, the results reveal that surviving companies have enough liquid assets and can utilize these funds to finance business activities and expecting to have lower leverage (Al-Ajmi et al., 2009). As a result, surviving companies tend to manage their leverage wisely for the survival and longevity of the business operation in long run.
REFERENCES
Abor, J., & Biekpe, N. (2009). How do we explain the capital structure of SMEs in sub-Saharan Africa? Evidence from Ghana. Journal of Economic Studies, 36(1), 83-97.
Ahsan T., Wang M., & Qureshi M. A. (2016). Firm, industry, and country level determinants of capital structure: Evidence from Pakistan. South Asian Journal of Global Business Research, 5(3), 362 – 384.
Alipour, M., Mohammadi, M. F. S., & Derakhshan, H. (2015). Determinants of capital structure: An empirical study of firms in Iran.International Journal of Law and Management, 57(1), 53-83.
Amidu, M. (2007). Determinants of capital structure of banks in Ghana: An empirical approach. Baltic Journal of Management, 2(1), 67-79.
Baral, K. J. (2004). Determinants of capital structure: A case study of listed companies of Nepal. Journal of Nepalese Business Studies, 1(1), 1-13.
Booth, L., Aivazian, V., Demirguc-Kunt, A., & Maksimovic, V. (2001). Capital structures in developing countries. Journal of Finance, 39, 857-878.
Cekrezi, A. (2013). Analyzing the impact of firm’s specific factors and macroeconomic factors on capital structure: A case of small non-listed firms in Albania. Research Journal of Finance and Accounting, 4(8), 90-95.
Chadha, S., & Sharma, A. K. (2015). Determinants of capital structure: An empirical evaluation from India. Journal of Advances in Management Research, 12(1), 3-14.
Deesomsak, R., Paudyal, K., & Pescetto, G. (2004). The determinants of the capital structure: Evidence from the Asia Pacific region. Journal of Multinational Financial Management, 14, 387-405.
Eldomiaty, T. (2007). Determinants of corporate capital structure: Evidence from an emerging economy. International Journal of Commerce and Management, 17(1/2), 25-43. Eldomiaty, T., & Azim, M. H. (2008). The dynamics of capital structure and heterogeneous
systematic risk classes in Egypt. International Journal of Emerging Markets, 3(1), 7-37. Eriotis, N., Vasiliou, D., & Ventoura-Neokosmidi, Z. (2007). How firm characteristics affect
capital structure: An empirical study. Managerial Finance, 33(5), 321-331.
Ezeoha, A. E. (2008). Firm size and corporate financial-leverage choice in a developing economy evidence from Nigeria. The Journal of Risk Finance, 9(4), 351-364.
Friend, I., & Lang, L. H. P. (1988). An empirical test of the impact of managerial self-interest on corporate capital structure. Journal of Finance, 43, 217-281.
Gorriz, C. G., & Fumas V. S. (2005). Family ownership and performance: The net effect of productive efficiency and growth constraints. Finance Working Paper N, 66/2005, University of Zaragoza.
Hall, G. C., Hutchinson, P. J., & Michaelas, N. (2004). Determinants of capital structures of European SMEs. Journal of Business Finance and Accounting, 31(5/6), 711-728. Harris, M., & Raviv, A. (1991). The theory of capital structure. Journal of Finance, 46, 297-355. Hussain, S. S., Hamza, S., & Miras, H. (2015). The determinants of capital structure for Malaysian
food producing companies. International Journal of Accounting, Business and Management, 1(1), 2289-4519.
Jensen, M. C. (1986). Agency costs of free cash flow, corporate finance and takeovers. American Economic Review, 76, 323-329.
Jensen, M. C., & Meckling, W. H. (1976). Theory of the firm: Managerial behaviour, agency costs and ownership structure. Journal of Financial and Quantitative Analysis, 27, 247-263. Karadeniz, E., Kandir, S. Y., Balcilar, M., & Onal, Y. B. (2009). Determinants of capital structure:
evidence from Turkish lodging companies. International Journal of Contemporary Hospitality Management, 21(5), 594-609.
Li, K., Yue, H., & Zhao, L. (2009). Ownership, institutions, and capital structure: Evidence from China. Journal of Comparative Economics, 37(2), 471-490.
Mahmood, W. M. W., Affandi, S., Baharuddin, N.S., Mohamad, Z., & Shamsudin, N. (2011). Capital structure of property companies in Malaysia. International Research Journal of Finance and Economics, 74, 198-206
Mahmood, W. M. W., & Zakaria, R. (2007). Profitability and capital structure of the property and construction sectors in Malaysia. Pacific Rim Property Research Journal, 13(1), 92-105. Mat Nor, F., & Yatim, C. P. (2000). Determinants of corporate debt ownership in Malaysia. Asian
Academy of Management Journal, 5, 15-26.
Mat Kila, S., & Mahmood, W. M. W. (2008). Capital structure and firm characteristics: Some evidence from Malaysian companies 23, MPRA Paper No. 14616, posted 13. April 2009 05:01 UTC.
Myers, S. C. (1977). Determinants of corporate borrowing. Journal of Financial Economics, 5, 147-175.
Myers, S. C. (1984a). The capital structure puzzle. Journal of Finance, 39, 575-592. Myers, S. C. (1984b). Capital structure. Journal of Economic Perspectives, 15, 81-102.
Myers, S. C., and Majluf, N.S. (1984). Corporate financing and investment decisions when firms have information investors do not have. Journal of Financial Economics, 13, 187-221. Myers, S. C. (2001). Capital structure. Journal of Economic Perspective, 15(2), 81-102.
Ohman P., & Yazdanfar, D. (2017). Short- and long-term debt determinants in Swedish SMEs. Review of Accounting and Finance, 16(1), 106-124.
Ooi, J. (1999). The determinants of capital structure: Evidence on UK property companies. Journal of Property Investment and Finance, 17(5), 464-480.
Pandey, I. M. (2001). Capital structure and the firm characteristics: Evidence from an emerging market. Indian Institute of Management Ahmedabad Working Paper No. 2001-10-04. Pandey, I. M. (2004). Capital structure, profitability and market structure. Evidence from Malaysia,
Asia Pacific Journal of Economics and Business, 8, 78-91.
Pratomo, W. A., & Ismail, A. G. (2006). Islamic bank performance and capital structure, Proceedings of The Malaysian Finance Association’s 8th Annual Conference, 8-9 May 2006, Universiti of Malaysia Sabah.
Quan, V. (2002). A rational justification of the pecking order hypothesis to the choice of sources of financing. Management Research News, 25, 74-90.
Rajan, R. G., & Zingales, L. (1995). What do we know about capital structure? Some evidence from international data. Journal of Finance, 50, 1421-1460.
San, O. T., & Heng, T. B. (2011). Capital structure and corporate performance of Malaysian construction sector. International Journal of Humanities and Social Science, 1(2), 28-36. Sheikh, N.A., & Wang, Z. (2011). Determinants of capital structure an empirical study of firms in
manufacturing industry of Pakistan. Managerial Finance, 37(2), 117-133.
Song, H. S. (2005). Capital structure determinants - An empirical study of Swedish companies, Working Paper The Royal Institute of Technology, Stockholm.
Sogorb-Mira, F., & How, S. M. E. (2005). Uniqueness affects capital structure: Evidence from a 1994-1998 Spanish data panel. Small Business Economics, 25(5), 447-457.
Su, L. D. (2010). Ownership structure, corporate diversification and capital structure: Evidence from China’s publicly listed firms. Management Decision, 48(2), 314-339.
Suto, M. (2003). Capital structure and investment behaviour of Malaysian firms in the 1990s: A study of corporate governance before the crisis, corporate governance. An International Review, 11(1), 25-39.
Titman, S., & Wessels, R. (1988). The determinants of capital structure choice. Journal of Finance, 43, 1-19.
Vergas, N., Cerqueira, A., & Brandao E. (2015). The determinants of the capital structure of listed on stock market nonfinancial firms: Evidence for Portugal, Working Paper, FEP-UP, School of Economics and Management, University of Porto, 555, 1-32.
Viviani, J. (2008). Capital structure determinants: An empirical study of French companies in the wine industry. International Journal of Wine Business Research, 20(2), 171-194. Wald, J. K. (1999). How firm characteristics affect capital structure: An international comparison.
Journal of Financial Research, 22, 161-187.
Weller, C. (1998). Global Banking. Foreign Policy, 3(9), 1-3.
Williamson, O. E. (1988). Corporate finance and corporate governance. Journal of Finance, 43 (3), 567-591.
Wiwattanakantang, Y. (1999). An empirical study on the determinants of the capital structure of Thai firms. Pacific-Basin Finance Journal, Elsevier, 7(3-4), 371-403.
APPENDICES
Surviving Listed Companies in Malaysia and Performances: Regression Results for All Competing Models
Appendix A: Estimated Models for Surviving Companies by Using Short Term Debt
Variables Full Sample
Pooled OLS Fixed Effect Random Effect Panel A: Estimated Coefficients
Intercept 0.282 (13.000)*** 0.052 (1.042) 0.138 (3.485)*** Tangibility -0.023 (-2.288)** 0.016 (1.322) 0.007 (0.613) Growth -0.00007 (-1.431) -0.00006 (-1.586) -0.00005 (-1.394) Profitability -0.228(-10.939)*** -0.210 (-8.925)*** -0.215 (-9.563)*** Liquidity -0.009(-19.267)*** -0.006(-12.506)*** -0.007(-13.611)*** Size -0.009 (-5.898)*** 0.006 (1.611) -0.0002 (-0.064) Panel B: Model Criteria
𝑅2 0.177 0.601 0.114
Adj. 𝑅2 0.175 0.574 0.112
F-stat (p-value) 103.724 (0.000) 21.518 (0.000) 62.078 (0.000)
Observation 2416 2416 2416
Variables Full Sample
Pooled OLS Fixed Effect Random Effect Panel C: Hausman Test for Fixed and Random Effect
Hausman Test 18.447 (0.000)***
Note: The Hausman test is used for fixed and random effect to determine the significance of the model. ***significant at 0.01 level. ** significant at 0.05 level. *significant at 0.10 level.
Appendix B: Estimated Models for Surviving Companies by Using Long Term Debt
Variables Full Sample
Pooled OLS Fixed Effect Random Effect Panel A: Estimated Coefficients
Intercept -0.411(-16.061)*** -0.727(-13.035)*** -0.618(-13.509)*** Tangibility 0.029 (2.484)** 0.125 (9.179)*** 0.108 (8.383)*** Growth 0.0002 (3.659)*** 0.0002 (4.343)*** 0.0002 (4.686)*** Profitability -0.091 (-3.683)*** -0.022 (-0.849) -0.034 (-1.351) Liquidity -0.003 (-5.195)*** 0.0005 (0.853) 0.0002 (0.353) Size 0.038 (21.144)*** 0.057 (14.512)*** 0.050 (15.616)*** Panel B: Model Criteria
𝑅2 0.194 0.647 0.122
Adj. 𝑅2 0.192 0.623 0.121
F-stat (p-value) 116.110 (0.000) 26.750 (0.000) 67.282 (0.000)
Observation 2416 2416 2416
Cross section 151 151 151
Panel C: Hausman Test for Fixed and Random Effect
Hausman Test 25.127 (0.000)***
Note: The Hausman test is used for fixed and random effect to determine the significance of the model. ***significant at 0.01 level. ** significant at 0.05 level. *significant at 0.10 level.
Appendix C: Estimated Models for Surviving Companies by Using Debt Ratio
Variables Full Sample
Pooled OLS Fixed Effect Random Effect Panel A: Estimated Coefficients
Intercept -0.140 (-4.266)*** -0.700(-10.399)*** -0.529 (-9.319)*** Tangibility 0.006 (0.418) 0.145 (8.793)*** 0.122 (7.783)*** Growth -0.0001 (1.923)* 0.0001(2.447)** 0.0001(2.833)*** Profitability -0.317(-10.077)*** -0.231 (-7.274)*** -0.245 (-7.991)*** Liquidity -0.012(-16.716)*** -0.006 (-8.497)*** -0.006 (-9.413)*** Size 0.030 (12.935)*** 0.064 (13.563)*** 0.053 (13.378)*** Panel B: Model Criteria
𝑅2 0.211 0.692 0.155
Adj. 𝑅2 0.209 0.671 0.153
F-stat (p-value) 128.529 (0.000) 32.759 (0.000) 88.078 (0.000)
Observation 2416 2416 2416
Panel C: Hausman Test for Fixed and Random Effect
Hausman Test 43.695 (0.000)***