(Received 31 August 2010/Accepted 11 January 2011)
We report a detailed correlation technique to identify the long-range temperature fluctuation in the Large Helical Device. Correlation hunting has successfully realized the observation of electron temperature fluctuations, which are characterized by their correlation length comparable to the plasma minor radius, with low frequency of
∼1-3 kHz, ballistic radial propagation (at a speed of∼1 km/s, of the order of diamagnetic drift velocity), spatial mode number ofm/n=1/1 (or 2/1), and amplitude of∼2% at the maximum. Bicoherence analysis confirmed their nonlinear coupling with local microscopic turbulent fluctuations. This long-range temperature fluctuation is a possible carrier of fast propagation in transport processes observed so far. We also comment on the theoretical interpretation.
c
2011 The Japan Society of Plasma Science and Nuclear Fusion Research
Keywords: electron temperature fluctuation, correlation length, transient transport, toroidal plasma, modula-tional coupling
DOI: 10.1585/pfr.6.1402017
1. Introduction
In magnetized toroidal plasmas, it is presumed that lo-cal turbulence caused by a lolo-cal microinstability (e.g. drift instability) drives local transport [1]. In future experiments on thermonuclear fusion, such as the Internal Thermonu-clear Experimental Reactor (ITER), the performance and controllability of plasmas are predicted and designed based on the basis of such a presumption. However, the fast ra-dial propagation of temperature perturbations in toroidal plasmas, i.e., the so-called “transient transport problem”, has been observed in many tokamaks and helical devices during the course of the last two decades [2–7]. The tem-perature perturbation, which is applied to the plasma edge region, propagates inward at a speed that is 10-50 times faster than that expected from diffusive transport mod-els. Fast propagation phenomena have been observed in both L- and H-mode plasmas and plasmas without mag-netohydrodynamic (MHD) activities. Thus, the “transient transport problem” is not restricted to a particular state of plasma and is a generic characteristic of plasmas. In plasma physics, this problem is an academic challenge for the comprehensive understanding of turbulence-driven transport. In nuclear fusion research, a fast transport re-sponse has a significant impact on the plasma control al-author’s e-mail: [email protected]
gorithm in order to maintain stationary burning under the control of heat flux to the divertor. In spite of its impor-tance, this problem has considerably confused the scien-tists.
Global fluctuation with long distance correlation is a possible candidate to explain the fast propagation phe-nomena. Avalanche phenomena and nonlinear excitation by the random noise of microturbulence through a statis-tical process may generate the global fluctuations [8–12]. Mathematically, fractional kinetics has been formulated as a tool to analyze this [13]. Zonal flows are one of the mesoscale fluctuations [14, 15]. Methods for searching mesoscale fluctuations and turbulence anatomy are well developed experimentally [16, 17]. The searching method for macroscale fluctuations, which covers the entire area of plasma, is urgently needed. These theoretical as well as experimental advancements can now be applied to the research of global fluctuations. The measurement of elec-tron cycloelec-tron emissions (ECE) has been developed and used for observations of global dynamics at the onset of a sawtooth crash and of neoclassical tearing modes [18–22]. A few reports have been suggested the existence of low-frequency temperature fluctuations [23–25]; however, the details of these fluctuations, such as their spatiotemporal structure, have not been clarified yet.
c
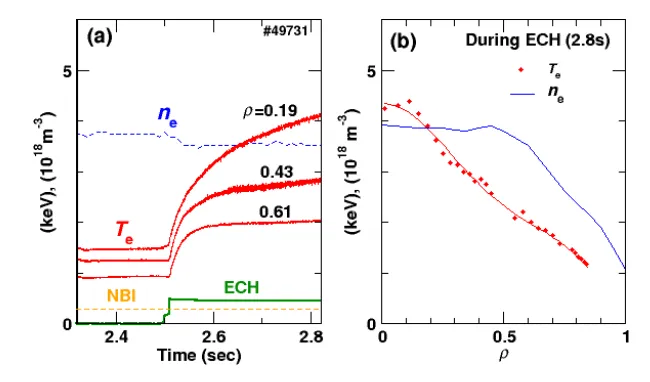
Fig. 1 (a) Typical time evolution ofTeat three different radii and the line averaged density. (b) Radial profiles ofTeandneat 2.8 s.
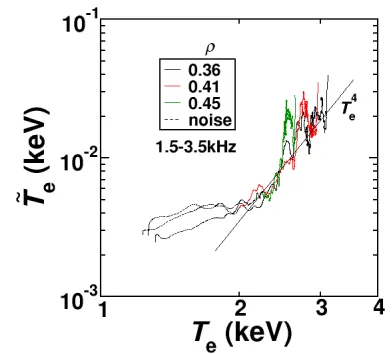
Recently, macroscale low-frequency temperature fluc-tuations were discovered in the Large Helical Device (LHD) [7] by using global correlation measurements be-tween fluctuations or their envelope obtained from a mul-tichannel ECE system, a microwave reflectometer and a magnetic probe array arranged over the entire range of the torus [26]. We report the details of observations and cor-relation technique. Global fluctuations have the follow-ing features: The radial correlation length of the observed fluctuations is comparable to the plasma minor radius and the mode number ism/n =1/1 or 2/1, wherem(n) is the poloidal or toroidal mode number. The fluctuation propa-gates radially with a phase velocity of 1 km/s, which is of the order of the diamagnetic drift velocity. The amplitude of the fluctuation reaches approximately 1% of the aver-aged temperature atρ=0.4, whereρis the normalized av-erage radius. The amplitude has a strong electron tempera-ture,Te, dependence,Te4, in the higher temperature region
(Te >2 keV). Bi-spectrum analysis indicates a non-linear
modulational coupling between the global fluctuations and the microscopic fluctuations.
Global fluctuations with long distance correlation have a significant impact on transport phenomena. This discovery verifies that the change in the transport is caused not only by the change in the local plasma parameters but also by the fast propagation of the global fluctuations with long radial correlation. This is the first observation on global fluctuation that plays an important role in the tran-sient transport phenomena.
2. Experimental Setup
2.1
Target plasma
The experiments were carried out on the LHD, which has a major radius R of 3.5 m, an averaged minor ra-dius of 0.6 m, and a magnetic field strengthBaxof 2.83 T
on the axis. The temporal evolution of the typical dis-charge presented here is shown in Fig. 1 (a). The target
L-mode plasma was produced with a neutral beam injec-tion of 2 MW, then an electron cyclotron resonant heating (ECRH) of 1 MW was superimposed on the plasma cen-ter att = 2.5 s. During the discharges, the line-averaged density was almost constant at ¯ne = 4 ×10¹⁸m−3, and
the central electron temperature,Te(0), was found to
in-crease from 1.5 to 4 keV after the superposition of ECRH. Figure 1 (b) shows the temperature and density profiles at t=2.8 s, measured with a 28-channel ECE radiometer and a 13-channel far-infrared interferometer [7, 27, 28], respec-tively.
In the ECRH phase, the volume-averaged β was 0.1% and the electron collision frequency normalized by the bounce frequency of helical ripple-trapped orbit was
∼0.03. The plasma had neither MHD activity nor power modulation and was without a transport barrier. The heat diffusivity estimated from the power balance equation at t=2.8 s is∼3 m2/s at half ofρ.
2.2
Diagnostics for fluctuations
Global correlation analysis was applied during the quiet period fromt = 2.7 to 2.8 s by using an ECE ra-diometer that provide the radiation temperature (Trad), with
supporting fluctuation measurements obtained using an X-mode reflectometer [29] and magnetic field pick-up coils [30]. The locations of these diagnostics are denoted in Fig. 2. The fluctuations in radiation temperature,Trad, were
measured by the ECE radiometer. A possible difference betweenTrad andTeis discussed later. Spatial resolution
direc-Fig. 2 Contour plot of the magnetic flux surfaces on the equa-torial midplane of LHD. Measurement locations of mag-netic probes used in this analysis are indicated by filled squares. The reflectometer antenna and the ECE antenna are located 72◦apart from each other in a toroidal direc-tion.
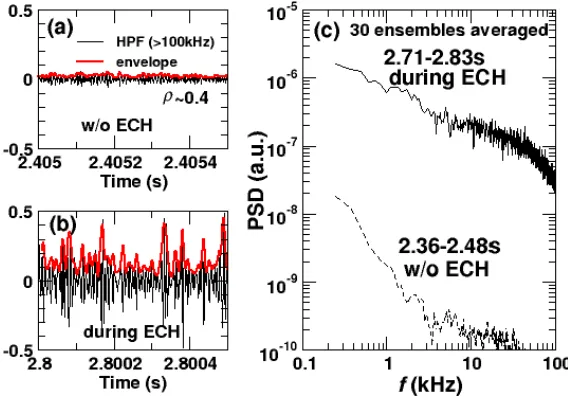
Fig. 4 Typical time evolution of high-pass filtered (≥100 kHz) reflectometer signal (black line) and its envelope (red line) (a) before and (b) during the ECH phase. (c) Power spectrum density of the envelope of the reflectometer signal in both cases. The time window for FFT is 8 ms and 30 ensembles are averaged.
Fig. 3 Fourier spectrum of ˜Trad atρ = 0.4 before and during
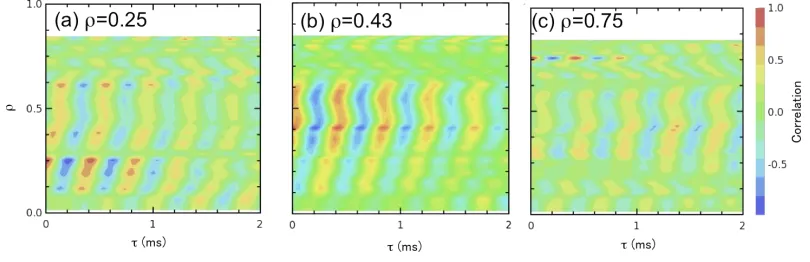
Fig. 5 Contour plot of the cross-correlation function of the low-frequency component (1.5-3.5 kHz) of ˜Tradfrom 28 ECE channels with
that of the reference channel atρ=0.43. (b) Radial profile of the amplitude of ˜Trad/Tradin the three characteristic frequency bands.
Fig. 6 Contour plots of the cross-correlation function calculated from three different reference channels.
during the ECH phase. The Fourier spectrum ofInshowed
broad peaks around 2 kHz with a full width of the half max-imum of∼1 kHz during the ECH phase (Fig. 4 (c)). There were no qualitative differences in the spectrum ofIn, even
if the cut-offfrequency of the high-pass-filter was changed to 50 kHz.
3. Correlation Hunting and Discovery
of Long-Range Fluctuation
3.1
Spatiotemporal
structure
of
radia-tion temperature and long distance
correlation
The spatiotemporal structure of the Trad fluctuations
was determined by a two-point two-time correlation of ˜Trad
in the range of 1.5-3.5 kHz (a band-pass filter was applied) at different radii. The correlation function between the ECE signals at two different points in space and time is defined as
c(ρ, ρref, τ)=
f(ρ,t)f(ρref,t+τ)
f2(ρ,t)f2(ρ ref,t)
,
whereτis the time lag, f(ρ,t) is the time series of the ECE channel located atρand indicates the temporal averag-ing defined ash(t) = 1
T T
0
h(t)dt. Figure 5 (a) shows
a contour plot of the correlations of ˜Trad(which was
band-passed in the frequency range of 1.5-3.5 kHz) from 28 ECE channels with that of the reference channel atρref =0.43.
The fluctuations have a long radial correlation, which ex-tends from the core to edge region. The radial wavelength was of the order of the plasma radius. The wave prop-agated from the core to the edge. The propagation was ballistic and not diffusive. The radial phase velocity was extremely fast aroundρ∼0.5 and∼1 km/s on radial aver-age, which is of the order of the diamagnetic drift velocity. The poloidal rotation should be included in the estimation of the radial phase velocity more precisely. The radial pro-file of the ˜Trad amplitude is shown in Fig. 5 (b), and ˜Trad
exceeds 20 eV atρ ∼ 0.4. There was no qualitative dif-ference in the correlation functions even if the redif-ference channel was changed fromρ =0.25 to 0.75, as shown in Fig. 6.
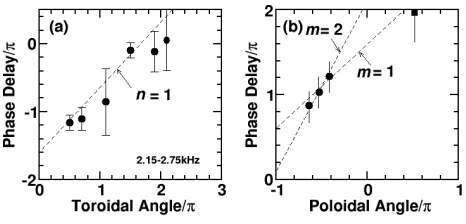
rel-Fig. 7 Cross-phase between ˜Tradatρ=0.4 and the toroidal
mag-netic probe array (a) and poloidal array (b).
evant frequency range (˜b/Bax < 10−6) at the probe
posi-tion. However, the ECE signals had unambiguous cross-correlation with the magnetic probe signals at f = 2.5 and 3.5 kHz. On the basis of this fact, we can conclude that a radially extended global fluctuation accompanies a weak but finite magnetic fluctuation. The toroidal and poloidal mode numbers of ˜Tradwere estimated by a
cross-correlation between the signals from the ECE channel and the magnetic probes. The cross-phase between a 6-channel toroidal array of magnetic probes and an ECE channel (at
ρ= 0.4) in the frequency range of∼2.5 kHz showed that the toroidal mode number isn =1, as shown in Fig. 7 (a). If the reference radius of the ECE signal is changed from
ρ=0.4 to other value, the phase difference moves by the amount of the phase difference between the two ECE chan-nels. The conclusion ofn =1 was confirmed by this ex-amination. The cross-phase using the 4-channel poloidal array indicated that the mode propagates in the ion diamag-netic direction and the poloidal mode number ism =1-2 (Fig. 7 (b)). If the fluctuation structure withm/n=1/1 or 2/1 has a radial wave number,kr, comparable with toroidal
and poloidal wave numbers, the radial propagation ity is approximately equal to the diamagnetic drift veloc-ity [33]. A possibilveloc-ity of the long-range fluctuation is dis-cussed later.
3.2
Categorization of low-frequency
compo-nents
Within the present signal-to-noise ratio of the Trad
measurements, the Fourier spectrum of ˜Tradin Fig. 3
sug-gests the existence of three components of long-range fluc-tuations. These three components have a strong correla-tion with In in the wide radial region, as discussed later
in Sec. 3.4 (Fig. 10). ˜Trad was categorized into three
fre-quency bands (f <1 kHz, f ∼2 kHz and f ∼3 kHz). The two-point two-time correlations of ˜Trad were calculated
for these three bands and the results are shown in Fig. 8. Here, ˜Tradwas band-passed in the frequency range of
0.5-1.0 kHz, 2.1-2.6 kHz and 3.0-3.5 kHz and the reference channels wereρref=0.31, 0.43 and 0.43, respectively. The
origin of propagation of the mode with f <1 kHz was lo-cated atρ∼ 0.4. As shown in Fig. 6, there was no quali-tative difference in propagation features, even if the refer-ence channel was changed. The sub-kHz mode may have qualitatively different features than those of the modes with f >2 kHz. Details of the sub-kHz mode will be the object of future work; we focus on the fluctuations in the range of 2 kHz or higher. In Figs. 8 (b) and (c), patterns generated by standing waves appear in the region ofρ ≈ 0.6-0.75; thus a reflection near the plasma boundary (ρ∼1) was sug-gested. The phase velocity of backward waves (inwardly propagating waves) was several times lower than the out-ward velocity. The difference in the propagation pattern at the edge could be due to the interference with the density fluctuation, which is discussed later. This issue will be a topic for our future work.
3.3
Dependence of
T
radfluctuation
ampli-tude on
T
eIn theTerise phase (Fig. 1 (a)), the amplitude of the
˜
Trad variation depends on the value ofTe. The timescale
of theTerise is∼100 ms much longer than that of the
rep-resentative frequency of ˜Trad, and theTerise is considered
to be quasi-static. The ˜Trad amplitudes at three different
radii are illustrated as a function ofTein Fig. 9. It displays
Fig. 9 Tedependence of the amplitude of ˜Trad. The amplitude is
averaged over a 10 ms interval.
ρ = 0.36, 0.41 and 0.45, where a moving average over 10 ms is applied. The amplitudes in the low temperature re-gion (Te<2 keV) were not distinguishable from the noise
level. In the high temperature region (Te>2 keV),
ampli-tudes of the signal exceeded the noise level and a strong Tedependence of Te4 appeared. Spontaneous and abrupt
jumps (with amplitudes as high as 40 eV) were observed. Details of these jumps need further research and will be discussed in a forthcoming article.
3.4
Correlation with modulation of the
en-velope of density fluctuation and
estima-tion of electrostatic potential fluctuaestima-tion
The envelope of density fluctuations in the high fre-quency band indicates the existence of a modulator of microscopic fluctuations, as shown in Fig. 4. A correla-tion between the modulator and the long-rangeTrad
fluc-tuations was observed. Figure 10 shows a contour plot of the squared cross-coherence between ˜In at ρ ≈ 0.
40-0.43 and ˜Trad of each ECE channel. Significant
cross-correlation was demonstrated in the frequency range of 0.2-5 kHz and in the wide radial region during the ECH phase (Fig. 10 (a)). On the other hand, there was no signif-icant correlation whenTewas low and ˜Tradwas not
distin-guishable from noise (Fig. 10 (b)). The existence of fluctu-ations with a long radial correlation length was verified by the correlation in Fig. 10 (a), which was established by two independent diagnostic methods.
The electrostatic potential, Δφ of the long-range fluctuation was estimated from the envelope In. The
study of disparate-scale interactions provided the estimate ˜
In(f)/In ∼ fmicrof−1krLn(eΔφ/Te), where In is the
mean of the envelope of microscopic fluctuations, fmicrois
the frequency of microscopic fluctuations,Lnis the scale
length of the density gradient and f and kr are the
fre-quency and radial wave numbers, respectively, of the
long-Fig. 10 Contour plot of the squared coherence between the enve-lope of the reflectometer signal and the 28-channel ECE signals in the space of frequency versus radial location of each ECE channel (a) during and (b) before ECH phase. Measurement location of reflectometer isρ≈0.40-0.43.
range perturbation [14] (experimental validation is given in Ref. [16]). The time evolution of the envelope of micro-scopic density fluctuations was observed in the frequency range of 1.5-3.5 kHz. The ratio ˜In/In ∼ 0.3 was
ob-tained. By substituting the observed values ˜In/In ∼ 0.3
andkrLn∼1 forfmicro∼100 kHz, an estimate ofeΔφ/Te∼
0.01 in the relevant frequency range of ∼2.5 kHz can be obtained. This fact suggests that the electrostatic potential fluctuation comparable to ˜Trad exists (eΔφ ∼ T˜rad). The
heavy ion beam probe (HIBP) in LHD (injected beam ion energy is 6 MV) cannot resolve the potential fluctuation of the order of 1-10 V till date [34]. This point must be exam-ined in the future experiment.
3.5
Nonlinear coupling with microscopic
fluctuations
No modulation was observed in the heating power around 2.5 kHz. The observed long-range fluctuations are not considered to be caused by external heating. To ver-ify the nonlinear excitation of the long-range fluctuation by strong microinstability, bicoherence analysis was ap-plied [35]. Careful consideration of statistical convergence is required in the bicoherence analysis. The statistical con-vergence was confirmed in this study.
Bicoherence of each ECE signal showed nonlinear coupling of the long-range ˜Trad fluctuations (1.5-3.5 kHz)
sig-andTe fluctuations for 2.6-2.8 s. The time window for
FFT is 8 ms and 360 ensembles are averaged. The three-channel ECE signals (ρ=0.4, 0.43, 0.45) are averaged to increase the number of ensembles.
nificant bicoherence between the 1.5-3.5 kHz components and the high-frequency components of ˜Trad due to
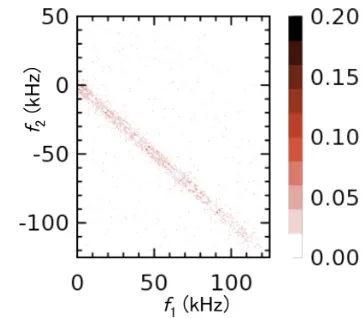
ex-tensive noise in the high-frequency region (≥ 10 kHz). Nonlinear interactions between these long-range and mi-croscopic fluctuations were identified by cross-bispectral analysis. Cross-bispectrumZ for three waves (1,2 and 3) is defined asZ = nˆ1nˆ2Tˆ3∗
, where denotes ensemble averaging and the frequency satisfies the matching condi-tion f1+f2 = f3, and ˆnand ˆT are the Fourier transforms of
the density andTradfluctuations, respectively. The
cross-bicoherencezis defined as
z2= Z
2
|nˆ1nˆ2|2 Tˆ3 2.
The cross-bicoherence is used to quantify the extent of the phase coupling between ˜ne and ˜Trad. In Fig. 11, the
sig-nificant cross-bicoherence is observed along a line in the form f1 + f2 ∼ ±2.5 kHz. This means that ˜Trad around
2.5 kHz couples nonlinearly with ˜ne(f1) and ˜ne(f2) where
f1 + f2 ∼ ±2.5 kHz is satisfied. This result is
consis-tent with the fact that the high-frequency components of ˜
ne are modulated in the frequency range of 1-3 kHz as
shown in Fig. 4 (c). The biphase under the condition of f1+f2= f3=2.5 kHz is scattered; however, it is distributed
around a single value; thus the existence of modulational coupling of microscopic fluctuations is suggested.
Because the observed long-range ˜Trad fluctuation is
considered to be linearly stable, the existence of nonlin-ear coupling with microscopic fluctuations suggests an en-ergy transfer from microscopic fluctuations to the large-scale fluctuation. The direction of the energy transfer be-tween microscopic fluctuations and the large-scale fluctu-ation has not been identified yet. However, observfluctu-ation of the Reynolds stress makes it possible to study the energy transfer process [36], which is the objective of future work.
a small portion (of the order of 10 ) of the heat diff usiv-ity estimated from a power balance equation in a stationary state.
4.2
Transient transport
However, for the transient transport, this fluctuation plays a dominant role in the fast response, because the change of the amplitude of this mode (i.e., the change of Deff) has a ballistic propagation of the order of 0.1 ms as shown in Fig. 5 (a). This value is 50-100 times faster than that expected from diffusive transport models. The change of the large-scale fluctuation will induce the change of Deff, which propagates across the plasma column within
0.1 ms [10]. This timescale could explain the abrupt change of the transport observed as non-local phenomena in the LHD [7, 37]. In Refs. [7, 37], a fast timescale for propagation of the order of 1 ms has been reported. The speed of propagation of the order of the diamagnetic drift velocity is sufficiently fast to explain the abrupt change of transport observed in many toroidal plasmas [2–7]. The large-scale ˜Trad fluctuation is one of the entities capable
of producing a rapid transient response. The relation to the improvement of confinement has been studied and dis-cussed in Ref. [26].
5. Discussion
5.1
Radiation temperature
TheTradandTeare related asTrad=(1−exp(−τ))Te,
whereτis the optical thickness andτ∝neTe. Hence, the
Tradfluctuations are affected by theTefluctuations, ˜Te, and
the density fluctuations, ˜ne, as ˜Trad/Trad =(1+C)/T˜eTe+
Cn˜e/ne, whereC =τ/(exp(τ)−1). In the present
experi-ment, the density fluctuation level was difficult to estimate; thus discussion is required for the precise estimation of theTefluctuation level. We can discuss the approximate
level of theTefluctuation by considering the optical
thick-ness. In this experiment,τ > 4 is satisfied in the plasma core [38]. If there is noTefluctuation, then the observed
value of ˜Trad/Trad ∼0.01 indicates that ˜ne/neexceeds 0.1.
re-gion. A working hypothesis that the dominant contribution to ˜Trad comes from ˜Te is allowed. The optical thickness
is sufficiently large (∼ 3) atρ ∼ 0.5. In the edge region (ρ∼0.8),τ∼1 holds in order for ˜Tradto be influenced by
the density fluctuations. Thus, there is a possibility that the difference of radial propagation between the core and edge regions (Fig. 5 (a)) stems from the optical thickness.
For the fluctuations propagating with the diamagnetic drift velocity, the temperature variation is significantly smaller than the density variation, i.e., ( ˜Te/Te)/(˜ne/ne) ∼
O(ω/k//vth), wherevthis the electron thermal velocity and
k//is the parallel wave number, in slab plasmas because of temperature relaxation through transit electrons. However, the variation can be O(1) in toroidal plasmas when the elec-trons are trapped [1]. In this experiment, the plasma was in the collisionless regime; thus the fluctuations were consid-ered to be accompanied by the temperature variations be-cause of the response of the trapped electrons. The influ-ence of the orbit width on the observed correlation length was negligible; therefore it was not essential. The orbit width of a helically trapped electron was∼3 cm and the trapped electrons moved radially ∼ Δ/a < 0.05 during a period of large-scale fluctuations (∼ 1/2.5 kHz), which was significantly less than the radial correlation length of
˜
Tradfluctuations (see Fig. 5 (a)). On the basis of this fact,
we can conclude that the long distance radial correlation was real and was not caused by the motion of trapped elec-trons.
5.2
Comparison with MHD mode
The magnetic fluctuation level, which accompanies the ˜Trad fluctuation, was compared with the fluctuation
level that was observed during the MHD activity with a similar mode structure. Large magnetic fluctuations (˜b/Bax ≈ 10−5-10−4 outside plasma boundary) have been
observed when interchange modes (m/n = 2/1) are ex-cited in high-β(β >2%-3%) LHD plasmas [30]. For such large-amplitude magnetic perturbations, the deformation of the magnetic flux surface is estimated to be∼3 cm in the core plasma [39]. Magnetic fluctuation, which was ob-served here, was 30 or more times less. The temperature variation, which was estimated using the observed mag-netic fluctuation amplitude and assuming a frozen-in con-dition, was less than 2.6 eV. This estimated value was sig-nificantly smaller than the observed variation (30 eV). The large-scale ˜Trad fluctuations were not caused by MHD
in-stability such as interchange modes. In addition, the radial propagation patterns (Figs. 5 (a) and 8) are not explained by the interchange modes.
5.3
Comparison with theory
A theoretical study on low-frequency temperature fluctuations has not been accomplished; yet it is compared to the recent studies of microscale and mesoscale fluctu-ations [14]. However, the possibility of non-linear
excita-tion has been suggested and its importance is widely rec-ognized.
Pumping of linearly stable modes and quasimodes in the low-n drift wave frequency range by unstable micro-scopic fluctuations is a possible excitation mechanism of fluctuation with ann =1 mode structure [10]. One of the candidates for this low-frequency fluctuation is a linearly stable dissipative trapped-ion mode (DTIM) [40]. The re-lation ωhb,i > |k//vth,i| > ωb,i > ω ≥ νheff,i > νeff,i
was satisfied for the fluctuation of interest, wherevth,iand νi are ion thermal speed and collision frequency,
respec-tively, ωhb,i and ωb,i are the bounce frequencies of
heli-cally and toroidally trapped ions, respectively, and νheff,i
and νeff,i are the effective collision frequencies of
heli-cally and toroidally trapped ions, respectively. Because of the relation|k//vth,i| > ω, the response of transit ions
is given by the Boltzmann distribution. The collision fre-quency was greater than the gradient-B drift frequency (νheff,i > νeff,i > ωDM). These relations indicate that the
observed frequency is in the DTIM region. The dispersion relation was given as
ωDTIM≈
√
ε/2ω∗,andγ=ενeff,e−1ω∗2/4−ε−1νeff,i,
where ω∗ is the drift frequency of the wave and ε = r/R[40].
Our observations were compared to this theoretical prediction. In this experiment, γ was estimated as γ ∼
−103s−1 and the DTIM was predicted to be stable. The
frequency of the observed mode was 1.5-3.5 kHz in the laboratory frame. To estimate the frequency in the plasma frame, the Doppler shift because ofE×Bdrift should be considered. In low-density ECH plasmas, the positive elec-trostatic potential of the order ofTeis observed [34].
Con-sidering the positive mean electrostatic potential (of the or-der ofTe), a Doppler shift ofωE×B∼ −m×104s−1occurs
in the laboratory frame. Thus, the dispersion relation in the laboratory frame is predicted to be
ωlab=ωDTIM+ωE×B ∼ −(1+
√
ε/2)m×104s−1. The observed frequency was close toωlaband the spectral
width of excited fluctuations (∼ 1 kHz) was close to the damping rateγ[10]. The observed mode was close to that predicted as the linearly stable DTIM. We suppose here that the linearly stable DTIM is excited by nonlinear cou-pling with microscopic fluctuations.
The avalanche phenomena of heat transport withn=0 mode structure has also been predicted [11, 12]. In this case, the propagation speed of the avalanche is also of the order of the diamagnetic drift velocity. The n = 0 component in the ˜Trad fluctuations has not been observed.
The correlation between an avalanche and the very low-frequency (10-100 Hz) temperature fluctuations has been discussed in DIII-D [25]. The relationship between the
˜
Tradfluctuations in a sub-kHz band (Fig. 8 (a)) and the
The existence of low-frequency temperature fluctua-tions has been suggested in many toroidal plasmas [23– 25]. Fluctuations with a long distance correlation can be observed using the correlation technique reported in this study.
For reliable control of plasmas in thermonuclear fu-sion reactors, the establishment of algorithms, which con-sider not only the diffusive propagation but also the ballis-tic propagation of change of the transport, is required. The discovery that is reported in this article serves as a basis for these important challenges.
Acknowledgment
We thank Prof. P. H. Diamond, Dr. T. Yamada and Dr. Y. Nagashima for the useful discussions. We are grateful to the technical group in NIFS for their excellent support. This work is partly supported by a Grant-in-Aid for Scien-tific Research of JSPF, Japan (21224014, 19360148) and by the collaboration programs of NIFS (NIFS07KOAP017, NIFS10KOAP023) and of the RIAM of Kyushu University and Asada Science Foundation.
[1] J.A. Wesson,Tokamaks(Oxford, 1987).
[2] L. Laurent, Plasma Phys. Control. Fusion28, 85 (1986). [3] E.D. Fredricksonet al., Phys. Rev. Lett.65, 2869 (1990). [4] J.G. Cordeyet al., Plasma Phys. Control. Fusion36, A267
(1994).
[5] K.W. Gentleet al., Phys. Plasmas2, 2292 (1995). [6] U. Strothet al., Plasma Phys. Control. Fusion 38, 1087
(1996).
[18] A.E. Costley, Plasma Phys. Control. Fusion 30, 1455 (1988).
[19] H.K. Parket al., Phys. Rev. Lett.96, 195003 (2006). [20] A. Isayamaet al., Nucl Fusion47, 773 (2007).
[21] Y. Nagayamaet al., Phys. Rev. Lett.90, 205001 (2003). [22] H. Zohmet al., Phys. Plasmas8, 2009 (2001).
[23] S. Sattler and H.J. Hartfuss, Phys. Rev. Lett. 72, 653 (1994).
[24] C. Watts and C.F. Gandy, Phys. Rev. Lett.75, 1759 (1995). [25] P.A. Politzer, Phys. Rev. Lett.84, 1192 (2000).
[26] S. Inagakiet al., 23th IAEA Fusion Energy Conference (Daejon), IAEA, Vienna (2010) EXC/7-4Ra.
[27] K. Kawahataet al., Rev. Sci. Instrum.74, 1449 (2003). [28] K. Tanakaet al., Nucl. Fusion46, 110 (2006).
[29] T. Tokuzawaet al., Proc. 31st EPS conf., P5-114, London, UK (2004).
[30] S. Sakakibaraet al., Nucl. Fusion41, 1177 (2001). [31] H.J. Hartfuss, T. Geist and M. Hirsch, Plasma Phys.
Con-trol. Fusion39, 1693 (1997).
[32] A. Cavalloet al., Plasma Phys. Contr. Fusion23, 61 (1981). [33] Kasuyaet al., J. Plasma Fusion Res. SERIES9, 523 (2010). [34] T. Idoet al., Plasma Sci. Technol.11, 460 (2009). [35] Y.C. Kim and E.J. Powers,IEEE Trans. Plasma Sci.,
PS-7:120 (1979).
[36] Y. Nagashima, S.-I. Itoh, S. Shinohara, M. Fukao, A. Fujisawaet al., Phys. Plasmas16, 020706 (2009). [37] N. Tamuraet al., Nucl. Fusion47, 449 (2007).
[38] S. Kubo et al., AIP conference proceedings: ICPP2002 669, 187 (2003).
[39] A. Isayamaet al., Plasma Phys. Control. Fusion48, L45 (2006).