Oodo S.O, Zhang G, Hui S, Z.Jiyan
Department of Electrical and Electronics Engineering Dalian University of Technology China
Email:Oodo(@yahoo.com Phone: +86 13478724681
Abstract-- Traditional management technique for reactive power support has been in use for generations, on the Nigeria rural electric power system for the provision of reactive power supply to enhance the quality of power on the network. Recent Rapid industrialization of these rural areas however has brought about the presence of loads which varies their demand for reactive power. Thus voltage regulation due to insufficient reactive power supply became a critical issue, and without adequate power supply, there is no way small and medium scale industries [SMEs], which are the economic mainstay of any country, could be encouraged, The utility network needs to provide a controllable and variable amount of reactive power according to the requirement of the load rapidly to keep the voltage on its distribution network near to its rated value. This paper looks at the prospect of the application of a cost effective method of improving the voltage profile and power factor on the rural distribution network by the coordination of Distributed Static VAR Syatem (D-SVC) termed Integrated distributed Static VAR System (D-SVS) on the local rural power systems in Nigeria.
Index Term-- Voltage drop,power factor,Distributed Static
VAR,Rural Electric Network, Integrated D-SVC.
1. INTRODUCTION
The rapid growth of the Nigeria rural area has lead to massive industrialization and the expansion of the rural electric network without necessary allowing the transmission and distribution grid to keep pace with the statutory requirement for such expansion. During the last decade, Voltage Collapse has been observed on many rural power systems in Nigeria. The rural power systems are heavily loaded and the system voltage profile is normally at its lower limits. Further increase in the system load leads to voltage collapse of the whole system, hence the power utility undertake a progressive and systematic load shading to maintain the system and prevent it from shutting down. The voltage collapse or the instability is mainly caused by inadequate rapid reactive power support at
the critical feeder,thus these rural networks throughout the
country is under high proportion of:
Overloaded and overstretched system
Inadequate reactive power support
Presences of harmonics voltages and currents in the
system
Presence of very low voltages especially on the rural
areas.
Power outages at alarming frequencies.
Although the government has recognized the need to provide adequate reactive power support at the rural electric network feeders, it has great difficulty funding and organizing this endeavor due to the high cost of the reactive power support method available and some of these methods are often faced with public resistance to right of way, and raising electricity tariffs. One approach to solve this problem is the application Distributed Static VAR Compensator (D-SVC) using FACTS
devices such as Thyristor compensators. Thyristor
compensators are shunt connected Static VAr compensators (SVCs), they are a variable shunt reactance injecting or absorbing reactive power in order to control the voltage. They can sufficiently increase the power system performance by delivering or absorbing reactive power. They have been found to have rapid control, timing precision especially during disturbance, and virtually an unlimited switching life, making them to a have rapid control response for reactive power demand in order to control the voltage. Power utility experts believe that Distributed Static VAr at close proximity to loads making it a viable option for solving present or viable future reactive power shortage problem on the rural network. Distributed Static VAr can be 2 to 3 times more effective than bulk from longer distances at the transmission or distribution level at a minimal cost. An integrated D-SVC will reduce the overall cost of retrofitting D-SVC on the network.
Optimal Voltage Control on the Nigerian Rural
Electric System Using Coordition of
1
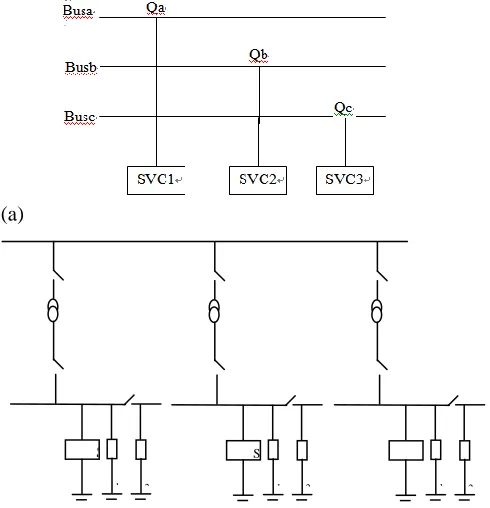
The proposed Integrated D-Static VarFig. 1. Types of Loads and Load flow between buses In Nigeria Rural area
From Figure 2 of the single line diagram of the traditional D-SVC, preliminary observation shows that the proposed Integrated D-SVC has a reduced M-VAR of the D-SVC bank arrangement by about 50 %, and is still sized with enough capacity to supply at least the total reactive power in order to drive the system distribution buses voltage Vbus back to the reference voltage. A simple analysis is illustrated below:
(a)
Fig. 2a. and 2b. A single line diagram of a 3 Buses Power system with connected D-SVC
The SVC parameters of a traditional SVC are determined according to the compensation requirement of the power
system. In order to derived the voltage Vbus back to the
reference: That is, for example For Buse2:
QSVC1 >Q2 (1)
QSVC1 > (Q1 +Q2) MVAr (2)
Where
Q1 = S3 opened SVC is in Open loop and is not exchanging power with the systems.
Q2 = S3 closed SVC is in closed loop and is exchanging power with the systems.
And the values for the capacitance and the inductance are then calculated based on the this setting/
2
(
bus)
C
SVC
V
X
Q
(3)2
C L
X
X
(4)From equations(6-3) and (6-4) above the considering the
fundamental frequency of f the values for capacitance (C) and
inductance (L) can be calculated and similarly the compensation required for the entire power system for Bus 2, Bus 3 and bus 4 is given by
Qsm = svc1+svc2+svc3 (5)
Qsm =((Q1 +Q2) + (Q1 +Q2) (Q1 +Q2))MVAr (6)
Qsm = (3Q1 +3Q2) MVAr (7)
Similarly considering the fundamental frequency of f of the
system C and L can be calculate accordingly as Csm = 3C Farads
Lsm = 3L Henry
From the simple illustration demonstrated in Figure.3 and comparing it to the proposed Integrated Static Var illustrated in Figure 2
In the conventional D-SVC and its control scheme, the voltage profile of the distribution system is controlled by the
SVC fitted on each Bus based on the profile data of individual Bus. However the difference in the loading period and peak
voltage of the individual Bus is not considered in above in
eqn. 7.
Qsvcb=SVC1
T=1
Qsvcb=SVC2
T=1
Qsvca=SVC1+SVC2
T=0
n or g bus c bus b bus a
950 Kvar 800 Kvar
SVC2 SVC1
b
Fig. 3. single line diagram of the proposed integrated D-SVC with the Manuel control system, with the Manuel control system
It will be demonstrated that the maximum reactive capacity of the D-SVS can be set to half of the maximum reactive power
t=0 at 8:00am-6:00pm t=1 at 6:15pm-7:30AM
Load Flow Load Flow t=0 Load Flow t=1 t=0 Area 1 Bus a Area 2 Bus c Area 3 Bus b S VC1 Q
1 L 1 Q 2 L 2 S 3 S 2 S 1 B US 2 T 1 S
VC2 Q
demand of the rural network, the figure are for illustration purpose. From equation 5 and equation 6 which is further abridged below in equation and 8b
Qsm = svc1+svc2+svc3 (8a)
Qsm =((Q1 +Q2) + (Q1 +Q2) (Q1 +Q2))MVAr (8b)
But the injection of reactive power into the rural system by the SVC is dependant on Time T=1 and T=0 and by
coordinated switching of the ID-SVC based on reactive power
management technique.
@T=0 =8:00am to 6:00Pm the reactive power injected into
Bus a is given by:
QSVCa >svc1+svc2 (9)
for bus a
Where Q2= 0
for Bus 2 Q2 = 0
for Bus 3
Qsm =(3Q1+Q2))MVA (10)
@ T=1 = 6:15pm to 11:30 pm and 5:00am to 7:30 am. The Reactive power injected into bus a & c is
given by:
QSVCc >svc1 (11)
for bus c
QSVCb >svc2 (12)
for bus b
Where Q2= 0 for bus 1
Qsm = (3Q1+Q2)) MVA 13)
Where
3Q1= S is opened -SVC is in Open loop and is not exchanging power with the systems.
1
2QSm >Q2 (MVar) (14)
The Max reactive capacity of the proposed integrated SVC
required In order to derived the voltage Vbus back to the
reference, is approximately 50% of that of the D-SVC considering that for Q1 = S is opened- SVC is in Open loop and is not exchanging power with the systems.
2. THE MANUAL CONTROL AND MONITORING OF THE BUSES.
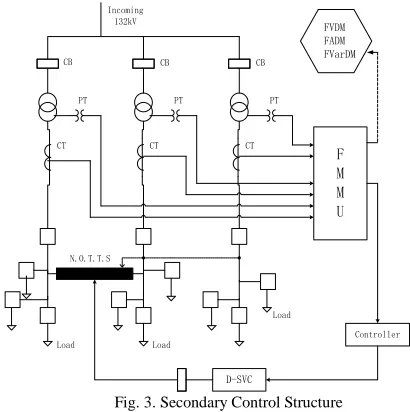
Secondary control Level: In the secondary or manual control SVC mode, the D-SVC transfer between Feeders is controlled from the rural Utility’s control center in the control
room independently of the SVC primary control. The D-SVC is transferred from one feeder to another based on the captured demand of the Feeders monitored on the control room by the feeder measuring and monitoring unit( F.M.M.U), the D-SVC transfer is switched ON and OFF manually. This level which usual is a Manual control unit located at the control room transfers (dispatch) the D-SVC from one feeder to another using the normally open Transition transfer Switch (N.O.T.T.S) and uses a set of rule to satisfy the optimation of the integrated D-SVS. The tool use to manage this control must have real-time function (e.g. Feeder state estimation) and optimization technique to find the best transfer time, according to the data of the feeder with reference Peak and off peak period. This tool is integrated into the control function which provides real time data like:
Feeder’s Ampere demand (Peak and off peak period)
Feeder’s Voltage Demand (Peak and off peak period)
Feeder’s Var Demand (Peak and off peak period)
Conventional PT and CT will be used obtain the Line voltage and current signal respectively to convert the voltage from high to low that Ampere demand Meters (ADM) and Voltage Demand Meters (VDM) for measurement and Visualization of the values with topological view if necessary.
The control method allocates the D-SVC to the Feeder (sensitive Feeder- Peak and off peak period) which is first selected by first identifying the feeder which has the largest loss due to the reactive power. The compensating D-SVC are placed on these optimal location with the appropriate Var rating thus achieving maximum benefit in cost saving
Controller F M M U
D-SVC
CB CB CB
PT PT PT
CT CT CT
N.O.T.T.S Incoming
132kV
FVDM FADM FVarDM
Load Load
Load
Fig. 3. Secondary Control Structure
made up of meters and other devices that provides information. Feeder voltage and feeder reactive power demands are closely monitored during Peak and of Peak loading conditions for Individual feeders on the network, and then control action is implemented to transfer the D-SVC from one feeder to another. The ID-SVC Control schemes provides a more cost effective way to maintain voltage level along feeders and minimize losses under all loading conditions, like conventional approach it also switches capacitors and inductors to control Var flow and feeder voltages as feeder conditions vary during the day.
However rather than basing the switching of the D-SVC solely on feeder measurements, the Var control functions base switching decisions on the entire feeders on the network, taking at the substation end of the feeders where all the Var flows and voltage of the entire feeders on the network is readily available. When the F.M.M.U detects that Var flow is become excessive during off peak period loading condition, it transfer the D-SVC to another feeder which begins to experience peak loading condition
Similarly, when the monitored voltage on Buses b&c becomes less than a preset value, at peak loading Period the operator selects the integrated D-SVC to the corresponding Feeder b&c.
In Summary, the voltage condition of the Feeders on the 33kv power system are monitored and measured
continuously, the measured voltage are received on meters provided and installed in the control room at the power system
substation. When the monitored voltage at feeder a becomes
lower than a preset value at peak Loading condition time the operator in the control room selects the integrated D-SVC to
bus a.
3. PERFORMANCE ANALYSIS AND SIMULATION
OF D-SVC
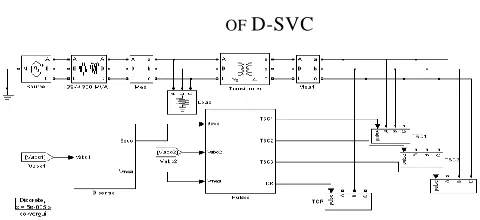
Fig. 6. Integrated D-SVC structure based on Matlab
As illustrated in Fig6 above, the system consists of 4 main parts-the main circuit, The susceptance Bsvc control, The SVC pulses generation and feeder circuit TSC plus TCR-using the simulink tool in Matlab to verify the feasibility of proposeD-SVS., its source is set at 33kv level with an initial load through the33kv/415v transformer.
The SVC are all delta connected so as to eliminate 6k
(k=0,1,2…) harmonic waves. Because in a balanced system all the triplen harmonics circulate in the closed delta connection and are absent from the line current, and also The delta connection allows several inductances Li to be connected in series to the capacitances Ci of the TSC which also acts as
filters of 5th or 7th etc. harmonic. The control system for
voltage regulation and configuration ratio principle for TSCs has great influence on the performance of the SVC. Further studies have even shown that this also affects the capacity of TSC to be used.
The three-phase source is set to be used in this experiment is set as indicated in the table below:
All the figures are in p.u. At time T= 0.2s, voltage increases to 1.025 and falls to 0.93 at time T= 0.5s, then rises to 1 at 1.0s. This is used to simulate the Load fluctuation.
Table I
Modeling and Simulation Parameters
NO. Ki Capacity of
TSC
Ban ks
1 800 1 1
500 1 1
2 500 1.25 (3:2) 2
500 1.00 (2:2) 2
3 500 1 1
500 1.00 (2:2) 2
500 1.00 (3:1) 2
500 1.00
(2:1:1)
3
From the Parameters in Table 3.I above, three different experiments were carried out for different Ki Values. Different Ki has different influence on the characteristics of PI; the capacity rating of TSC indicates the total Capacity of the TSC used in P.U. Figures in bracket refers to the proportion between the Banks;
Banks s indicates the number of TSC Banks
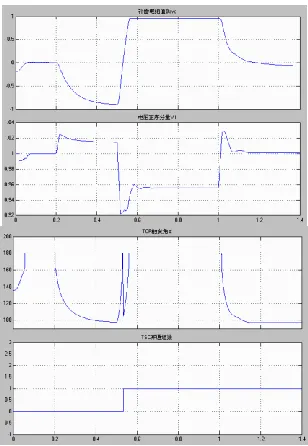
Fig. 7. Ki=500(left: Bsvc,, Voltage;) right: Trigger Angle(alpha), No. of banks Switched s-on)
The waveform on the left of the graph above shows the Bsvc and the dynamic variation in Voltage as the load increases or decreases. While the waveform on the right side displays the triggering
1. @, Ki=500: and Time T= 0.2s, the Vmea rises to 1.025 p.u. , therefore there is a need to reduce it to the steady state at this time there’s no TSC switched on. The thyristor
conduction will initially be the same But as the Vmea rises
further conduction system would increase the conduction angle of TCR immediately to nearly 100 degree, the TCR is
switched on and Vmea reduces 1.015(not 1.000 the
regulation depends on the the capacity of TSC switched on, and the capacity rating of the compensator, if the rating is small the compensator could restore approximately normal voltage, because faults are generally cleared within few cycles, large capacity rating is rarely justified (capacity rating is more often chosen to allow recovery to near-nominal
voltage during post fault period ). Again @ T =0.5s, Vmea
suddenly drops to 0.92 maybe due to very large disturbance such as large load being connected or disconnected from the
network and TCR responds quickly and again controls Vmea
to 1.001, however, it can be seen that TSC starts to operate at 0.525. There’s a 25ms delay due to PI’s integral effect. The process of voltage recovery has a small variation with the
maximum peak-to-peak amplitude = 0.015. Finally, Vmea
holds at 0.955 in 0.23s, compensating 3% of voltage. At 1.0s,
load becomes lighter and Vmea again rises to 1.03. Control
module adjusts the match between TSC and TCR, rapidily
switching of the shunt capacitors and bringing Vmea back to
1.001 in 0.12s.
Fig. 8. Ki=800 (left: Bsvc,, Voltage;) right: Trigger Angle(alpha), No. of banks Switched s-on)
CONCLUSION
The paper proposes an application of an integrated distribution static Var for power factor correction and voltage improvement on the Nigeria rural power network. The integrated distribution SVC is typical of many distribution SVC installed on low voltage network all over the world, the main differences are in the Switching of the SVC control strategy. Preliminary evaluation based on the characteristic of reactive power demand Nigerian Rural power systems has been demonstrated by the quantitative analysis of Fig 2 and 3 which provides the following Main advantages The capacitive MVars of the integrated Distribution SVC is less than that of the distribution SVC. This substantially reduces the reactive power rating of the SVC for achieving nearly the same voltage control objectives. The Integrated distribution SVC facilitates the sharing of reactive power among multiple Buses Customer’s power quality problem can be controlled using a number of different methods. The capacitive MVars of the Integrated Distribution SVC is less that that of the distribution SVC which translate to cost saving for the utility company it is a centrally dispatched time dependent integrated D-SVC based on reactive power management model with a coordinated switching technique to restore the voltage at the operation point to the desired Bus Voltage angle of TCR and the total number of TSCs switched
REFERENCES
[1] T.J.E Miller, editor, “Reactance power control in electric systems”, John Willey and Jons, New York, 1982.
[2] P. Kundur, “Power system stability and control”, Mc Graw-Hill, 1994.
[3] R. Mohan and Rajiv K. Varma, Thyristor-based facts controllers for electrical transmission system, IEEE press.
thyristor controlled reactive power”, IEEE PAS, vol 101, no. 8, pp. 3930-3939, 1981.
[6] Hadi Saadat, “Power system analysis”, Mc Graw-Hill companies. Inc, 1999.
[7] Daniel J. Sullivan, Improvement in voltage and dynamic performance of power transmission system using static var compensators, BSEET, Pennsylvania State University, 1995. [8] D. Yongan “Reactive power compensation of transmission lines” [9] M N Nwohu” Voltage stability improvement using Static Var
Compensator in Power Systems” Leonardo Journal of Sciences January-June 2009