Abstract—To effectively achieve mitigation of heat island effects requires classification of urban climate zones in advance based on analysis of the relationship between air temperature and urban spatial elements. The objective of this study is to: 1) identify influential urban spatial elements affecting air temperature by statistical analysis, and 2) provide fundamental information on establishing thermal environment enhancement planning through urban climate zones (UCZ) based on statistical analysis.
This study consists of three parts: First, the air temperature of study area was analyzed using Lands at TM remotely sensed images. Next, preparative variables including topology land use, land cover, building types, and human activities to classify UCZ were prepared, and influential urban spatial elements affecting air temperature were identified by regression analysis. Finally, UCZ were delineated by K-clustering analysis, and the appropriateness of the classified UCZ were verified using ANOVA testing.
The study results show that urban elements affecting air temperature include impervious surface ratio, elevation, water area, distance from a subway station, and road area. In addition, a total of 10 UCZ were detected by K-clustering analysis, and the results of the ANOVA test shows that each classified UCZ was in statistically different groups. Moreover, UCZ and air temperature maps were found to display an almost identical pattern.
This study identified more accurate and clearer UCZ boundaries and explained statistically significant urban spatial characteristics to better understand the urban climate phenomenon. The results of this study can provide urban planners, architects, and landscape planners fundamental information to help manage the urban thermal environment.
Index Terms—Air temperature, statistical analysis, UCZ (urban climate zones), urban spatial elements.
I. INTRODUCTION
The urban heat island effect causes air temperatures in a city’s interior to be significantly warmer (approximately 2-3oC) than in suburban areas. The main causes of an urban heat island are land cover changes, energy usage, population center growth, and high density urban developments. Efforts to mitigate the urban heat island effect has been attempted in the urban planning field through physical controls such as land cover changes, urban development density control, and building arrangement. However, in order to achieve effective urban heat island mitigation planning, classification of urban climate zones is needed in advance based upon analysis of the
Manuscript received November 25, 2015; revised January 21, 2016. D. Lee is with the Research Institute of Spatial Planning and Policy, Hanyang University, Soule, Korea (e-mail: estevan0705@ hotmail.com).
K. Oh is with the Department of Urban Planning and Engineering, Hanyang University, Seoul, Korea (e-mail: [email protected]).
relationship between air temperature and urban spatial elements. Urban Climate Zones (UCZ) are homogeneously classified areas that distinguish climate characteristics based on built types and land cover types [1]. The UCZ concept is useful in planning the urban thermal environment because it offers integrated information on climate characteristics and related spatial elements. A number of research efforts to classify UCZ based on climate phenomena have been widely attempted. But, most of the research has tended to select variables based on the researcher’s intuitional judgments or discretionary delineation of urban climate zone boundaries. The classifying of UCZ by these methods may cause different results from actual urban climate phenomenon because significant variables cannot be accounted for.
The aim of this study is to: 1) identify by statistical analysis, influential urban spatial elements that affect air temperature, and 2) provide fundamental information on establishing thermal environment enhancement planning through urban climate zones (UCZ) based on statistical analysis.
II. LITERATURE REVIEW
Urban Climate Zones (UCZ) are homogeneously classified areas that distinguish climate characteristics based on built types and land cover types [2]. UCZ studies have been conducted as fundamental research to understand urban weather phenomena. In fact, a number of studies have been attempted to classify urban climate zones in consideration to spatial elements.
Chandler (1965) [3] classified urban areas into four types in London and considered climate, topology, and building forms. Auer (1978) [4] classified urban areas into 12 types considering the characteristics of vegetation and buildings using urban land use information. In addition, Ellefsen (1991) [5] introduced the UTZ (Urban Terrain Zones) concept with 17 categories. Meanwhile, Oke (2006) [1] presented the UCZ concept considering urban structure, land cover, materials, human activities, and climate control capabilities of vegetation. Moreover, building upon existing UCZ concepts, Oke (2012) [2] unveiled the LCZ concept to classify urban areas more concretely whereby the more detailed LCZ delineates a combination of 7 land cover types and 10 building types, and urban areas are classified as a dominant combination on the local scale. Because the LCZ concept is very useful in identifying urban spatial elements affecting the urban thermal environment, related research has been conducted in a number of countries including Japan, Nigeria, France, Hong Kong, Hungary, and the U.S.
However, studies regarding UCZ have mainly focused on presenting concepts while actual efforts to classify UCZ for
Classifying Urban Climate Zones Based upon Statistical
Analysis of Urban Spatial Characteristics
D. Lee and K. Oh
real metropolitan cities have been rarely attempted. Furthermore, most of the research has tended to select variables based on the researcher’s intuitional judgments or delineate urban climate zone boundaries on a discretionary basis. The classification of UCZ by these methods may cause different results from those that really exist in actual urban climate phenomena because significant variables cannot be accounted for. Therefore, to classify UCZ more accurately, systematic and scientific analysis of the relationship between urban climate characteristics and urban spatial elements is needed.
III. STUDY METHOD
This study consists of three parts, and each process is presented in Fig. 1. First, land surface temperatures were identified using Landsat TM images, and air temperatures were analyzed through regression analysis between AWS (Automatic Weather System) temperatures and land surface temperatures. Next, preparative variables including topology land use, land cover, building types, and human activities to classify UCZ were prepared, and influential urban spatial elements affecting air temperature were identified by regression analysis. Finally, UCZ in the study area were
delineated by K-clustering analysis, and the appropriateness of the classification of UCZ were verified using ANOVA testing. In addition, the spatial characteristics of each UCZ were investigated based on the proportion of influential urban spatial elements.
Fig. 1. Study flow.
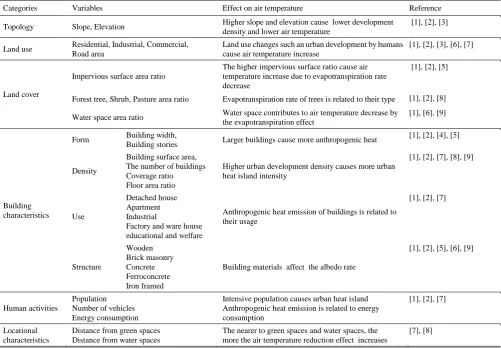
TABLEI:PREPARATIVE VARIABLES (URBAN SPATIAL ELEMENTS) FOR UCZ
Categories Variables Effect on air temperature Reference Topology Slope, Elevation Higher slope and elevation cause lower development
density and lower air temperature
[1], [2], [3]
Land use Residential, Industrial, Commercial, Road area
Land use changes such an urban development by humans cause air temperature increase
[1], [2], [3], [6], [7]
Land cover
Impervious surface area ratio
The higher impervious surface ratio cause air temperature increase due to evapotranspiration rate decrease
[1], [2], [5]
Forest tree, Shrub, Pasture area ratio Evapotranspiration rate of trees is related to their type [1], [2], [8] Water space area ratio Water space contributes to air temperature decrease by
the evapotranspiration effect
[1], [6], [9]
Building characteristics
Form Building width,
Building stories Larger buildings cause more anthropogenic heat
[1], [2], [4], [5]
Density
Building surface area, The number of buildings Coverage ratio Floor area ratio
Higher urban development density causes more urban heat island intensity
[1], [2], [7], [8], [9]
Use
Detached house Apartment Industrial
Factory and ware house educational and welfare
Anthropogenic heat emission of buildings is related to their usage
[1], [2], [7]
Structure
Wooden Brick masonry Concrete Ferroconcrete Iron framed
Building materials affect the albedo rate
[1], [2], [5], [6], [9]
Human activities
Population Number of vehicles Energy consumption
Intensive population causes urban heat island Anthropogenic heat emission is related to energy consumption
[1], [2], [7]
Locational characteristics
Distance from green spaces Distance from water spaces
The nearer to green spaces and water spaces, the more the air temperature reduction effect increases
[7], [8]
A. Air Temperature Analysis
Land surface temperature information was prepared from Landsat images taken at 11:00 a.m. on June 1, 2009. The land surface temperature was calculated using a conversion
B. Influential Urban Spatial Elements Selection
This study classified urban spatial elements into 7 categories including topology, land use, land cover, building characteristics, human activities, and other locational characteristics based on the literature review (Table I). Considering the average block size of the study area, urban spatial elements were prepared as a 300m×300m grid for regression analysis. Next, variables for the regression analysis were selected based on correlation analysis results of air temperature and urban spatial elements. Finally, influential urban spatial elements affecting air temperature were identified by regression analysis.
C. UCZ Classification
The UCZ of the study area were classified based on K-clustering analysis of influential urban spatial elements. Next, the appropriateness of the classified UCZ were verified by ANOVA testing on air temperature distribution. In addition, spatial characteristics of each UCZ were investigated based on the proportion of influential urban spatial elements. Finally, UCZ classification results in terms of explaining the actual air temperature phenomenon were verified by comparing a UCZ map and an air temperature map.
IV. CASE STUDY
A. The Study Area
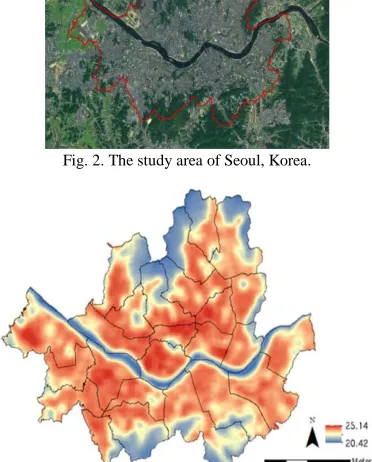
Classification of the UCZ was applied to Seoul, the capital of Korea (Fig. 2). Seoul is one of the densest cities in the world in which 21.5% (about 11 million inhabitants) of country’s total population reside. Seoul is also a representative heat island city which has various spatial characteristics (Fig. 3).
Fig. 2. The study area of Seoul, Korea.
Fig. 3. Air temperature of the study area.
B. Air Temperature Analysis Result
To identify the land surface temperatures, the Quadratic Regression model was employed as the conversion formula. Equation 2 shows the regression analysis results between AWS temperature and land surface temperature by Landsat. The p-value is 0.000 and t of the constant is 13.143.
2
12.174 0.371 ,
0.681
Y
X R
(1)Fig. 3 presents the air temperature map of the study area on June, 1, 2009 by equation 1. The temperatures ranged from 20.427oC to 25.14oC, and the maximum and minimum gap of the air temperature was approximately 5oC.
C. Influential Urban Spatial Elements Selection
Table II shows the correlation analysis results of air temperature and urban spatial elements. The shaded elements mean that they have a relatively high correlation (more than ±0.3). The most positive correlated variable is the impervious surface area ratio whereas forest trees show the most negative correlation with air temperature. In order to create a model for predicting air temperature, the variables that have a strong correlation were inputted for regression analysis.
Because the aim of regression analysis is to determine influential urban spatial elements that affect air temperature, a forward method was applied to create an air temperature predicting model. Among the many models that analyzed the forward method, the final model was selected considering R2 variation and the appropriateness of the independent variables.
The R2 of the selected model in this study is 0.79 and the F-value is 291.536. Urban spatial elements in topology, land use, land cover, and human activity were included in the variables in the regression model. Variables in building characteristics and other locational characteristics were excluded in the model. In actuality, these variables might affect air temperature. The reason that building characteristic variables are excluded in the model is that a number of building types are located in the study area. In the case of locational characteristics, development patterns near the water spaces and green spaces in study area are very dynamic. These dynamical spatial characteristics of study area cause a exclusion of variables.
Meanwhile, the spatial elements including impervious surface area ratio and road area were identified as variables increasing air temperature. On the other hand, elevation, water space area, and distance from a subway station turned out to be causing air temperature reduction. Moreover, the most influential variables increasing air temperature were found to be the impervious surface area ratio and elevation. (Table III). These results are the main reason that the heat island effect occurs. Therefore, reducing impervious surface areas and expanding water space areas is preferentially required in order to improve the thermal environment in the study area.
D. The Results of UCZ Classification
A total of 10 UCZ were detected by K-clustering analysis of the selected urban spatial elements. In addition, test results showed that each classified UCZ were in a statistically different group (F=2,446.549, p=.000). Table IV shows the air temperature range and area proportion of each UCZ.
TABLEII:PREPARATIVE VARIABLES (URBAN SPATIAL ELEMENTS) FOR UCZ Categories Variables Correlation
coefficient
Categories
Variables Correlation coefficient Topology Slope
Elevation
-.589** -.602**
Building characteristics Use
Structure
Detached house Apartment Sales area Business Factory and ware house
Educational and welfare Wooden Brick masonry Concrete Iron framed
.270** .180** .377** .159** .155** .128** .183** .371** .520** .110** Land use
Residential area Commercial area Industrial area Road area Green spaces area Water spaces area Vacant area
.433** .345** .109** .365** -.619** .352** -.055**
Land cover
Impervious surface area ratio Pasture area ratio
Forest tree area ratio Shrub area ratio
.715** -.199** -.618**
-.536** Human activities Population
The number of vehicle Energy consumption Distance from subway station
.540** .365** .358** -.631** Building
characteristics
Form Building width, Building stories
.404** .317**
Density
Building surface area, The number of buildings Coverage ratio Floor area ratio
.539** .438** .438** .627**
Other climate characteristics Distance from green spaces Distance from water spaces
.374** .030**
N: 6899, ** p<0.01
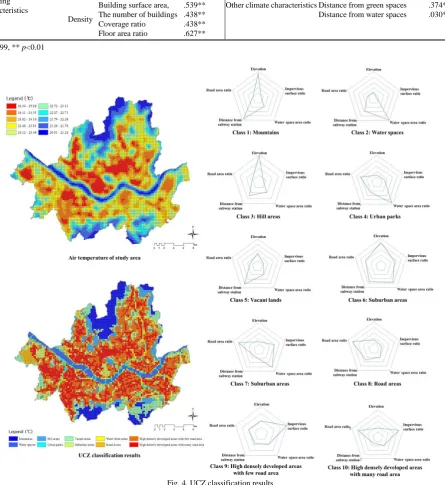
Fig. 4. UCZ classification results.
In order to determine the characteristics of each UCZ, mainly distributed urban spatial elements in each UCZ were investigated. In the order low temperatures, the UCZ of the
areas, and high densely developed areas with many road areas. In addition, UCZ and air temperature maps were found to display an almost identical pattern. Among the 10 UCZ, areas that have relatively high air temperatures were mainly
distributed in 2 zones of high densely developed areas with few road areas and high densely developed areas with many road areas (Fig. 4).
TABLEIII:REGRESSION ANALYSIS RESULT
Unstandardized coefficients Standardized coefficients t p-Value VIF Constant value 21.974 1529.161 .000
Impervious surface area ratio 1.004 .319 38.936 .000 2.200 Elevation -1.893 -.408 -48.643 .000 2.309 Water spaces area -2.042 -.356 -53.208 .000 1.473 Distance from subway station -.714 -.181 -24.005 .000 1.868 Road area .466 .119 17.074 .000 1.584
TABLEIV:AIR TEMPERATURE RANGES OF EACH UCZ Class Air temperature (℃) Area proportion (%)
Mean Min. Max.
Class 1 21.507 20.616 23.391 10.40 Class 2 21.512 20.505 23.905 4.67 Class 3 22.157 20.963 23.783 6.66 Class 4 22.706 20.770 24.119 2.83 Class 5 22.786 20.619 24.061 7.91 Class 6 23.217 21.834 24.761 11.07 Class 7 23.427 22.112 24.491 3.29 Class 8 23.612 21.649 25.001 4.85 Class 9 23.842 22.484 24.804 24.85 Class 10 14.013 22.565 25.083 23.47
V. CONCLUSIONS
Based on the statistical analysis results, this study identified more accurate and clearer UCZ boundaries and explains statistically significant urban spatial characteristics to better understand urban climate phenomena. The urban spatial elements causing air temperature increase and their effects were concretely identified, and the potential areas where urban heat islands occur were delineated using a UCZ map.
Such a UCZ classification has usefulness as follow: First, classifying UCZ offers integrated information on climate characteristics and related urban spatial elements. Efforts for integration of urban climate knowledge with urban planning has been attempted, however these efforts have not been particularly useful or successful due to the urban dynamics of urban spatial elements. The study results provide urban planners with basic information to better understand urban climate characteristics.
Second, UCZ offer locational information on potential urban heat island areas and the causes of their occurrence. It also enables urban planners to know where areas should be preferentially managed and what kind of alternatives applied to such areas should be employed to mitigate urban heat islands.
Consequently, the results of this study can provide urban planners, architects, and landscape planners fundamentally integrated information to help in planning the urban thermal environment. These results can also be utilized for spatial planning to reduce the urban heat island effect.
In addition, if air temperature at seasonal time points are considered in further studies, more scientific and accurate UCZ classification will be possible. Also, once urban planning and design variables such as building characteristics are included in regression variables, more detail classification will be possible, and subsequently more concrete information could be retrieved from it.
ACKNOWLEDGMENT
This research was supported by a grant (15AUDP-B102406-01) from Architecture & Urban Development Research Program (AUDP) funded by Ministry of Land, Infrastructure and Transport of Korean government.
REFERENCES
[1] A. H. Auer, “Correlation of land use and cover with meteorological anomalies,” Journal of the Applied Meteorology, vol. 17. pp. 636-643. 1978.
[2] T. J. Chandler, The Climate of London, Hutchinson. 1965.
[3] R. Ellefsen, “Mapping and measuring buildings in the urban canopy boundary layer in ten US cities,” Energy and Buildings, vol. 15-16. pp. 1025-1049. 1991.
[4] M. Mizuno, Y. Nakamura, H. Murakami, and S. Yamamoto, “Effects of land use on urban horizontal atmospheric temperature distributions,” Energy and Buildings, vol. 15. pp. 165-176. 1991. [5] T. R. Oke, “Towards better scientific communication in urban
climate,” Theoretical and Applied Climatology, vol. 84. pp. 179-190. 2006.
[6] I. D. Stewart and T. R. Oke, “Local climate zones for urban temperature studies,” American Metrological Society, vol. 93. pp. 1879-1900. 2012.
[7] N. C. Toby, and S. T. Arthur, “The impact of land use-land cover changes due to urbanization on surface microclimate and hydrology : A satellite perspective,” Global and Planetary Change, vol. 25. pp. 49-65. 2000.
[8] J. A. Voogt and T. R. Oke, “Thermal remote sensing of urban climates,” Remote Sensing of Environment, vol. 85. pp. 370-384. 2003.
[9] W. Zhoua, G. Huang, and M. L. Cadenasso, “Does spatial configuration matter? Understanding the effects of land cover pattern on land surface temperature in urban landscapes,” Landscape and Urban Planning, vol. 102. pp. 54-63. 2011.
D. Lee isa post-doctoral researcher at the Research Institute of Spatial Planning and Policy, Hanyang University, Seoul, Korea. He received his doctorate degree in Urban Planning at Hanyang University for his research, flood mitigation capability of urban green infrastructures. Since 2013, he has been working as a part-time instructor in the Department of Urban Planning and Engineering at Hanyang University. His recent works involve developing a landscape ecological assessment system applying GIS analysis. Mr. Lee is currently researcher of a national R&D project, developing the urban thermal environmental planning and
design system for adapting climate change. His research interests include urban environmental planning, landscape ecology, GIS and spatial analysis, and climate change adaptation.
K. Oh a professor in the Department of Urban Planning and Engineering at Hanyang University in Seoul, Korea, where he conducts courses on environmental planning, urban design, landscape analysis, GIS and urban spatial analysis, and climate change adaptation. He completed both his undergraduate and graduate work in Landscape architecture at Seoul National University and Cornell University, respectively.
He received his Ph.D. in environmental planning at the University of California, Berkeley. Professor Oh was a visiting professor for the Center for Advanced Spatial Analysis at the University College London, U.K.