Contents lists available atScienceDirect
Soil Biology and Biochemistry
journal homepage:www.elsevier.com/locate/soilbio
Soil microbial populations in deep
fl
oodplain soils are adapted to infrequent
but regular carbon substrate addition
E.L. Cressey
a,∗, J.A.J. Dungait
b, D.L. Jones
c, A.P. Nicholas
a, T.A. Quine
aaCollege of Life and Environmental Sciences, University of Exeter, Rennes Drive, Exeter, Devon, EX4 4RJ, UK bSustainable Agriculture Sciences, Rothamsted Research, North Wyke, Okehampton, Devon, EX20 2SB, UK cSchool of Environment, Natural Resources and Geography, Bangor University, Gwynedd, LL57 2UW, UK
A R T I C L E I N F O
Keywords:
Soil organic carbon Soil microbial biomass
14C-labelling
Dissolved organic carbon Depth
Mineralisation Floodplain Stoichiometry
A B S T R A C T
Floodplain soils provide an important link in the land-ocean aquatic continuum. Understanding microbial ac-tivity in these soils, which can be many metres deep, is a key component in our understanding of the role of
floodplains in the carbon (C) cycle. We sampled the mineral soil profile to 3 m depth from twofloodplain sites under long-term pasture adjacent to the river Culm in SW England, UK. Soil chemistry (C, nitrogen (N), phos-phorus (P), soil microbial biomass (SMB), moisture content) and soil solution (pH, dissolved organic C (DOC) and N, nitrate, ammonium, water extractable P) were analysed over the 3 m depth in 6 increments: 0.0–0.2, 0.2–0.7, 1.0–1.5, 1.5–2.0, 2.0–2.5, and 2.5–3.0 m.14C-glucose was added to the soil and the evolution of14CO
2
measured during a 29 d incubation. From soil properties and14C-glucose mineralisation, three depth groups emerged, with distinct turnover times extrapolated from initialk1mineralisation rate constants of 2 h (topsoil
0.0–0.2 m), 4 h (subsoil 0.2–0.7 m), and 11 h (deep subsoil 1.0–3.0 m). However, when normalised by SMB,k1
rate constants had no significant differences across all depths. Deep subsoil had a 2 h lag to reach maximal14CO2
production whereas the topsoil and subsoil (0.2–0.7 m) achieved maximum mineralisation rates immediately. SMB decreased with depth, but only to half of the surface population, with the proportion of SMB-C to total C increasing from 1% in topsoil to 15% in deep subsoil (> 1.0 m). The relatively large SMB concentration and rapid mineralisation of14C-glucose suggests that DOC turnover in deep soil horizons infloodplains is limited by
access to biologically available C and not the size of the microbial population.
1. Introduction
Carbon (C) dynamics in deep soil are some of the most poorly un-derstood components of the global C cycle, despite an estimated 75% of the C found in the top 3 m of soil occurring below 0.2 m (Jobbágy and Jackson, 2000;Rumpel and Kögel-Knabner, 2010). Subsoil soil organic carbon (SOC) has predominantly been considered older (i.e., large radiocarbon age), more stable and chemically recalcitrant than that of topsoil (Wordell-Dietrich et al., 2017), with decomposition rates in-creasing with depth down the profile. However, many existing SOC decomposition models tend to simplify decay rates to one pool, which can lead to an underestimation of the amount of C observed at depth (Jenkinson and Coleman, 2008). Subsoils have been suggested as having the potential to store additional C due to reduced microbial activity at depth, but there is debate surrounding the stability of C in subsoil (Kramer et al., 2013;Jones et al., 2018). Recent studies have reported little difference in the decomposability of topsoil SOC com-pared with subsoil SOC, with stability potentially linked to the physical
environment rather than the molecular recalcitrance of subsoil SOC (Fontaine et al., 2007; Gregory et al., 2016; Heitkötter et al., 2017; Jones et al., 2018). Subsoils vary in oxygen availability, moisture content (MC), mineralogy, metal concentrations, quantity and quality of SOC and microbial population abundance when compared to topsoil, and increasing spatial heterogeneity, i.e., physical separation of de-composers to available substrate, which may all contribute to observed stability (Salomé et al., 2010; Chaopricha and Marín-Spiotta, 2014; Wordell-Dietrich et al., 2017;Jones et al., 2018).
Deep soils are characterised by having SOC radiocarbon ages of many thousands of years (e.g. 2500 y at 0.6–0.8 m; Fontaine et al., 2007). However, rapid accretionary environments, such asfloodplain soils, can be much younger (e.g. > 250 y for the top 0.6 m;Lair et al., 2009). Somefloodplain soils can extend beyond 8 m in depth and the age can vary greatly depending on soil conditions (Lair et al., 2009; Zehetner et al., 2009; Chaopricha and Marín-Spiotta, 2014). Flood-plains are dynamic, complex systems characterised by large spatial and temporal variation in physical and chemical characteristics, e.g. in
https://doi.org/10.1016/j.soilbio.2018.04.001
Received 30 June 2017; Received in revised form 26 March 2018; Accepted 2 April 2018
∗Corresponding author.
E-mail address:[email protected](E.L. Cressey).
Available online 12 April 2018
water flow, channel migration, sediment transportation and nutrient retention (Raymond and Bauer, 2001;Graf-Rosenfellner et al., 2016). They are also productive ecosystems due to the continual input of fresh, nutrient rich sediments resetting soil formation to an early phase of OC accumulation with rapid accumulation of labile C and nitrogen (N; Zehetner et al., 2009). However, the biogeochemical processes occur-ring in these systems remain poorly understood.
There is debate over the survival of C in floodplain systems with Wang et al. (2014) reporting 2–14 times slower turnover of SOC in depositional areas, with buried SOC in saturated riparian soils re-maining stable for thousands of years (Chaopricha and Marín-Spiotta, 2014). By contrast, Hoffmann et al. (2013)suggested rapid turnover and reduced C sequestration rates. The complexity offloodplain C dy-namics is also increased by the additional lateral and verticalfluxes of C from erosion,flooding and sediment deposition (Regnier et al., 2013; Jansen et al., 2014) and by enhanced vertical movement of dissolved OC (DOC) due toflushing of C from upper soil horizons (Morel et al., 2009). Furthermore, the co-transport of nutrients is likely to affect the stoichiometry of depositional soils in favour of mineralisation. Carbon storage in deeper soils is suggested to be due to the limitation of easily available substrate (Fontaine et al., 2007; Salomé et al., 2010; Heitkötter et al., 2017;Jones et al., 2018). Indeed, microbial hotspots in deep unsaturated subsoils have been reported in areas of preferential DOCflow (Gocke et al., 2017). Therefore, riparian soils with regular inputs of DOC duringflood events may have enhanced mineralisation potential in the hyporheic zone (Marín-Spiotta et al., 2014).
Carbon storage in subsoils may also be driven by the vertical transport of DOC, which is subsequently chemically protected (Kramer and Gleixner, 2008;Müller et al., 2016). Alternating redox conditions in periodically inundated soils can lead to anoxic conditions, which, in turn, can lead to reduced decomposition rates, increased SOC and DOC accumulation and increased denitrification (Bräuer et al., 2013;Hanke et al., 2013;Ding et al., 2017). Furthermore, the predicted increases in temperature and precipitation from the altering of the North Atlantic storm track and intensification of the global hydrological cycle due to climate change may alter the redox state from increasedflushing and/ or waterlogging (Orme et al., 2017). This might result in high intensity erosion events, changes to soil microbial activity, and may also cause enhanced nitrification, denitrification respiration, methanogenesis rates and increased DOC transport through soils (Keller and Bridgham, 2007; Beniston et al., 2015;Poblador et al., 2017).
Despite the potential significance offloodplain soils in the terrestrial C cycle, they are acknowledged to be under-represented in empirical studies (Bullinger-Weber et al., 2014). Riverine systems are dynamic and likely to become more so with future climate change, withWorrall et al. (2004)reporting an increase of 0.02 Mt C y−1in the UK riverine DOCflux of 0.86 Mt C y−1, andSandford et al. (2013)reporting a 91% increase in DOC in UK rivers and lakes over the past 20 years, with the coincident increasing supplies of biologically available C and other macronutrients (e.g. N and phosphorus (P)). Therefore, it is important to measure the response of microbial activity to DOC in this largely unquantified environment. We test the hypothesis that deepfloodplain soil systems support a relatively large metabolically alert microbial population able to respond rapidly to substrate supply. Our study was based on a rapidly accreting mineral soil under permanent pasture, undergoing regular flood inundation (approx. 8 times per year, with
floodwaters typically receding within 24 h;Walling and Bradley, 1989; Simm and Walling, 1998;Walling et al., 2006). The hypothesis was tested using measurements of soil microbial biomass (SMB), basal re-spiration and the addition of a 14C-labelled simple sugar (glucose) under aerobic laboratory conditions as a general proxy for microbial activity in a dynamic temperate grasslandfloodplain soil profile.
2. Materials and methods
2.1. Field sites
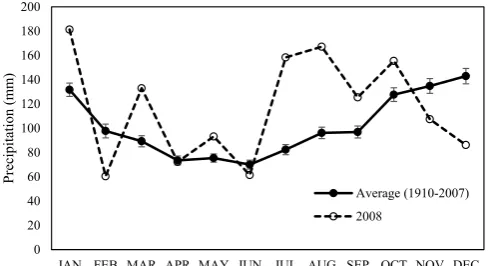
The field sites were two active channel riparian grassland sites (Smithincott: 50°33′50.2″N, 3°20′34.8″W and Rewe: 50°47′15.2″ N, 3°29′20.0″W) on the river Culm in SW England, UK that are permanent pasture grazed by cattle in the summer. The river has a catchment of 276 km2, with a mean altitude of 140 m a.s.l., dominated by sandstone and marl lithology, with a mean precipitation of 952 mm and an esti-mated sediment yield of 25 t km−2y−1(Walling et al., 2006). However, 2008 was a notably stormy year with elevated rainfall (Fig. 1); during which SW England experienced a 15% increase in recorded precipita-tion above the annual average (from 1910 to 2007), with 65% greater precipitation than average in the three months prior to sampling (Met Office, 2017).
2.2. Soil sampling
Soil cores were sampled in October 2008. At Smithincott, 7 cores were sampled along a transect perpendicular to the bank, with the primary transect 30 m from the river channel, with 4 cores sampled at 10 m intervals and a secondary transect of 3 cores 10 m perpendicular to the bank; all cores were sampled 25 m apart. At Rewe, 5 cores were sampled at 20 m intervals along a transect from 15 m from the bank to a maximum distance of 85 m from the channel.
Soil cores were extracted from 0.0 to 3.0 m depth and divided into 6 depth increments: 0.0–0.2 (n= 12), 0.2–0.7 (n= 12), 1.0–1.5 (n= 10), 1.5–2.0 (n= 10), 2.0–2.5 (n= 6) and 2.5–3.0 m (n= 6). Topsoil (0.0–0.2 m) and subsoil (0.2–0.7 m) cores were sampled using a per-cussion hammer (0.1 m diameter; Wacker Neuson Ltd, Stafford, UK), directly adjacent to deep subsoil cores (1.0–3.0 m), sampled using a pneumatic corer (0.03 m diameter; Geoprobe, DT22 Soil Sampling System, KS, USA) to reduce compaction effects in the top metre. The cores were sealed in plastic tubes and stored at 4 °C for 1 week prior to analysis.
As perFontaine et al. (2007),Heitkötter et al. (2017)and Wordell-Dietrich et al. (2017), topsoil and subsoil were sieved, under aerobic conditions, prior to analysis through a large mesh (7 mm) to maintain soil aggregate structure, to homogenise the samples and remove large roots and stones. Sieving through mesh of this size does not sig-nificantly affect soil microbial activity or the intrinsic DOC dynamics of the soil (Jones and Willett, 2006). The sieved soil samples were sub-divided into four equal portions for mineralisation, respiration, ana-lyses of soil properties and soil solution extractions and stored in gas permeable bags at 4 °C.
2.3. Soil properties and soil solution characteristics
Bulk soil was further sieved through 2 mm mesh to remove roots and analysed for soil particle size, pH and total C, N and P and organic P (Porganic). Soil particle size was measured by high definition digital particle size analysis using a Saturn DigiSizer (Micromeritics, Saturn DigiSizer™5200, Norcross, GA, USA). Soil pH was determined in a 1:1 (v/v) soil/distilled water extract. Percentage MC, total C, N and P were analysed using oven dried soil (105 °C to constant weight). C and N content was determined using a Flash 2000 organic elemental analyser (Thermo Scientific, CE Instruments Ltd, Wigan, UK) and P was de-termined colorimetrically according toSaunders and Williams (1955) on a FLUOStar Omega microplate reader (BMG Labtech, GmbH, Ger-many). Porganic was calculated by subtracting inorganic P (Pinorganic) from total P (Ptotal), extracted using 0.5 M sulphuric acid digest for 16 h, with Ptotaldigested after a 4 h ignition at 550 °C.
Soil solution was extracted according to the centrifugal-drainage procedure ofGiesler and Lundström (1993). Briefly, soil in a 1:1 (v/v) soil/distilled water was centrifuged after gentle mixing for 30 s (4000 g, 15 min, 20 °C) to obtain water extractable soil solution and the col-lected solutions were frozen at−20 °C prior to analysis. Soil solution samples were analysed according toBoddy et al. (2007)for DOC and total dissolved N (TDN) using a Shimadzu TOC-V-TN analyser (Shi-madzu Corp.). Nitrate (NO3−) was determined colorimetrically by the Cu-Zn-hydrazine reduction method ofDownes (1978)and ammonium (NH4+) by the salicylate-hypochlorite procedure ofMulvaney (1996); dissolved organic N (DON) was estimated by the subtraction of NO3− and NH4+from TDN. Glucose was determined spectrophotometrically with a Glucose (GO) Assay®kit (Sigma-Aldrich, MI, USA) and water extractable-Phosphate (Pwater) colorimetrically using the molybdate-ascorbic acid method ofMurphy and Riley (1962).
2.4. Microbial activity
To enable an initial investigation into the behaviour of the microbial activity in these mineral soilfloodplain systems incubations were un-dertaken under aerobic laboratory conditions using field-moist soils. Basal respiration was measured using an automated multi-channel infra-red gas analyser (IRGA, PP-Systems Ltd., Hitchin, UK) after a 10 h incubation at 10 °C, to reduce the impact of sub sampling on the mi-croorganisms. SMB-C content was determined by chloroform-fumiga-tion-extraction on 5 g of soil (24 h); soils were then extracted using 1:5 (w/v) ratio of 0.5 M potassium sulphate and dispersed on a reciprocal shaker for 1 h prior to being centrifuged (4000 g, 15 min, 20 °C). The solutions werefiltered through Whatman 42filters before being frozen at −20 °C for DOC analysis using a Shimadzu TOC-V-TN analyser (Shimadzu Corp., Kyoto, Japan).
Substrate mineralisation was measured using a trace amount of14 C-labelled glucose according toBoddy et al. (2007). Glucose is a simple sugar common to DOC of most soils that demonstrates functional re-dundancy because it can be utilised by a large number of different microorganisms (Marschner and Kalbitz, 2003;Dungait et al., 2011). Briefly, 35 g of pre-incubated (24 h, 10 °C) sieved soil from each depth was placed in a sealed 50 ml polypropylene container and 0.5 ml of 0.5 mM, 1 kBq,14C-U-glucose was injected onto the soil surface of each sample (18μg glucose-C; approximately 1% of the average soil solution glucose concentration of 38.5μM; Amersham Biosciences UK Ltd, Chalfont St. Giles, UK). 1 ml of 2 M sodium hydroxide (NaOH) in a 1.5 ml microfuge tube was placed in the container to absorb any14CO2 produced, with the microfuge replaced at 0.5, 1, 2, 4, 7, 11, 22, 34, 50, 95, 171, 272, 363 and 696 h to enable14CO
2production to be evaluated over 29 days. The14CO2in the 2 M NaOH traps was determined by liquid scintillation counting using a Wallac 1404 scintillation counter (Wallac EG&G, Milton Keynes, UK) and Optiphase 3®alkali-compatible scintillationfluid (Wallac EG&G).
2.5. Statistical and data analysis
Statistical procedures were undertaken using the software package SPSS v24 for Windows (SPSS Inc., Chicago, IL) and Microsoft Excel, withP< 0.05 used as the upper limit for statistical confidence. Error is reported for average data with ± standard error of the mean (SEM). Changes over depth for the background soil properties were analysed using Univariate GLM, with depth as afixed factor. To enable direct comparison between soil solution data and bulk soil analysis, soil so-lution concentrations were converted from mg l−1to mg g−1(mg l−1 data:Table S1). The effect of soil and soil solution chemical properties on microbial activity were analysed using stepwise multiple linear re-gression (MLR). In the MLR analysis, the primaryr2value denotes the bulk soil or soil solution property accounting for the majority of the variation in microbial activity, with each subsequentr2value denoting the improvement of the model fit with the additional soil property variable. Soil and soil solution parameters adding less than 5% increase in fit were excluded from the analysis. Data from both sites were amalgamated to provide an average for microbial activity for this lowland section of the river Culm.
Mineralisation data were analysed using Univariate GLM, with depth as afixed factor, to evaluate changes in microbial metabolism of glucose over depth. In the short term (< 48 h), glucose mineralisation in soil is typically biphasic (Boddy et al., 2007). However, long-term incubations typically exhibit a triphasic pattern (Glanville et al., 2016). In agreement with this, a triphasic equation bestfitted our experimental data (r2= 0.99), where substrate mineralisation was described by triple
first order decay equation:
S= [a1× exp(-k1t)] + [a2× exp(-k2t)] + [a3× exp(-k3t)] (1) WhereSis the total14C-label remaining in the soil,k1is the exponential coefficient describing the primary mineralisation phase–thefirst rapid phase of rapid14CO
2production is attributable to the immediate use of the substrate in catabolic processes (i.e. respiration) and approximate to the depletion rate from the soil;k2is the exponential coefficient de-scribing the second, slower mineralisation phase of14CO
2production (possibly attributable to the subsequent turnover of14C immobilised within storage pools in the soil microbial community); andk3the third and slowest phase (also attributable to the turnover of14C immobilised within the soil microbial community; necromass turnover; Glanville et al., 2016). The parametersa1,a2, anda3describe the size of pools associated with exponential coefficientsk1,k2andk3, andtis time. The half-life of C within poola1can be estimated using the equation:
t½= ln(2) /k1 (2)
(Paul and Clark, 1996). As discussed inGlanville et al. (2016), we do not know enough about the connectivity between poolsa1,a2anda3 so we are unable to calculate with certainty the half time for poola2 anda3. It is unlikely that the three pools are discrete and there are likely to be interactions between the pools; although the triphasic model is a very goodfit to the data, biological significance cannot be assumed. Turnover times of individual organisms for the processes represented in poola1(catabolic energy production) may overlap into pool a2 (sto-rage) for different organisms, which could affect parameter estimates for the size and turnover of separate pools. It is possible that the turnover of poolsa2anda3would have to metabolise through poola1 during turnover. Poola1is functionally distinct in that it is the rapid use of substrate for energy production, but there is large uncertainty for poolsa2anda3. To enable an estimation of the C use efficiency, the amount of substrate immobilised or sequestered in the soil can be cal-culated from the amount of14C immobilised relative to the total14C added via the equation (Jones et al., 2012):
3. Results
3.1. Variation in soil properties at different depths in the soil profile
Soil total C and N content declined exponentially with increasing depth. All deep subsoil samples (> 1.0 m) were statistically similar to each other, but topsoil, subsoil and deep subsoil were significantly different (Table 1;r2= 0.86 for both C and N content,Fig. S2). Total C had an 18-fold reduction from topsoil to the average deep subsoil (41.4 ± 2.8 g C kg−1at 0–0.2 m to 2.4 ± 0.3 g C kg−1at 1.0–3.0 m), and total N a 13-fold reduction (0.0–0.2 m: 4.3 ± 0.3 g N kg−1 to 1.0–3.0 m: 0.3 ± 0.02 g N kg−1). In accordance withKemmitt et al. (2008b), total N was linearly correlated to total C (r2= 0.99). Particle size analyses of silt and clay also were significantly different over depth (P< 0.05,Table 1), with a weak linear decline over depth (r2= 0.28 for silt andr2= 0.20 for clay,Fig. S2). pH did not vary significantly, with an average pH of 5.1 ± 0.1. Ptotaland Porganicalso declined ex-ponentially with depth (Table 1) with Ptotaldeclining from 1.1 ± 0.1 to 0.25 ± 0.02 g P kg−1(r2= 0.70;Fig. S2); and P
organicfrom 0.7 ± 0.1 to 0.1 ± 0.02 g P kg−1(r2= 0.75,Fig. S2).
There was a significant linear correlation between total C compared to Ptotaland calculated Porganic, with a similar correlation observed for N in these riparian soils (Table 1; r2= > 0.80 for N and C,Fig. S3). Ratios of C:N, C:Ptotal and N:Ptotal linearly declined with increasing depth (Table 2;r2= 0.34–0.44,Fig. S2). C and N had a weak linear response to Pinorganic(r2= < 0.15,Fig. S4). The intercept of the linear regression to total C of 0.152 was comparable to the average Pinorganic content below 0.2 m (Fig. S3; 0.17 ± 0.02 g P kg−1and median value for soils < 0.2 m = 0.16). This indicates a consistent background level of Pinorganic from the soil parent material, with additional Pinorganic in the topsoil. Ratios of C:Porganicand N:Porganicdemonstrated no statisti-cally significant variation over depth (C:Porganicmedian value: 53.6 and
N:Porganicmedian value: 6.6). The reciprocal value of the gradient of C vs. Porganic(63.7) and N vs. Porganic(6.8) both gave similar values to the median ratios for C:Porganic and N:Porganic. The outlying data points containing low Porganicare both from cores in recent cut-offs, which contained greater sand concentrations, and therefore could be an ar-tefact of deposition (Fig. S3).
DOC and DON concentrations in soil solution decreased ex-ponentially with increasing depth, following a similar pattern to total C and N. Deep subsoil (1.0–3.0 m) samples were found to have no sig-nificant difference from each other, but were significantly different from topsoil and subsoil samples (Table 1; DOC: r2= 0.53, DON: r2= 0.63;Fig. S2). However, the rate of decline of DOC was less than for total C, having a 5-fold reduction in DOC (0.0–0.2 m: 15.3 ± 0.3 mg C g−1 to 1.0–3.0 m: 3.4 ± 0.4 mg C g−1). DON was linearly correlated to DOC (r2= 0.79). DOC demonstrated linear cor-relations to total C (r2= 0.51;Fig. S4), SMB (r2= 0.50;Fig. S4), basal respiration (r2= 0.96; Fig. S4) and NO3−(r2= 0.32;Fig. S4). NO3− and Pwateralso declined exponentially over depth, with very low NO3− concentrations below 1 m (< 0.4 mg N g−1, decreasing from 12.6 ± 1.0 mg N g−1 in 0–0.2 m; Table 1; NO3− r2= 0.83, Pwater r2= 0.71;Fig. S2). NH
4+and glucose concentrations did not change significantly over depth (Table 1).
3.2. Microbial activity at different depths in the soil profile
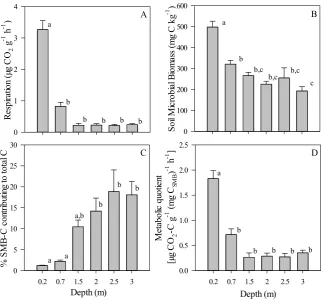
Background measurements of soil microbial activity from basal soil respiration, metabolic quotient (qCO2) and SMB-C content declined exponentially with depth (Fig. 2; SMB-C: from 498 ± 28 to 193 ± 20μg C g−1, r2= 0.67; respiration: from 3.3 ± 0.3 to 0.2 ± 0.03μg CO2g−1h−1, r2= 0.76; and qCO2from 1.8 ± 0.2μg CO2-C g−1(μg CSMB)−1h−1to 0.3 ± 0.04μg CO2-C g−1(μg CSMB)−1 h−1,r2= 0.71). Deep subsoil was significantly different from topsoil, Table 1
Selected soil and soil solution properties over depth. Values represent means ± SEM (n > 6). The symbols * andNS(not significant) indicate the significant differences at theP< 0.05 level over depth, with superscript letters denoting the significant differences between depths.
Soil property Sample depth (m) Sig. Diff.
0.0–0.2 (n=12)
0.2–0.7 (n=12)
1.0–1.5 (n=10)
1.5–2.0 (n=10)
2.0–2.5 (n=6)
2.5–3.0 (n=6)
Silt (%) 67.84 ± 2.72a 68.63 ± 2.05a 56.69 ± 3.50a,b,c 52.82 ± 1.90b,c 47.22 ± 4.46c 60.27 ± 1.98a,b *
Clay (%) 15.48 ± 1.08a 16.15 ± 0.80a 12.53 ± 1.01a,b 12.71 ± 1.05a,b 9.46 ± 0.90b 13.26 ± 1.36a,b *
Moisture content (%) 32.77 ± 1.17a 22.51 ± 0.94b 21.40 ± 0.88b 15.19 ± 0.80c,d 18.32 ± 2.89b,c 12.70 ± 0.60d *
pH 5.06 ± 0.11 5.12 ± 0.12 4.64 ± 0.17 5.29 ± 0.37 5.50 ± 0.57 5.67 ± 0.36 NS
Total C (g kg−1) 41.36 ± 2.79a 16.59 ± 1.56b 2.97 ± 0.35c 2.32 ± 0.46c 2.85 ± 1.27c 1.23 ± 0.25c *
Total N (g kg−1) 4.27 ± 0.30a 1.86 ± 0.16b 0.39 ± 0.03c 0.31 ± 0.04c 0.36 ± 0.07c 0.29 ± 0.02c *
Total P (g kg−1) 1.05 ± 0.11a 0.44 ± 0.04b 0.23 ± 0.02b 0.20 ± 0.03b 0.21 ± 0.02b 0.25 ± 0.02b
Org. P (g kg−1) 0.69 ± 0.08a 0.30 ± 0.03b 0.05 ± 0.02c 0.06 ± 0.02c 0.02 ± 0.01c 0.05 ± 0.02c *
DOC (mg C g−1) 15.25 ± 1.83a 10.73 ± 2.08a,b 4.29 ± 0.69b,c 2.87 ± 0.37c 3.43 ± 1.02c 2.67 ± 0.94c *
DON (mg N g−1) 4.17 ± 0.62a 2.35 ± 0.45b 0.24 ± 0.12c 0.16 ± 0.07c 0.17 ± 0.11c 0.22 ± 0.19c *
Glucose (mg C g−1) 0.75 ± 0.10 0.51 ± 0.08 0.75 ± 0.15 0.62 ± 0.33 0.51 ± 0.17 0.19 ± 0.05 NS
PO4(mg P g−1) 0.26 ± 0.01a 0.18 ± 0.01b 0.15 ± 0.01b,c 0.11 ± 0.01c,d 0.13 ± 0.02c,d 0.10 ± 0.01d *
NO3−(mg N g−1) 12.61 ± 0.96a 5.18 ± 0.99b 0.28 ± 0.01c 0.21 ± 0.02c 0.38 ± 0.07c 0.37 ± 0.10c *
NH4+(mg N g−1) 0.19 ± 0.01 0.20 ± 0.07 0.13 ± 0.01 0.13 ± 0.02 0.14 ± 0.05 0.09 ± 0.02 NS
Table 2
Stoichiometric nutrient ratios in the riparian soil over depth. Values represent means ± SEM (n> 6). The symbols * andNS(not significant) indicate the significant differences at theP< 0.05 level over depth, with superscript letters denoting the significant differences between depths.
Sample depth (m) C:N C:Ptotal C:Pinorganic C:Porganic N:Ptotal N:Pinorganic N:Porganic
0.0–0.2 (n= 12) 9.7 ± 0.1a 43.7 ± 2.7a 142.5 ± 16.1a 71.9 ± 15.5 4.1 ± 0.5a 14.7 ± 1.7a 6.8 ± 1.6
0.2–0.7 (n= 12) 8.9 ± 0.2a 39.0 ± 3.8a,b 177.3 ± 23.0a 68.2 ± 15.2 4.4 ± 0.5a 20.5 ± 2.7a 7.5 ± 1.6
1.0–1.5 (n= 10) 7.6 ± 0.5a 15.4 ± 2.5c 20.1 ± 3.9b 88.8 ± 22.0 1.9 ± 0.4b 2.7 ± 0.5b 18.8 ± 5.7
1.5–2.0 (n= 10) 7.6 ± 1.0a,b 17.9 ± 5.0c 32.4 ± 10.3b 49.7 ± 10.2 2.1 ± 0.4b 3.7 ± 0.9b 6.1 ± 1.0
2.0–2.5 (n= 6) 7.8 ± 2.0a,b 19.3 ± 11.0b,c 19.3 ± 11.3b 74.2 ± 33.1 2.1 ± 0.7b 2.1 ± 0.7b 5.9 ± 2.1
2.5–3.0 (n= 6) 4.2 ± 0.6b 5.2 ± 1.1c 6.5 ± 1.5b 46.5 ± 20.1 1.2 ± 0.1b 1.5 ± 0.2b 5.7 ± 0.9
with the 0.2–0.7 m subsoil being a transitionary layer between topsoil and subsoil. Basal respiration, qCO2and SMB-C were linearly correlated to total C (r2= 0.80,r2= 0.76, andr2= 0.66 respectively;Fig. S4) and to total N (respiration:r2= 0.80, qCO2: r2= 0.76, and SMB-C: 0.65; Fig. S4). SMB-C also correlated linearly to basal respiration (r2= 0.62). The percentage contribution of SMB-C to total C increased ex-ponentially with increasing depth (Fig. 2;r2= 0.74, from 1.2 ± 0.1% in the topsoil to 18.1 ± 3.2% by 2.5–3.0 m). The 15-fold reduction in basal respiration from topsoil to deep subsoil was reduced in the me-tabolic quotient (respiration per unit of SMB) to a 6-fold reduction in the deep subsoil.
Microbial activity was further investigated by monitoring the evo-lution of14CO
2from the soil following addition of a tracer of14 C-U-glucose, which bestfitted a triphasic model for14CO2loss over the four-week incubation period at 10 °C (Fig. 3;Table 3). Average recovery of 14CO
2from the soil was similar at all depths (P> 0.05; 81 ± 2%). Mineralisation rates for thefirst phase (k1) of the triphasic metabolism of 14C-U-glucose decreased exponentially with increasing depth (r2= 0.55,Fig. S5). Turnover rates of glucose in the topsoil (0.0–0.2 m) being 2.0 ± 0.1 h, subsoil (0.2–0.7 m) 4.1 ± 0.6 h; and was slowest in the deep subsoil (1.0–3.0 m, no significant difference between deep subsoil samples) at 11.4 ± 1.7 h (Table 3; P< 0.001). The slower phase coefficients (k2andk3), attributable to the turnover of14C in-corporated into the SMB (describing the metabolism of metabolites, storage compounds, extracellular enzymes and necromass turnover) behaved differently over depth (Table 3). Second phase exponential coefficients (k2) were significantly different over depth and fitted a weak exponential decay curve, although there was greater variation in the deep subsoil (Table 3; r2= 0.34;Fig. S5). Extrapolating the rate calculation fort½gave an approximate residence time fork2of 16 h in the topsoil (0.0–0.2 m), increasing to 47 h in the deep subsoil (1.0–3.0 m). Third phase coefficient k3 demonstrated no significant difference over depth, with a median value of 0.0012 h−1(approx. 24 d).
The poolsa1,a2anda3associated with the exponential coefficients k1,k2andk3varied in their response over depth. The initial pool (a1; associated with immediate catabolic use) decreased with increasing depth, with a weak exponential decay curve fitting the data (a1: P= 0.05;Table 3;r2= 0.20:Fig. S5; from 0.0 to 0.2 m: 35.2 ± 1.9% to 1.0–3.0 m: 23.7 ± 2.1%). Poola2demonstrated no significant dif-ference over depth (averaging 29.6 ± 1.0%; P> 0.05). The final proportion of14C allocated in the triphasic model to poola3increased linearly with increasing depth, with a greater proportion of14C allo-cated to the deep subsoil (Table 3;P= 0.007;r2= 0.26:Fig. S5; from Fig. 2.Indicators of microbial activity from (a) basal respiration, (b) Soil Microbial Biomass (SMB-C) con-tent, (c) % contribution of SMB-C to total C and (d) metabolic quotient for the lowland river Culm grassland soil over a depth of 0–3.0 m; with letters denoting the significant differences between depths
(mean ± SEM; n= 12: 0.0–0.7 m, n= 10:
1.0–2.0 m,n= 6: 2.0–3.0 m).
Fig. 3.Mineralisation kinetics following the addition of14C-U-glucose to ri-parian soil, incubated at 10 °C for four weeks. Mineralised14CO
2was trapped in
2 M NaOH and the percentage of added14C remaining in the soil plotted over
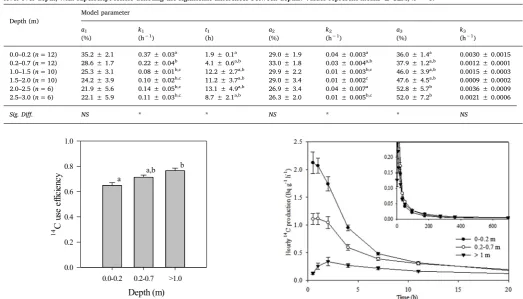
0.0 to 0.2 m: 33.0 ± 1.6% to 1.0–3.0 m: 48.9 ± 2.5%). The riparian soil varied in C use efficiency (CUE) over depth (Fig. 4), with CUE in-creasing with depth. However, depth was only significant when the soils were averaged over the three depths (topsoil, subsoil and deep subsoil), with a greater proportion of 14C immobilised at depth (0.0–0.2 m: 0.65 ± 0.02, 0.2–0.7 m: 0.71 ± 0.02, 1.0–3.0 m: 0.77 ± 0.02;P= 0.003).
Converting the production of14CO2from the riparian soils into an hourly rate per gram of soil enabled the rate of microbial response to 14C-labelled substrate addition to be investigated. The initial rate of production correlated linearly to the exponential coefficient for cata-bolic mineralisation (k1: Bq g−1h−1,r2= 0.72). The rate of production at the initial sampling period (0.5 h), over the 3 m soil profile, best
fitted an exponential decay curve with topsoil, subsoil and deep subsoil samples being significantly different (P< 0.001; Fig. 5; 0.0–0.2 m: 2.12 ± 0.19, 0.2–0.7 m: 1.11 ± 0.10, 1.0–3.0 m: 0.13 ± 0.02 Bq g−1 h−1; r2= 0.79,Fig. S5). Initial deep subsoil Bq g−1h−1production rates were 17 times smaller than the topsoil rate. However, when normalised for the quantity of SMB, the initial sampling period Bq g−1 h−1 mg−1 SMB-C production was only 7 times slower in the deep subsoil (0–0.2 m: 4.41 ± 0.51, 0.2–0.7 m: 3.51 ± 0.34, 1.0–3.0 m: 0.63 ± 0.13 Bq g−1 h−1 mg−1 SMB-C). Unlike topsoil and subsoil, deep subsoil achieved maximal Bq g−1 h−1production at 2 h rather than at the initial 0.5 h sampling (Fig. 5), with nearly 3 times greater rates of production at 2 h (an increase from 0.13 ± 0.02 to 0.34 ± 0.08 Bq g−1h−1). Topsoil and subsoil production rates were statistically similar after 4 h, with significantly reduced deep subsoil
(> 1.0 m) production rates (P< 0.001). After 22 h subsoil (0.2–0.7 m) production rates were in excess of the topsoil, however this was not significantly different until sampling at 95 h (P< 0.03). After 173 h the rate of production in the deep subsoil exceeded that of the topsoil and subsoil (0.0–0.7 m), although only the topsoil had significantly smaller Bq g−1h−1production rates (P< 0.03).
3.3. Influence of selected soil properties on microbial activity
Microbial activity (as measured by basal respiration; SMB; miner-alisation rate constantsk1,k2andk3; and rates of14CO
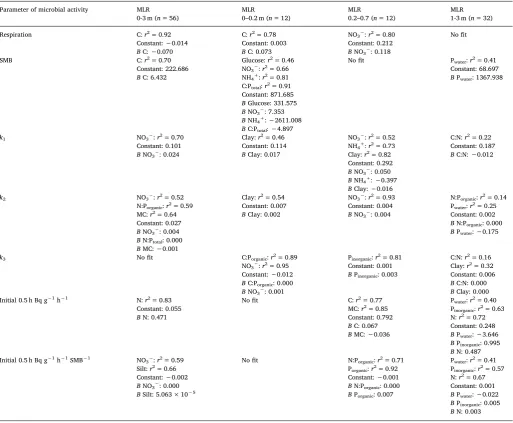
2production (Bq g−1h−1or Bq g−1h−1μg−1SMB-C) was compared with the measured soil and soil solution chemical parameters (Table 1) using MLR analysis (Table 4). Over the whole profile the majority of the variation in mi-crobial activity could be explained by the total C, N and NO3− con-centrations in the soil (respiration–C:r2= 0.92; SMB-C–C:r2= 0.70; k1–NO3−:r2= 0.70;k2–NO3−:r2= 0.52; initial Bq g−1h−1–NO3: r2= 0.83 and initial Bq g−1h−1SMB−1–NO
3−:r2= 0.59), with the exception of k3 where there was no fit to the chemical properties. N:Porganicratios, MC and silt were secondary contributors improving the
fit in the model for microbial activity. Although the overall model monstrated no co-linearity, the individual components of C and N de-monstrated co-linearity in their effect. Throughout all MLR analysis, depth had no effect on microbial activity when compared to the other chemical properties.
MLR by depth increment yielded different results for topsoil Table 3
Parameters of the triple exponential equation describing the mineralisation of14C-U-glucose in soil solution in riparian soil, where the glucose14C is partitioned into
the respired C poola1, or the SMB poolsa2anda3. The half-life (t1) of the14C-U-glucose in soil solution poola1(defined as ln(2)/k1) and the rate constants (k2andk3)
for the turnover of C immobilised in the SMB pools (a2anda3) are given. The symbols * andNS(not significant) indicate the significant differences at theP< 0.05
level over depth, with superscript letters denoting the significant differences between depths. Values represent means ± SEM,n> 6.
Depth (m)
Model parameter
a1
(%)
k1
(h−1)
t1
(h)
a2
(%)
k2
(h−1)
a3
(%)
k3
(h−1)
0.0–0.2 (n= 12) 35.2 ± 2.1 0.37 ± 0.03a 1.9 ± 0.1a 29.0 ± 1.9 0.04 ± 0.003a 36.0 ± 1.4a 0.0030 ± 0.0015
0.2–0.7 (n= 12) 28.6 ± 1.7 0.22 ± 0.04b 4.1 ± 0.6a,b 33.0 ± 1.8 0.03 ± 0.004a,b 37.9 ± 1.2a,b 0.0012 ± 0.0001
1.0–1.5 (n= 10) 25.3 ± 3.1 0.08 ± 0.01b,c 12.2 ± 2.7a,b 29.9 ± 2.2 0.01 ± 0.003b,c 46.0 ± 3.9a,b 0.0015 ± 0.0003
1.5–2.0 (n= 10) 24.2 ± 3.9 0.10 ± 0.02b,c 11.2 ± 3.7a,b 29.0 ± 3.4 0.01 ± 0.002c 47.6 ± 4.5a,b 0.0009 ± 0.0002
2.0–2.5 (n= 6) 21.9 ± 5.6 0.14 ± 0.05b,c 13.1 ± 4.9a,b 26.9 ± 3.4 0.04 ± 0.007a 52.8 ± 5.7b 0.0036 ± 0.0009
2.5–3.0 (n= 6) 22.1 ± 5.9 0.11 ± 0.03b,c 8.7 ± 2.1a,b 26.3 ± 2.0 0.01 ± 0.005b,c 52.0 ± 7.2b 0.0021 ± 0.0006
Sig. Diff. NS * * NS * * NS
Fig. 4.Utilisation efficiency of 14C labelled substrate averaged over three
depths – topsoil, subsoil rooting layer and deep subsoil, values represent means ± SEM (n= 12: 0.0–0.7 m,n= 10: 1.0–2.0 m,n= 6: 2.0–3.0 m); with letters denoting the significant differences between depths.
Fig. 5.Production rate of14CO
2following the addition of14C-U-glucose for
(0–0.2 m), subsoil (0.2–0.7 m) and deep subsoil (1.0–3.0 m;Table 4). Topsoil (0.0–0.2 m) demonstrated the greatest difference from the overall soil profile model, with nofit for initial rates of production (Bq g−1h−1and Bq g−1h−1μg−1SMB-C). Fork1andk2, texture became a significant property (r2= 0.46 and 0.54 respectively). As for the overall MLR model, topsoil respiration rates were still strongly correlated to total C. In the subsoil (0.2–0.7 m) microbial activity parameters were dominated by NO3−, N and P content, in contrast to the importance of C in the overall model. NH4+, clay and MC were secondary variables, in the subsoil. However, there was nofit for SMB to the measured subsoil soil properties. Increased correlation with P and stoichiometric vari-ables were observed in the deep subsoil (> 1.0 m) for14C mineralisa-tion parameters and SMB. There was no fit for respiration with the measured deep subsoil properties.
4. Discussion
4.1. Deepfloodplain soils support a large microbial population
We tested the hypothesis that deepfloodplain soil systems support a relatively large microbial population and found that, as inRumpel and Kögel-Knabner (2010), SMB-C declined over depth (Fig. 6). However, the decline was not as rapid as previously reported for other non-ri-parian soils (Federle et al., 1986;Fontaine et al., 2007). Here, the po-pulation only decreased to approximately half of the surface popula-tion. Topsoil SMB-C concentrations (498μg g−1) in the lowland
floodplain of the River Culm was similar to the river bank SMB-C values of 518μg g−1inEttema et al. (1999)and 448μg SMB-C g−1inKirkby et al. (2013). As reported in other studies (both riparian and non-ri-parian), our results demonstrated a rapid decline of total C with soil depth, with 70% of total C found within the topsoil in thefirst metre (Bai et al., 2005;Walling et al., 2006;Torres-Sallan et al., 2017). C:N ratios also decreased with increasing depth, which is generally attrib-uted to increasingly processed and stabilised OM pool in the deeper soil Table 4
Multiple linear regression analysis of microbial activity versus selected soil chemical properties by depth, adjustedr2values, constant (slope of the regression) and
Beta values (gradient of the regression). The primaryr2value denotes the soil and soil solution property accounting for the majority of the variation in the parameter
of microbial activity, with each subsequent soil propertyr2value denoting the improvement of the modelfit with the additional variable. Soil and soil solution
parameters adding less than 5% increase infit were excluded from the analysis.
Parameter of microbial activity MLR 0-3 m (n= 56)
MLR
0–0.2 m (n= 12)
MLR
0.2–0.7 (n= 12)
MLR 1-3 m (n= 32) Respiration C:r2= 0.92
Constant:−0.014
BC:−0.070
C:r2= 0.78
Constant: 0.003
BC: 0.073
NO3−:r2= 0.80
Constant: 0.212
BNO3−: 0.118
Nofit
SMB C:r2= 0.70
Constant: 222.686
BC: 6.432
Glucose:r2= 0.46
NO3−:r2= 0.66
NH4+:r2= 0.81
C:Ptotal:r2= 0.91
Constant: 871.685
BGlucose: 331.575
BNO3−: 7.353 BNH4+:−2611.008 BC:Ptotal:−4.897
Nofit Pwater:r2= 0.41
Constant: 68.697
BPwater: 1367.938
k1 NO3−:r2= 0.70
Constant: 0.101
BNO3−: 0.024
Clay:r2= 0.46
Constant: 0.114
BClay: 0.017
NO3−:r2= 0.52
NH4+:r2= 0.73
Clay:r2= 0.82
Constant: 0.292
BNO3−: 0.050 BNH4+:−0.397 BClay:−0.016
C:N:r2= 0.22
Constant: 0.187
BC:N:−0.012
k2 NO3−:r2= 0.52
N:Porganic:r2= 0.59
MC:r2= 0.64
Constant: 0.027
BNO3−: 0.004 BN:Ptotal: 0.000 BMC:−0.001
Clay:r2= 0.54
Constant: 0.007
BClay: 0.002
NO3−:r2= 0.93
Constant: 0.004
BNO3−: 0.004
N:Porganic:r2= 0.14
Pwater:r2= 0.25
Constant: 0.002
BN:Porganic: 0.000 BPwater:−0.175
k3 Nofit C:Porganic:r2= 0.89
NO3−:r2= 0.95
Constant:−0.012
BC:Porganic: 0.000 BNO3−: 0.001
Pinorganic:r2= 0.81
Constant: 0.001
BPinorganic: 0.003
C:N:r2= 0.16
Clay:r2= 0.32
Constant: 0.006
BC:N: 0.000
BClay: 0.000 Initial 0.5 h Bq g−1h−1 N:r2= 0.83
Constant: 0.055
BN: 0.471
Nofit C:r2= 0.77
MC:r2= 0.85
Constant: 0.792
BC: 0.067
BMC:−0.036
Pwater:r2= 0.40
Pinorganic:r2= 0.63
N:r2= 0.72
Constant: 0.248
BPwater:−3.646 BPinorganic: 0.995 BN: 0.487 Initial 0.5 h Bq g−1h−1SMB−1 NO
3−:r2= 0.59
Silt:r2= 0.66
Constant:−0.002
BNO3−: 0.000 BSilt: 5.063 × 10⁻⁵
Nofit N:Porganic:r2= 0.71
Porganic:r2= 0.92
Constant:−0.001
BN:Porganic: 0.000 BPorganic: 0.007
Pwater:r2= 0.41
Pinorganic:r2= 0.57
N:r2= 0.67
Constant: 0.001
profile (Rumpel and Kögel-Knabner, 2010;Salomé et al., 2010;Kirkby et al., 2013;Gregory et al., 2016;Wordell-Dietrich et al., 2017).
The proportion of total C as SMB-C increased over depth from 1.2% in the topsoil to 14.6% in the deep subsoil (1.0–3.0 m;Fig. 6), which is substantially greater than the reported microbial quotient range of 0.3–7.0% of SOC (von Lützow et al., 2007; Brookes et al., 2008; Zehetner et al., 2009;Gonzalez-Quiñones et al., 2011).Chaopricha and Marín-Spiotta (2014)also reported an increasing microbial proportion of deep soil C as a consequence of soil burial occurring under a range of circumstances, e.g., erosion in sloping lands. This is in contrast to the analysis of arable soil profiles at Rothamsted byJenkinson et al. (2008) where the proportion of SOC as SMB decreased with depth. Kramer et al. (2013) linked declining SMB populations over depth with de-creased substrate quality. This may be less significant infloodplain soils where, even though the total C content declined to 6% of surface concentration, the regularflushing of recent DOC may enable the sur-vival of the large proportion of SMB in the subsoil, or mayflush topsoil SMB through the soil profile. DOC was measured at all depths in these
floodplain soils, with an increased proportion of total C as DOC with increasing depth, and not predominantly in the topsoil as reported in Qualls and Haines (1992)andvon Lützow et al. (2007). However, it cannot be ruled out that the presentation of DOC at all depths in this study may be an artefact of the extremely high levels of rainfall in SW England in 2008 driving increased flushing of DOC through the soil profile (Fig. 1;Met Office, 2017).
The DOC concentrations in the deep subsoil were comparable to that measured in lateral subsurfaceflow during winter in a managed grassland in SW England, reported bySandford et al. (2013; 5–23 mg C l−1). They proposed that the increased proportion of total C as DOC was due to the release of previously stabilised SOC or as novel inputs from leaching or sublateralflow.Wordell-Dietrich et al. (2017)determined that a greater proportion of the subsoil C was labile by measuring re-lative rates of mineralisation in soil from different depths. The SMB is often considered to be the main component of the active SOC pool in models of soil C dynamics and therefore an increase in labile C at depth may be coincident with an increased proportion of SMB (von Lützow et al., 2007). Furthermore,von Lützow et al. (2007)note that whilst labile C is often described as bioavailable, several studies describe the poor degradability of up to 40% DOC extracted from soils. Similarly, Jones et al. (2018) suggest that subsoil DOC accumulation is pre-dominantly highly processed, more recalcitrant DOC, recognised by relatively increased DOC:DON ratios in an arable subsoil. Keller and Bridgham (2007)indicate that aerobic conditions in wetlands can result
in a rapid loss of labile C, resulting in reduced substrate quality. DOC can also accumulate under anaerobic conditions where iron reduction has occurred in mineral soils, releasing C held in iron oxide complexes (Huang and Hall, 2017), which could be a factor in these deep subsoils during redox oscillations.
4.2. Contrasting microbial response to DOC over depth
We tested the second part of our hypotheses, i.e., that the relatively large SMB was metabolically alert and able to respond rapidly to sub-strate supply, by measuring basal respiration and the mineralisation of a trace amount of14C-glucose as a proxy for microbial activity in these deepfloodplain soils. Nearly all (95%) of the total respiration of the
floodplain soil occurred in the 0–0.7 m depth with a 15-fold reduction in respiration rates in the deep subsoil (similar to Jenkinson and Coleman, 2008). However, estimated microbial activity as qCO2was 7 times smaller in the deep subsoil. Microbial activity declined more ra-pidly than SMB concentration that indicated a 50% smaller microbial community size in deep soils compared to top soils, which is compar-able to the observations of phosphoplipid fatty acid (PLFA) abundance byFederle et al. (1986).Wordell-Dietrich et al. (2017)also reported, when basal respiration was normalised to total C (rather than mass of soil), respiration rates that were three times greater in the deep subsoil than the topsoil.Salomé et al. (2010)reported no signficant difference in respiration rates of soils from different depth horizons of an arable soil up to 1.0 m depth. These reports are contrary to the general theory of reduced microbial activity with depth in soils, suggesting that the controls on C mineralisation in deep soils are more complex than merely the size of the microbial population as a predictor of activity. Therefore, in hydrologically dynamic floodplain soils where regular inputs of up to 70 mg l−1DOC can occur, the long term activity of a smaller but highly responsive SMB may be preserved (Valett et al., 2005;Zehetner et al., 2009).
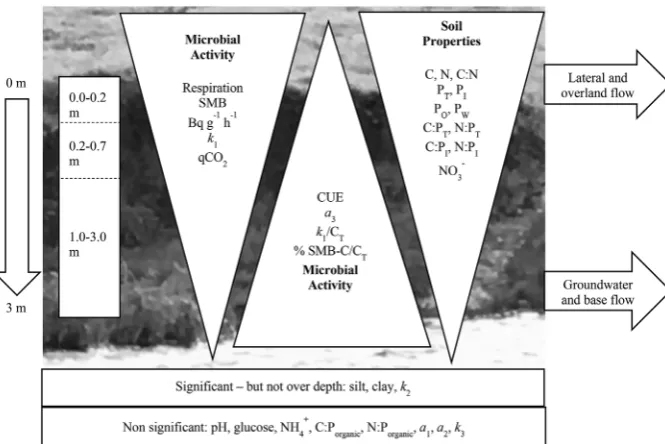
To further test our hypotheses, we utilised a 14C-labelled labile tracer (i.e., glucose) as a proxy for the potential turnover rates for DOC over depth infloodplain soils under aerobic conditions. The amount of glucose added was less than 1% of the average measured glucose con-centration of thefloodplain soils considered in this study, and as such was deemed not to be sufficient to be considered as a substrate amendment as the addition was well within natural concentrations (with glucose concentration having no significant difference over depth). This amount of C is also unlikely to stimulate microbial growth, thereby providing a more realistic estimate of microbial C use and Fig. 6.The variation in soil properties and microbial response to added14C-glucose over depth, with
tri-angles representing the reduction or increase in mi-crobial activity and soil parameters, adapted from (Marín-Spiotta et al., 2014). With surface soils con-taining elevated C, N and P and having greater mi-crobial activity as measured by respiration, mimi-crobial biomass, metabolic quotient (qCO2) and initial14CO2
mineralisation rate constantk1. Whereas deep
sub-soil demonstrated higher CUE and a greater propor-tion of total C consisting of SMB-C, with initial mi-neralisation fork1normalized by total C also having
partitioning. In addition, the glucose addition of 0.25μM was less than the reported concentrations of carbohydrates in stream DOC (i.e., 0.42–12.4μM; Gremm and Kaplan, 1998). However, unlike glucose, SMB, DOC and total C decreased over depth and therefore the ratio of glucose addition proportionally increased over depth compared to SMB, DOC and total C content. However, each variable increased at a dif-ferent rate (2-fold increase in glucose:SMB from topsoil to deep subsoil, 5-fold glucose:DOC, 28-fold glucose:total C). For this study we utilised a constant trace amount of glucose, but the implications of these chan-ging ratios is an area that warrants further study to investigate the impact of the proportional increase of14C-glucose at depth.
The SMB was highly responsive to the addition of14C-glucose at all depths, as described byKemmitt et al. (2008a)andJones et al. (2018). The rates of turnover for the topsoil (0.0–0.2 m;t½2.0 ± 0.1 h) and subsoil (0.2–0.7 m; t½ 4.1 h) were similar to previous grassland soil mineralisation experiments, where turnover times of 0.4–5.0 h for the initial catabolic respiration of added14C-glucose were reported (Jones et al., 2005; Boddy et al., 2007; Glanville et al., 2016).Jones et al. (2005)also observed slower mineralisation rates for14C-labelled amino acids (14 h) in a non-riparian soil compared to glucose (11.4 h) in the deepfloodplain subsoils of this study. While the size of the SMB-C as a proportion of total C indicated a relatively substantial soil microbial population at depth, its slower response to glucose addition suggests that it was limited by other factors, e.g., nutrient supply (Sanaullah et al., 2016). Although, when thefirst phase mineralisation rate con-stantk1was normalised for SMB there was no significant difference in
first phase mineralisation between the soil depths. However, as with basal respiration, when k1was expressed per unit of C content, rate constants were faster in the deep subsoil than topsoil (comparable to Heitkötter et al., 2017andWordell-Dietrich et al., 2017), and in these deepfloodplain subsoils the rate constants were 10 times faster. How-ever, we recognised that proportionally more14C-glucose was available to the SMB in the deep subsoil than the shallower soil depths, and this should be accommodated as a factor in future studies. Nonetheless, our study demonstrates that there are active microbial communities up to 3 m infloodplain soils which are capable of rapidly mineralising simple sugars, like glucose, that are universally ubiquitous in soil profiles.
Mineralisation dynamics of the14C-glucose in the deepfloodplain subsoil (1.0–3.0 m) were different compared to the topsoil and subsoil (0.2–0.7 m), with an observed lag time of 2 h to reach maximum mi-neralisation rates. Spatial separation from the added substrate due to the 50% reduction in population size in the deep subsoil makes it less likely for microorganisms to encounter added substrates (Dungait et al., 2012;Sanaullah et al., 2016). However, the 2 h lag time was faster than the previously reported 4 d lag period for deep (130–160 cm) but non-riparian subsoil after the addition of a more complex substrate (13 C-labelled root litter; Wordell-Dietrich et al., 2017), and very rapid compared with the 2–3 week lag time reported after addition of glucose to deep buried soil from a burial mound (Chaopricha and Marín-Spiotta, 2014). The relatively short lag period suggests that the SMB in
floodplain soils up to 3 m depth are adapted and able to respond rapidly to episodic inputs of DOC from vertical or lateralflushing. Sixty-four to 86% of the DOC pulse during soil inundation infloodplains originates from the upper layers of riparian soils (Morel et al., 2009), supplying a source of substrate that is likely to be of better quality, i.e. richer in organic nutrients, than in non-riparian deep soils. The fast turnover times and shorter lag periods in deepfloodplain soils suggests that the SMB are predominantly“metabolically alert”rstrategists rather than dormant K strategists, e.g., spore formers, as a survival strategy to compete favourably for episodic resource supply (Hoyle and Murphy, 2007;Hoyle et al., 2008;Dungait et al., 2011,2013). As labile C mi-neralisation occurs in both aerobic and anaerobic systems, with labile C often a preferential C substrate in anaerobic systems as well as aerobic, it is possible that a distinct microbial population may develop in sub-surface horizons (Chaopricha and Marín-Spiotta, 2014; Keller and Wade, 2018).
We observed that more14C was allocated to microbial storage in the subsoil (pool a3: 49% in deep subsoil compared to 36% in topsoil; Fig. 6) than to respiration (poola1: 24% of deep subsoil and 35% in topsoil). Furthermore, 19% of the14C label was unrecovered, and was most likely incorporated into the microbial biomass and synthesised into exuded microbial products, e.g., extracellular enzymes, and/or adsorbed onto soil minerals. In C-limited soils characteristic of deeper soils horizons, more C may be apportioned to synthesis (anabolism) and storage by microorganisms, whereas abundant C is predominantly mi-neralised (catabolism) in C-rich top soils (Raymond and Bauer, 2001; Hoyle et al., 2008). The former is likely the case in the relatively nu-trient poor deep subsoil, where microorganisms are more efficient at assimilating available substrate, detected as an increase of CUE as C:N decreases (Sinsabaugh et al., 2013). This is in contrast to Wordell-Dietrich et al. (2017)who determined reduced CUE in subsoils. We recognise that in our experiment, the same trace amount of14C-glucose was provided to the 50% smaller microbial population in the deep subsoil (based on SMB-C concentrations) as to the topsoil, which may be reflected in the observed increase in CUE at depth.
4.3. Microbial nutrient limitation in thefloodplain soil profile
The majority of soil properties declined significantly over depth and could be assigned into three depths with different characteristics: top-soil (0.0–0.2 m), subsoil (0.2–0.7 m), and deep subsoil (1.0–3.0 m). (pH did not vary over depth and it is unlikely that these soils were con-strained by acidity;Jones et al., 2018). Topsoil was characterised by elevated concentrations of C, N, P, DOC and DON. The subsoil (0.2–0.7 m) acted as a transitionary layer where deeper roots and root exudates delivered fresh C (Kramer et al., 2013;Chaopricha and Marín-Spiotta, 2014). The poor C content at depth may have been exacerbated by the relatively increased microbial activity due to real priming when supplies of biologically available C were abundant (Dungait et al., 2013), and may also drive the potential for anaerobic conditions to emerge due to increased biological oxygen demand when supply out-paces gas diffusion in these deep subsoils (Keiluweit et al., 2018).
Hill et al. (2014)andNg et al. (2014)discussed the importance of ecological stoichiometry of C:N:P in regulating microbial activity; and in these riparian soils the relationship of these three essential elements varied over depth (Fig. 6). Microbial activity in the deep subsoil was correlated with stoichiometry and P availability, whereas the overall profile MLR model was dependent on C, N and NO3−concentrations. According to stoichiometric decomposition theory, maximal decom-position rates occur when C, N and P match microbial requirements (Heitkötter et al., 2017). This condition was observed in the nutrient rich topsoil and, here, textural variation exerted significant control on variation on microbial activity (rate coefficientsk1andk2). Overall, the stoichiometry in thesefloodplain soils (median C:N:Porganicof 54:7:1) compared to reported values for SMB (60:7:1;Cleveland and Liptzin, 2007;Sinsabaugh et al., 2013), indicated that a large proportion of the SOC was derived from microbial detritus (Tipping et al., 2016). How-ever, the deep subsoil C:N ratio was below the microbial tissue quotient range of 7.3–8.6 reported inSandford et al. (2013), and the N:Ptotal values are less than the recorded N:P of the SMB of 6.9 reported in Cleveland and Liptzin (2007), suggesting the deep soils were nutrient limited. Consequently, additions of biologically available DOC during
flood events to nutrient-poor deepfloodplain soils may result in the loss of SOC as stabilised SOM is mined for limiting nutrients (Craine et al., 2007;Ng et al., 2014;Heitkötter et al., 2017).
increase. However, the same was not true for NO3−, where the pro-portion of total N held as NO3−declined 3-fold. The low levels of NO3− and proportional increase in NH4+could indicatefluctuating aerobic conditions with denitrification occurring during anaerobic decomposi-tion, with NO3− changed to NH4+ through anaerobic dissimilatory reduction, although the low available C concentrations may also limit these reactions (Keller and Bridgham, 2007;Ding et al., 2017).
The rapid response to14C-glucose without the addition of N or P also supports the suggestion that microbial activity in these subsoils are limited by access to biologically available C (Rumpel and Kögel-Knabner, 2010; Jones et al., 2018). This is also consistent with the decrease in C:N in the deep subsoil and the importance of C in the overall MLR model for respiration and SMB. Nevertheless, it is im-portant to note that this study was undertaken using aerobic laboratory conditions and therefore, it is important to consider this constraint when interpreting a deep profile subject to episodic inundation. It is acknowledged that further work should be undertaken to ascertain microbial activity under different redox conditions due to the changes in oxygen availability, e.g., during episodes of prolonged waterlogging common infloodplains. Although glucose added to peat and paddyfield soils under anaerobic conditions can be rapidly mineralised (Wang et al., 2015;Keller and Wade, 2018), it is likely that the C, N and P limitations observed in these aerobic conditions of our experiment would also be rate limiting in anaerobic systems (Hill et al., 2014). Therefore, notwithstanding the limitations of the approach, we consider these mineralfloodplain soils to show evidence of a versatile microbial community capable of adapting to aerobic and anaerobic conditions due to their potential to respond rapidly to substrate availability. With these data providing an important indicator of enhanced microbial activity in an environment often thought of as a sink for C due to the rapid accumulating nature of thefloodplain and low microbial activity expected at depth.
4.4. Conclusions
In accordance with our hypothesis we found a proportionally large and active SMB in the deep subsoil of thesefloodplain soils. Fifteen per cent of the total C measured in the deep subsoil was in the SMB, ex-ceeding the 1% usually typically reported for topsoils. The deep
floodplain soils supported a large microbial population with only a 50% reduction in SMB compared to a 94% reduction in total C. This could be a consequence of the regularflushing of DOC through the soil profile during inundation events and hyporheicflow or from the translocation of SMB duringflood events. We observed an active microbial popula-tion at all depths, however, the top soil and subsoil depths (0.0–0.7 m) had a contrasting mineralisation response to the addition of labile C (14C-glucose) compared to the deep subsoil (1.0–3.0 m), where a 2-h lag for maximal production of14CO
2was observed. This relatively short lag time indicates that the SMB in the deep subsoil remained metabolically alert to take advantage of episodic events of DOC abundance, but were restricted in their response by the likelihood of encountering substrate by a spatially dispersed and smaller microbial population. A greater proportion of the added 14C-glucose was calculated to have been in-corporated into the SMB in the deeper soil, with the turnover of C in pool a3approximating 24 d, indicating that there is the potential for labile C preservation within the SMB in deepfloodplain soils. Although
first phase mineralisation (k1) decreased with increasing depth, when normalised for the SMB content in the soil there was no significant difference between the soil depths. This indicates that microbial activity in the subsoil was limited by access to biologically available C and was capable of rapid mineralisation rates when conditions allowed access to supply. However, our hypothesis requires further testing under dif-ferent redox conditions and would benefit from identification of the microbial communities involved in the mineralisation of C in these systems to enable better understanding of the biological controls on C cycling infloodplain systems.
Data Access Statement
Data supporting this study are stored by the corresponding author at the University of Exeter.
Acknowledgements
This work was funded by the UK Natural Environment Research Council as part of the Impacts of Climate Change on Erosion, Sediment Transport and Soil Carbon in the UK and Europe project (NE/E011713/ 1). We thank Richard Jones and Neville England for assistance with the Geoprobe work; Stephen Haley and the technician team for their as-sistance with laboratory analysis at Exeter University; and Paul Hill, Jonathan Roberts and Gordon Turner for their assistance with labora-tory analyses at Bangor University. We thank Emilie Grand-Clement for her helpful comments on the manuscript, and Sophie Green and Andrew Meade for their statistical assistance. This work represents part of the BBSRC-funded programme‘Soil to Nutrition’(BB/P01268X/1) at Rothamsted Research.
Appendix A. Supplementary data
Supplementary data related to this article can be found athttp://dx. doi.org/10.1016/j.soilbio.2018.04.001.
References
Bai, J., Ouyang, H., Deng, W., Zhu, Y., Zhang, X., Wang, Q., 2005. Spatial distribution characteristics of organic matter and total nitrogen of marsh soils in river marginal wetlands. Geoderma 124, 181–192.
Beniston, J.W., Shipitalo, M.J., Lal, R., Dayton, E.A., Hopkins, D.W., Jones, F., Joynes, A., Dungait, J.A.J., 2015. Carbon and macronutrient losses during accelerated erosion under different tillage and residue management. European Journal of Soil Science 66, 218–225.
Boddy, E., Hill, P., Farrar, J., Jones, D., 2007. Fast turnover of low molecular weight components of the dissolved organic carbon pool of temperate grasslandfield soils. Soil Biology and Biochemistry 39, 827–835.
Bräuer, T., Grootes, P.M., Nadeau, M.-J., 2013. Origin of subsoil carbon in a Chinese paddy soil chronosequence. Radiocarbon 55, 1058–1070.
Brookes, P., Cayuela, M., Contin, M., De Nobili, M., Kemmitt, S., Mondini, C., 2008. The mineralisation of fresh and humified soil organic matter by the soil microbial bio-mass. Waste Management 28, 716–722.
Bullinger-Weber, G., Le Bayon, R.C., Thébault, A., Schlaepfer, R., Guenat, C., 2014. Carbon storage and soil organic matter stabilisation in near-natural, restored and embanked Swissfloodplains. Geoderma 228–229, 122–131.
Chaopricha, N.T., Marín-Spiotta, E., 2014. Soil burial contributes to deep soil organic carbon storage. Soil Biology and Biochemistry 69, 251–264.
Cleveland, C.C., Liptzin, D., 2007. C: N:P stoichiometry in soil: is there a“Redfield ratio”
for the microbial biomass? Biogeochemistry 85, 235–252.
Craine, J.M., Morrow, C., Fierer, N., 2007. Microbial nitrogen limitation increases de-composition. Ecology 88, 2105–2113.
Ding, B., Li, Z., Qin, Y., 2017. Nitrogen loss from anaerobic ammonium oxidation coupled to Iron (III) reduction in a riparian zone. Environmental Pollution 231, 379–386.
Downes, M., 1978. An improved hydrazine reduction method for the automated de-termination of low nitrate levels in freshwater. Water Research 12, 673–675.
Dungait, J.A.J., Kemmitt, S.J., Michallon, L., Guo, S., Wen, Q., Brookes, P.C., Evershed, R.P., 2011. Variable responses of the soil microbial biomass to trace concentrations of 13C-labelled glucose, using13C-PLFA analysis. European Journal of Soil Science 62, 117–126.
Dungait, J.A.J., Hopkins, D.W.H., Gregory, A.S., Whitmore, A.P., 2012. Soil organic matter is governed by accessibility not recalcitrance. Global Change Biology 18, 1781–1796.
Dungait, J.A.J., Kemmitt, S.J., Michallon, L., Guo, S., Wen, Q., Brookes, P.C., Evershed, R.P., 2013. The variable response of soil microorganisms to trace concentrations of low molecular weight organic substrates of increasing complexity. Soil Biology and Biochemistry 64, 57–64.
Ettema, C.H., Lowrance, R., Coleman, D.C., 1999. Riparian soil response to surface ni-trogen input: temporal changes in denitrification, labile and microbial C and N pools, and bacterial and fungal respiration. Soil Biology and Biochemistry 31, 1609–1624.
Federle, T.W., Dobbins, D.C., Thornton-Manning, J.R., Jones, D.D., 1986. Microbial biomass, activity, and community structure in subsurface soils. Groundwater 24, 365–374.
Fontaine, S., Barot, S., Barre, P., Bdioui, N., Mary, B., Rumpel, C., 2007. Stability of or-ganic carbon in deep soil layers controlled by fresh carbon supply. Nature 450, 277–280.
Giesler, R., Lundström, U., 1993. Soil solution chemistry: effects of bulking soil samples. Soil Science Society of America Journal 57, 1283–1288.