Article
An Automated IoT Visualization BIM Platform for
Decision Support in Facilities Management
Kai-Ming Chang1,*, Ren-Jye Dzeng2 and Yi-Ju Wu3
1 Department of Civil Engineering in National Chiao Tung University; [email protected] 2 Department of Civil Engineering in National Chiao Tung University; [email protected] 3 Department of Civil Engineering in National Chiao Tung University; [email protected] * Correspondence: [email protected]; Tel.: +886975-159-762
Abstract: Building information modeling (BIM) is the digital representation of physical and functional characteristics (such as geometry, spatial relationship, and geographic information) of a facility to support decisions during its life cycle. BIM has been extended beyond 3D geometrical representations in recent years, and now includes time as a fourth dimension and cost as a fifth dimension, as well as such other applications as virtual reality and augmented reality. The Internet of Things (IoT) has been increasingly applied in various products (smart homes, wearables) to enhance work productivity, living comfort, and entertainment. However, research addressing the integration of these two technologies (BIM and IoT) is still very limited, and has focused exclusively on the automatic transmission of sensor information to BIM models. This paper describes an attempt to represent and visualize sensor data in BIM with multiple perspectives in order to support complex decisions requiring interdisciplinary information. The study uses a university campus as an example and includes several scenarios, such as an auditorium with a dispersed audience and energy saving options for rooms with different functions (mechanical/electric equipment, classrooms, and laboratory). This paper also discusses the design of a common platform allowing communication among sensors with different protocols (Arduino, Raspberry Pi), the use of Dynamo to accept sensor data as input and automatically redraw visualized information in BIM, and how visualization may help in making energy-saving management decisions.
Keywords: building information modeling; industry foundation classes; internet of things; smart campus; environmental sensors; Dynamo
1. Introduction
With the advance of technology, data has grown exponentially during the past few years [1], which has spurred growing attention to data visualization in such fields as commercial finance, economics, and medical MRI applications, [2] etc. Data visualization allows the analysis and presentation of heterogeneous data in abstract form using computer graphics and interactive technologies [3]. In addition, data collection methods have evolved from traditional wired transmission to open wireless technologies such as RFID labels and embedded sensor and actuator nodes. Driven by the recent development of a variety of enabling wireless technologies, IoT has stepped out of its infancy, and is expected to be the next revolutionary technology that will create the fully integrated Internet of the future [4].
The Building Information Model (BIM) concept was originally introduced in the book "Building Product Models" by Eastman [5], which describes the basic concept of architectural information modeling, relevant model components, and information exchange. BIM is a smart model-based process that seeks to achieve such goals as decreasing project cost, increasing productivity and quality, and shortening project delivery time.[6] Thanks to BIM's simulation of architecture in a virtual environment, digital modeling, accurate inclusion of geometric shapes and related data, and support of design, procurement, production, and construction activities, this technology has become the focus of great attention in the fields of architecture, engineering & construction [7,8]. BIM is also
a common knowledge resource that can be used to share and provide reliable information on a facility throughout the building life cycle, and can be used to retain, transfer and re-apply information at all stages of the traditional building life cycle [9].
BIM is chiefly used to express elements / objects complying with specific information standards (such as Industry Foundation Classes, IFC). The IFC standard provides a logical hierarchy of building elements / objects through the definitions of various domains [10], and enables professionals to exchange information within the defined scope when they carry out feasibility studies, design or construction simulation, and operation [11]. The IFC data model is universal, designed to support the full range of modelling operations required by the construction industry, and allows the intuitively viewing of others' content in stereoscopic 3D [12]. As a result, it facilitates immediate and intuitive communication and discussion without need for abstract and specialized symbols, which can effectively reduce the occurrence of errors and flaws, and allow the quick resolution of disagreements and mistakes among professionals. As a consequence, BIM employing the IFC standard can minimize or eliminate costs and waste of time resulting from extensive rework.
BIM models are useful and effective in assessing the energy efficiency of buildings [13] through the use of design parameters associated with a model, such as the shape, orientation, materials, and windows of a building, as well as external environmental information concerning the building (such as sun location, solar radiation, temperature, and humidity). Thorough assessment and modification of an early design can accordingly result in a more comfortable built environment and energy savings [14].
While the BIM modeling technology encompasses building information and visualization, it lacks the means to incorporate information concerning the immediate environment into the model, and must be aided by a plug-in if it is to achieve the first step towards intelligent building. K.M. Kensek (2014) confirmed the effectiveness of the scripting language Dynamo as a parametric design tool in a case study, and successfully used data from Arduino environmental sensors (humidity, sunlight, and CO2) in the BIM model, while changing 3D model parameters [15].
M. Rahmani Asl et al. (2015) suggested that various simulation analysis data can serve as important design criteria references when designers are designing a building, and proposed and employed a BIM-based performance optimization (BPOpt) framework; this framework uses Dynamo to collect sensor data from buildings, and can optimize buildings' energy performance and spatial daylighting based on simulated environmental data [16].
Several researchers have attempted to integrate sensor information and BIM information such as visualizations ([17]) and building management systems ([18] and [19]). J.M.D. Delgado et al. (2018) [17] found that the data obtained from building structural health diagnosis could not be effectively and systematically integrated with other relevant monitoring data to support asset management, and proposed a dynamic parametric BIM approach that makes use of time-series sensor data to support data-driven and dynamic visualization. This approach involves the dynamic visualization of key structural performance parameters, and achieves real-time updating, long-term management of data, and model transformation via the IFC format, which serves to increase the value of data. J.I. Lather (2017) [18] developed a framework using three-dimensional spatial characteristics and sensor location data, and incorporated building management system (BMS) sensor data to make it easier for users and managers to perform facility management; a case study is employed to explore the use of data from various sensors in the operation phase. R. Mccaffrey (2015) [19] developed a web-based graphical user interface (GUI) integrating BIM with BMS data in order to help managers and users perform visual browsing of spatial data, and to make building performance information more readily acceptable by all building stakeholders, which will not only boost energy management awareness, but also support decision-making during the operation stage.
in which each individual building and its sensors are represented by BIM models that are able to exchange information with each other.
Many studies have found that the campus environment (including temperature, humidity, and air quality, etc.) can affect students' learning outcomes. In the wake of the emergence of the smart campus concept in recent years, this paper discusses the following three important issues involved in supporting the smart capabilities of a modern campus.
1. Modeling technology focusing on the establishment of a three-dimensional visualized models of buildings and their spaces, as well as the management of spatial element information.
2. Data integration focusing on the development of automated sensor data exchange between sensor data collection software (such as Firefly and Revit API), parametric design software (such as Dynamo and Grasshopper), and the BIM modeling platform (such as Autodesk Revit and Rhino)[15].
3. Visualized context-based decision support, which can use comfort index as a means of supporting decision making concerning temperature and humidity through visualization of sensor data on BIM.
2. Research Methodologies and Experimental Design
2.1. Parametric design-based approach
Dynamo is a procedural modeling tool developed by Autodesk, and is an open plug-in that runs on Revit. Users can use the Revit API to use individual objects or families of objects in the software to perform parametric object family operation. Object-based parametric modeling is the foundation of BIM technology [20], and Dynamo can be used to bring procedural information into the BIM environment. A designer can perform this independently by defining the building process and modifying various architectural components in Revit. Dynamo enables designers to set up automated computing processes or platforms through a node-based visual compilation interface, so that designers can perform data processing and correlate structural and geometric parameter controls [21].
Figure 1 shows our platform design, which consists of three parts. The first part consists of the automation platform and the second part performs visualization.
1. Actual buildings (campus): The campus includes buildings , and sensors and Arduino were deployed in indoor spaces to perform environmental data collection.
2. Virtual world (BIM model): After establishing a virtual 3-D space and sensor locations, we input real environmental data into the virtual environment through Firefly.
3. Parameterization: According to the decision goals of different situations, the operating rules of custom nodes were established using Dynamo.
Figure 1. Visualization framework.
The proposed platform includes four modules, i.e., sensor data collector, sensor data integration, parametric control mechanism, and visualization modules. Figure 2 shows the flow of data from generation by sensors to the visualization by the BIM model's interface. The first step is use of the Dynamo environment to establish an Arduino link. The second step is to set data visualization colors. The third step is to render the Graph and the 3D results of the Graph in the workspace. The last step is use of the Python programming language to conduct PMV analysis through the use of custom nodes.
2.2. Experimental Design
2.2.1 Scenario Assumptions
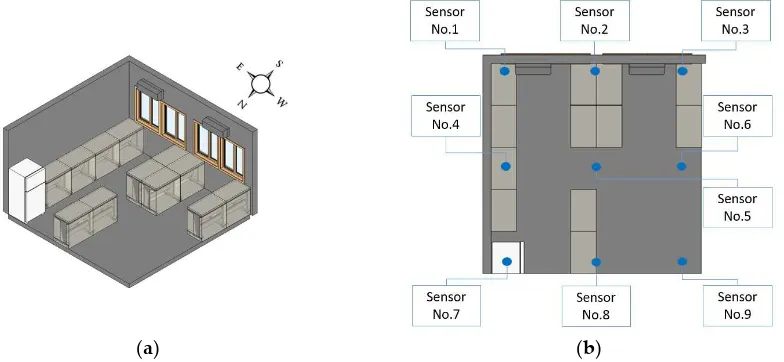
This study targeted student lectures in a typical classroom, and assumed that their comfort was only affected by the temperature and humidity at a height of 80cm-130cm above the ground (see Figure 3). Figure 4 shows how the planar space of the target classroom was divided into a grid to facilitate visualization. As the fineness of the grid for a given plane increases, the smoothness of visualization also increases, but at the cost of increased computing load. The sensors were installed in a total of nine locations along the edges and in the center and corners of the campus research laboratory for the purpose of the experiment.
Figure 3. Layout of experimental research environment
(a) (b)
Figure 4. (a) Diagram of environmental data body feeling range; (b) Diagram of cutting plane grid
2.2.2. Arduino micro-controller
This paper used the Arduino Mega 2560 R3 microcontroller board, which was connected to sensors (DHT-11) measuring the temperature and humidity of the indoor space (see Figure 6). The temperature and humidity measurement ranges and accuracy are as follows [22]:
1. Humidity measurement range: 20 ~ 90% RH. 2. Humidity measurement accuracy: ± 5% RH. 3. Temperature measurement range: 0 ~ 50°C. 4. Temperature measurement accuracy: ± 2°C. 5. Power supply range: 3 ~ 5V
(a) (b)
Figure 6. (a) Arduino Mega 2560 R3; (b) Arduino connection to DHT-11 temperature and humidity sensor.
2.2.3. Dynamo Automation Platform
This study used Dynamo to establish a temperature and humidity data automation platform. Arduino microcontrollers were used to collect temperature and humidity data in the classroom. The transmission interface established by this platform performed data processing and color spatial visualization, and it could automatically input data into the BIM model. The platform was established in the following four steps:
1. Use the Firefly suite to create a node linking Dynamo and Arduino, which formed a basis for interactive prototyping and importing environmental data into Dynamo (see Figure 7).
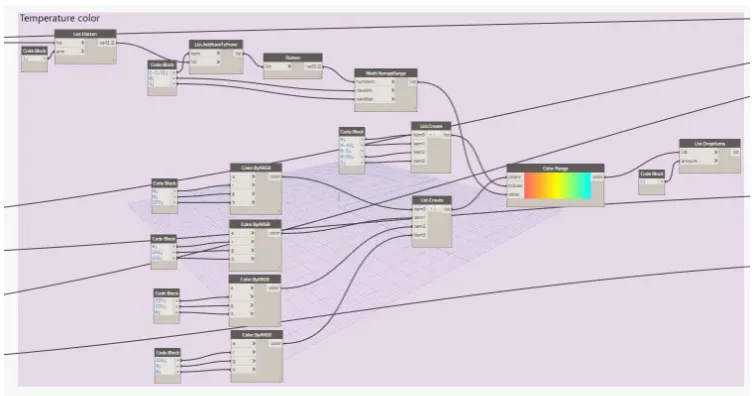
2. The interpolation method was used to calculate the value of each grid square, as shown in Figure 8. Temperature and humidity visualization and the RGB color rendering values of the grid squares are as shown in Figure 9.
Figure 8. Calculation of grid data by interpolation
Figure 9. Grid data and RGB conversion
3. Determination of cutting plane and adaptive element surface colors, and importing the BIM model for data visualization (see Figure 10).
4. Decisions concerning the indoor comfort pointer are based on predicted mean vote (PMV), and the results of analysis can be presented in the BIM model various this platform as shown in Figure 11. Note that PMV is a common metric for assessing the comfort level of an indoor environment, and has been adopted in ISO 7730[23].
Figure 11. PMV analysis and improvement suggestions
The PMV formula used in this study is shown in equations (1) to (4). When PMV = 0, the indoor environment is in the best thermal comfort state [24]. According to ISO 7730, an ideal PMV value is between -0.5 and + 0.5 [23]. PMV can be calculated based on factors including the body's metabolic rate and clothing insulation, as well as environmental parameters (air temperature, average radiant temperature, relative air velocity, and humidity). As illustrated in Figure 12, a PMV formula can be written in Python and nested in Dynamo to create a node for reading the PMV.
PMV = [0.303 · exp(-0.036·M)+0.028]·{(M-W)-3.05·10-3 · [5733-6.99(M-W)-Pa]-0.42[(M-W)-58.15
]
-1.7×10⁻⁵M(5867-Pa)-0.0014M(34-ta)-3.96·10-8 · fcl · [(tcl+273)4-(tr+273)4]-fcl·hc·(tcl-ta)}
(1)
Where
tcl = 35.7-0.028(M-W)-Icl{3.96·10-8·fcl[(tcl+273)4-(tr+273)4]+fcl·hc(tcl-ta)} (2)
hc = 2.38(tcl-ta)
0.25 for 2.38·|tcl-ta|0.25 > 12.1√va
12.1√va for 2.38·|tcl-ta|0.25 < 12.1√va (3)
Pa=RH×610.6e
17.260ta
273.3+ta (4)
M: metabolic heat rate, ranging from 46 to 232 (W/m2);
W: effective mechanical power (W/m2);
ta: air temperature(℃);
hc: convection heat transfer coefficient (W/m2K); tr: mean radiant temperature(℃);
va: relative wind speed (m/s);
Pa: water vapor partial pressure (Pa); RH: humidity (%).
Figure 12. Creating a PMV formula module in Dynamo
This study adopted the following values suggested by the Taiwan Central Weather Bureau [25] for the four parameters required in the PMV formula:
1. M was set as 70 (w/m2) because students mostly performed stationary tasks (such as typing on
laptop computers, reading, and writing) in the classroom.
2. W was set as 0 (W/m2) because assessment of indoor comfort is usually assumed to be 0 (W/m2).
3. Icl was set to 0.11 (m2k/W) because the experiment was conducted during the winter season, and
students usually wore long-sleeved clothing. 4. va was set to 0.1(m/s) for the wind speed in winter.
Table 1 shows the corresponding comfort level for each range of PMV values. Our platform allows users to visualize the distribution of comfort level for a space by calculating and colorizing the PMV values for each grid square based on the sensor data collected in the proximity of that grid square. Figure 13 shows the visualized result in the BIM.
Table1. PMV index and comfort table[24].
PMV index
-3
-2
-1
0
1
2
3
Comfortable
feeling Cold Cool
Slightly
cool Neutral
Slightly
Figure 13. PMV analysis results in the BIM model
3. Experimental Results
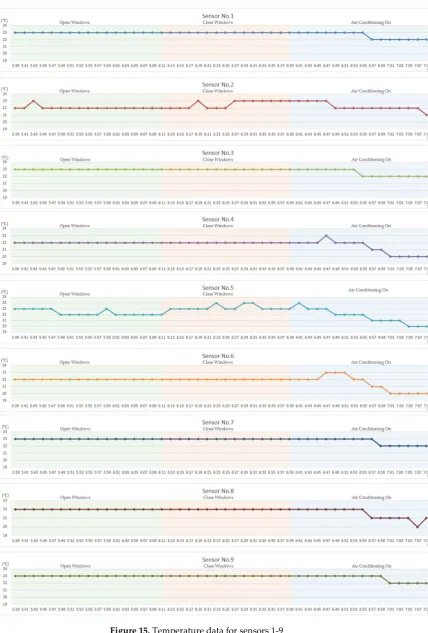
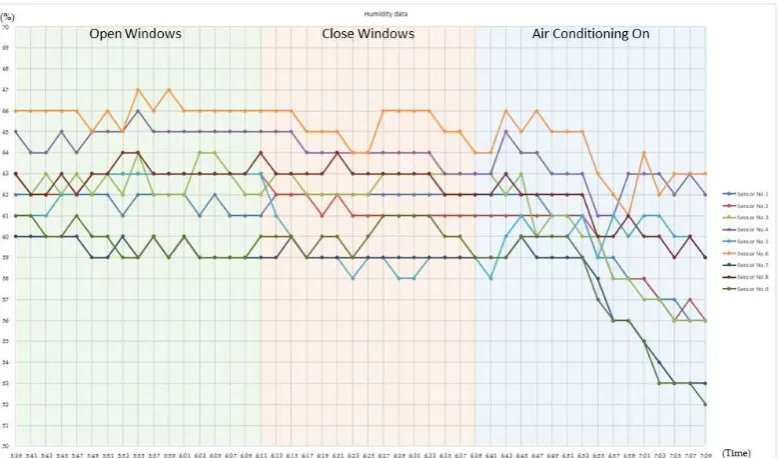
In this study, we collected data from a campus laboratory, and Figure 14 shows the laboratory's spatial layout and the location of the sensors. Figures 15 and 16 show sample temperature and humidity data for each two-minute interval during the two-hour period from 5:39 pm to 7:09 pm on December 30, 2017. Note that the windows were opened from 5:39 pm to 6:09 pm, and closed from 6:11 pm to 6:39 pm. The air conditioner was turned on with the windows closed from 6:41 pm to 7:09 pm.
(a) (b)
Figure 16. Humidity data for sensors 1-9
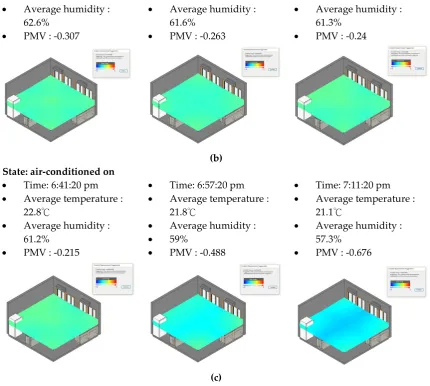
Figure 17 show snapshots of the visualized comfort level during different conditions, such as when the windows are open, windows are closed, and the air conditioning is on, with the corresponding comfort level and improvement suggestions made by the platform developed in this study shown by the side. The PMV value did not change significantly during the entire duration of the experiment, except when the air-conditioning was turned on, which resulted in a lower PMV value (-0.676) because the room became slightly colder. Nevertheless, small changes in the PMV value when the room went from the open-window (-0.309) to the closed-window state (-0.24) can still be observed. The greatest difference in PMV value occurred during the shift between the air-conditioned and closed-window states; both temperature and humidity apparently decreased as shown in Fig. 16, and the PMV value also decreased, as can be seen from the visualized color differences in Fig. 17.
State: open window
Time: 5:39:20 pm
Average temperature : 22.6℃
Average humidity : 62.7%
PMV : -0.257
Time: 5:51:20 pm
Average temperature : 22.4℃
Average humidity : 62.7%
PMV : -0.307
Time: 6:09:20 pm
Average temperature : 22.4℃
Average humidity : 62.3%
PMV : -0.309
(a) State: close window
Time: 6:11:20 pm
Average temperature : 22.4℃
Time: 6:25:20 pm
Average temperature : 22.6℃
Time: 6:39:20 pm
Average humidity : 62.6%
PMV : -0.307
Average humidity : 61.6%
PMV : -0.263
Average humidity : 61.3%
PMV : -0.24
(b) State: air-conditioned on
Time: 6:41:20 pm
Average temperature : 22.8℃
Average humidity : 61.2%
PMV : -0.215
Time: 6:57:20 pm
Average temperature : 21.8℃
Average humidity :
59%
PMV : -0.488
Time: 7:11:20 pm
Average temperature : 21.1℃
Average humidity : 57.3%
PMV : -0.676
(c)
Figure 17. (a) PMV visualized results for the open window state; (b) closed window state; and (c) air conditioning on state.
4. Discussion
The experiment was conducted during Taiwan's winter, and the results showed that differences in temperature and humidity were not apparent during a short period of time in this semi-tropical area. When the air conditioner was turned on, both the temperature and humidity appeared to decrease, but according to the PMV value, the room remained comfortable during all three states. In some cases, such as in a large space with limited number of air conditioners, the visualized comfort level may show an uneven distribution; in these cases the facility manager may choose to rearrange spatial usage by assigning the most comfortable area for use by activities and the less comfortable area for use for storage, which will maximize comfort for most occupants.
Regardless of the sensors' locations, whether the windows were opened or not did not affect the temperature and humidity data collected by the sensors. Although it can be seen from figures 14, 15, and 16 that sensors 1, 2, and 3 are three sensors closest to the windows, these sensors had almost the same temperature and humidity readings after the windows were closed.
against the wall, at the end of the air conditioners' air trail. Because the authors had expected that sensors 1 and 3 should have the largest drop due to being closest to the air conditioners, this finding was somewhat surprising. Determining the actual reasons for results of this type will require more precise experiments and more sensors. However, one possible explanation is that sensors 1 and 3, instead of being located directly on the dry air trail of the air conditioners, are actually located on the side of air conditioners' air trail, which decreased the effect of the humidity drop. On the other hand, although sensors 7 and 9 were furthest from the air conditioners, the drying effect may increase due to the accumulation of dry air against the wall.
5. Conclusions
This study proposed a platform for transforming sensor data to context-based visualized data (comfort level in this case) and presenting the results color visualization on a BIM model. Such visualization allows a facility manager to see the distribution of values from the perspective of the desired context, and thus make appropriate adjustments. In the future, our research project will continue to experiment with different types of spaces with different settings and use scenarios. In addition, we will also expand the platform's sensing capabilities to such other contexts as energy saving and lighting comfort. In the future, the platform will allow facility managers to see different color visualization schemes by switching between different contexts.
Author Contributions:Ren-Jye Dzeng developed the conceptual model. Kai-Ming Chang provided extensive technical support in the form of a survey of the literature and theoretical analysis. Yi-Ju Wu implemented the model and performed the experiment. Kai-Ming Chang and Ren-Jye Dzeng wrote the paper.
Acknowledgments: This study was funded by the Ministry of Science and Technology, Taiwan under contract number MOST 106-2622-8-009-017, for which the authors are deeply grateful.
Conflicts of Interest: The authors declare no conflict of interest.
References
1. McCormick, B. H. Visualization in scientific computing. ACM SIGBIO Newsletter, 1988, Volume 10(1), 15-21. 2. Schroeder, W. J.; Lorensen, B.; Martin, K. The visualization toolkit: an object-oriented approach to 3D graphics.
2004.
3. Munzner, Tamara. Process and pitfalls in writing information visualization research papers. Information
visualization. Springer Berlin Heidelberg, 2008, 134-153.
4. Gubbi, J.; Buyya, R.; Marusic, S.; Palaniswami, M. Internet of Things (IoT): A vision, architectural elements, and future directions. Future generation computer systems, 2013, Volume29(7), 1645-1660.
5. Eastman, C. M. Building Product Models: Computer Environments, Supporting Design and Construction, 1999. 6. Azhar, S.; Hein, M.; Sketo, B. Building information modeling: Benefits, risks and challenges. Proc., 44th
Associated Schools of Construction National Conference, Auburn, AL, 2008.
7. Azhar, S. Building information modeling (BIM): Trends, benefits, risks, and challenges for the AEC industry. Leadership and management in engineering, 2011, Volume 11(3), 241-252.
8. Eastman, C. M.; Eastman, C.; Teicholz, P.; Sacks, R. BIM handbook: A guide to building information modeling for owners, managers, designers, engineers and contractors. John Wiley & Sons, 2011.
9. Azhar, S.; Khalfan, M.; Maqsood, T. Building information modelling (BIM): now and beyond. Construction
Economics and Building, 2015, Volume 12(4), 15-28.
10. IFC2x4, Industry Foundation Classes Release 4 (IFC4). Available online: http://www.buildingsmart-tech.org/ifc/IFC4/final/html/index.htm (2013).
11. IAI. _2007_. IFC/ifcXML specifications. Available online: http://www.iai-international.org (Oct. 30, 2009). 12. Venugopal, M.; Eastman, C. M.; Sacks, R.; Teizer, J. Semantics of model views for information exchanges
13. Che, L.; Gao, Z.; Chen, D.; Nguyen, T. H. Using building information modeling for measuring the efficiency of building energy performance. In Proceedings of the International Conference on Computing in Civil and Building Engineering (ICCCBE), 2010, June, 165-170.
14. CHWIEDUK, D.A. Recommendation on modeling of solar energy incident on a building envelope,
Renewable Energy, 2009, Volume 34(3), 736-741.
15. Kitware. Kensek, K. M. Integration of Environmental Sensors with BIM: case studies using Arduino, Dynamo, and the Revit API. Informes de la Construcción, 2014; Volume 66, 536, e044.
16. Asl, M. R.; Zarrinmehr, S.; Bergin, M.; Yan, W. BPOpt: A framework for BIM-based performance optimization. Energy and Buildings, 2015, Volume 108, 401-412.
17. Delgado, J. M. D.; Butler, L. J.; Brilakis, I.; Elshafie, M.; Middleton, C. Structural performance monitoring using a dynamic data-driven BIM environment. Journal of Computing in Civil Engineering, 2018.
18. Lather, J. I.; Amor, R.; Messner, J. I. A Case Study in Data Visualization for Linked Building Information Model and Building Management System Data. In Computing in Civil Engineering 2017, 228-235. 19. MCCAFFREY, R.; Coakley, D.; Keane, M.; Melvin, H. Development of a Web-based BMS Data Visualization
Platform Using Building Information Models. In CIBSE 2015 Technical Symposium. 2015 20. Dynamo BIM. Available online: http://dynamobim.org/.
21. Shao-Chu, Huang. A BIM Workflow for Responsive Energy-Efficient Facade, Master's degree, National Cheng Kung University, 2016.
22. ARDUINO MEGA 2560 REV3. Available online: https://store.arduino.cc/usa/arduino-mega-2560-rev3. 23. ISO-7730, 2005. Ergonomics of the Thermal Environment — Analytical Determination and Interpretation
of Thermal Comfort Using Calculation of the PMV and PPD Indices and Local Thermal Comfort Criteria, third ed. ISO.
24. Fanger, P. O. Thermal Comfort: Analysis and Applications in Environmental Engineering. New York: McGraw-Hill Book Company, 1972; 244.