Worldwide Timing of Growth Faltering: Implications for
Nutritional Interventions
Roger Shrimpton, MSc, PhD*; Cesar G. Victora, MD, PhD‡; Mercedes de Onis, MD, PhD§; Rosaˆngela Costa Lima, MD, MSc‡; Monika Blo¨ssner, Dipl oec troph§; and Graeme Clugston, MD, PhD§
ABSTRACT. Objective. It is widely assumed that growth faltering starts at around 3 months of age, but there has been no systematic assessment of its timing using representative national datasets from a variety of countries.
Methodology. TheWorld Health Organization Global Database on Child Growth and Malnutritionincludes the results of 39 nationally representative datasets from re-cent surveys in developing countries. Based on these data, meanzscores of weight for age, length/height for age, and weight for length/height were compared with the National Center for Health Statistics and Cambridge growth references, for children younger than 60 months. Results. Mean weights start to falter at about 3 months of age and decline rapidly until about 12 months, with a markedly slower decline until about 18 to 19 months and a catch-up pattern after that. Growth falter-ing in weight for length/height is restricted to the first 15 months of life, followed by rapid improvement. For length/height for age, the global mean is surprisingly close to National Center for Health Statistics and Cam-bridge references at birth, but faltering starts immedi-ately afterward, lasting well into the third year.
Conclusions. These findings highlight the need for prenatal and early life interventions to prevent growth failure. Pediatrics 2001;107(5). URL: http://www. pediatrics.org/cgi/content/full/107/5/e75; growth, body height, body weight, infant nutrition disorders, child nu-trition disorders.
ABBREVIATIONS. UNICEF, United Nations Children’s Fund; WHO, World Health Organization; NCHS, National Center for Health Statistics; SD, standard deviation; NHANES, National Health and Nutrition Examination Survey; IMCI, Integrated Man-agement of Childhood Illnesses.
S
tunting affects 182 million (33%) and being un-derweight affects 150 million (27%) of the world’s children1; these are associated withover half of the 10 million annual deaths of children under 5 years.2 Developing countries account for
almost all of this burden, with 70% of all early child mortality and malnutrition concentrated in sub-Saharan Africa and South Asia. Despite setting a goal of reducing malnutrition by 50% at the World Sum-mit for Children,3 few countries in these 2 regions
will have been successful in achieving this goal by the end of the decade. It is our contention that one of the reasons for failure is the lack of clear definition and common understanding of what the problem is. The purpose of this article is to try to bring more clarity to these issues.
Waterlow4proposed a functional classification for
child malnutrition that separated children who had acute malnutrition from those with chronic malnu-trition. The acutely malnourished children were those with adequate height for age but inadequate weight for height (wasted). The chronically malnour-ished children were those that had inadequate height for age (stunted). Chronically malnourished children could also be acutely malnourished, in which case they would be both stunted and wasted. The Water-low Classification was called a functional classifica-tion, because it helped decide what interventions were needed by the children being surveyed. Stunted children need little attention, because stunt-ing cannot be reversed and they are in no immediate danger of dying. On the other hand, wasted children need urgent medical attention to prevent death.
The Waterlow classification was extremely useful for guiding curative interventions, but it did not indicate how the processes of becoming either stunted and/or wasted could be prevented, because it does not indicate when, what, and how the stunt-ing and/or waststunt-ing happens.5Neither does it
facili-tate understanding at what age actions might be taken to prevent child malnutrition from occurring. The Child Survival and Development Revolution, promoted by the United Nations Children’s Fund (UNICEF) during the 1980s, contributed to the mon-itoring of children’s growth becoming an almost uni-versal practice,6,7The objective of growth monitoring
is the early detection of growth failure, to allow timely remedial interventions and prevention of fur-ther growth failure. Several authors have suggested that growth faltering starts at about 3 months of life in developing-country settings,5,8,9,10However, most
such publications have looked only at weight growth, not height growth, and were not population-based studies of national scale. The present paper is the first attempt to investigate globally the patterns
From the *Nutrition Unit, UNICEF, New York, New York; the ‡Postgrad-uate Program in Epidemiology, Universidade Federal de Pelotas, Pelotas, RS, Brazil; and the §Department of Nutrition for Health and Development, World Health Organization, Geneva, Switzerland.
Dr Shrimpton’s current affiliation is with the Centre of International Child Health, Institute of Child Health, University College London, London, United Kingdom.
Received for publication Aug 30, 2000; accepted Nov 21, 2000.
Reprint requests to (C.G.V.) Postgraduate Program in Epidemiology, Uni-versidade Federal de Pelotas, CP 464, 96001-970, Pelotas, RS, Brazil. E-mail: [email protected]
and timing of growth faltering and to discuss impli-cations for developing interventions for prevention of child malnutrition worldwide.
METHODOLOGY
TheWorld Health Organization (WHO) Global Database on Child Growth and Malnutrition11 collates data from cross-sectional
an-thropometric surveys worldwide; 39 national samples from less-developed countries, each with ⬎500 children aged 0 to 23 months, were reanalyzed to provide information on meanzscores by month of age. Table 1 shows the datasets included in the analyses with the corresponding numbers of children, and the age ranges for which the data were available. All but 3 surveys pro-vided data from birth onward; 13 propro-vided data until age 35 or 36 months, 2 until 47 months, and the remaining 24 until 60 months. All surveys were conducted between 1987 and 1997.
For every age group in each national sample, the mean weight for age, length/height for age, and weight for length/height z scores were calculated using the National Center for Health Sta-tistics (NCHS) reference.12Mean weight for age and length/height
for agezscores were also calculated relative to the Cambridge reference,13resulting from criticisms of the NCHS growth curves.5
For each of 3 regions (Africa, the Americas, and Asia), the average value of the national means was calculated. The global average of all studies was also calculated.
RESULTS
The initial analysis consisted of plotting the mean zscores by age for each country dataset, against the NCHS growth reference. In general, the national curves had remarkably similar shapes within each of the regions of the world, although their relative po-sitions showed some variation (data available on request).
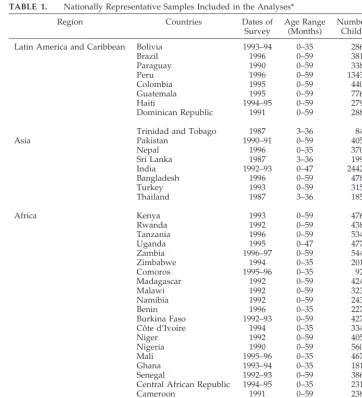
Figure 1 shows the global mean z scores, calcu-lated from the 39 national survey population sam-ples. At birth, the average weight for age, length for age, and weight for length are quite close to the NCHS reference. Growth faltering occurs thereafter, so that by 18 months the mean values of weight for age and length for age are between 1 and 2 standard deviations (SD) below the reference median value, while the mean weight for length is about⫺0.6 SD. The way the 3 indices behave during the first 3 months of life is different. Although weight for age stays horizontal and parallel to the reference for the first 3 months, length for age decreases. Conse-quently, the weight for length z score increases in this period. This observation raises the question of
TABLE 1. Nationally Representative Samples Included in the Analyses*
Region Countries Dates of
Survey
Age Range (Months)
Number of Children
Latin America and Caribbean Bolivia 1993–94 0–35 2860
Brazil 1996 0–59 3815
Paraguay 1990 0–59 3389
Peru 1996 0–59 13431
Colombia 1995 0–59 4408
Guatemala 1995 0–59 7768
Haiti 1994–95 0–59 2794
Dominican Republic 1991 0–59 2883
Trinidad and Tobago 1987 3–36 840
Asia Pakistan 1990–91 0–59 4056
Nepal 1996 0–35 3705
Sri Lanka 1987 3–36 1993
India 1992–93 0–47 24421
Bangladesh 1996 0–59 4787
Turkey 1993 0–59 3152
Thailand 1987 3–36 1857
Africa Kenya 1993 0–59 4763
Rwanda 1992 0–59 4386
Tanzania 1996 0–59 5344
Uganda 1995 0–47 4775
Zambia 1996–97 0–59 5443
Zimbabwe 1994 0–35 2014
Comoros 1995–96 0–35 921
Madagascar 1992 0–59 4240
Malawi 1992 0–59 3233
Namibia 1992 0–59 2430
Benin 1996 0–35 2273
Burkina Faso 1992–93 0–59 4278
Coˆte d’Ivoire 1994 0–35 3341
Niger 1992 0–59 4052
Nigeria 1990 0–59 5606
Mali 1995–96 0–35 4678
Ghana 1993–94 0–35 1818
Senegal 1992–93 0–59 3865
Central African Republic 1994–95 0–35 2310
Cameroon 1991 0–59 2380
Egypt 1995–96 0–59 9766
Morocco 1992 0–59 4532
Tunisia 1988 3–36 1996
why height growth is faltering when weight growth is apparently normal.
After the first 3 months, the falls in weight for age and length for age are similar until around 12 months of age, when weight for age stops decreas-ing, stabilizing at around ⫺1.4 SD. Length for age continues to fall through until 24 months of age. The increase at 24 months is artificial and caused by the disjunction of the 2 datasets used for the NCHS reference (Fels and National Health and Nutrition Examination Survey [NHANES]).5Ignoring the
dis-junction, mean length/height for age continues to decrease until around 40 months. This finding was confirmed when the data were plotted against the Cambridge reference (see below). The weight-for-length profile declines after 3 months to about⫺0.7z scores at about 18 months. Thereafter, it slowly in-creases to about⫺0.25 SD around 40 months of age, when it remains parallel to the reference profile. Data for 4- and 5-year-old children should be interpreted with caution because some of the datasets were re-stricted to children under 3 or 4 years.
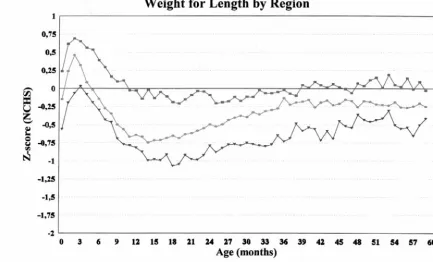
The behaviors of these 3 growth profiles shows that the processes of becoming stunted and of be-coming wasted are independent of each other. The process of stunting begins at birth and continues during the first 3 years of life. The process of wasting is concentrated in the period of 3 to 15 months. Thereafter, there is a process of gradual improve-ment in the wasting situation, so that by about 40 months there is little and the global mean is just 0.25 SD below the reference. However, the stunting that occurs in the first 3 years is not recovered thereafter. In Fig 2, the weight-for-age means for Africa, Asia, and the Americas are compared. The 3 profiles have similar shapes but start and finish at different levels
in relation to the reference. The lines are less steady after 36 months because they are based on fewer data points as some studies did not include 3- and 4-year-olds (Table 1). At 3 months, the Latin American and Caribbean meanzscore is about 0.25 SD above the African mean, which is about 0.5 SD above the Asian mean. All means drop sharply until about 10 months, but run roughly parallel to the reference or even catch up slightly after 12 months. The differences between the 3 regions that were present at birth remain throughout the first 5 years of life.
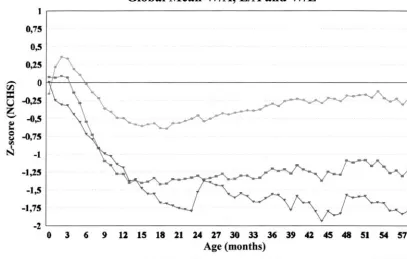
In Fig 3, the length/height-for-age profiles of the three regions are compared. Unlike weight, the mean length z scores at birth are very similar in all 3 regions and the same as the growth reference. In all 3 regions, the mean z score of length for age falls sharply from birth to about 24 months. The magni-tude of the drop in Latin America and the Caribbean is about ⫺1.25 SD, whereas in Africa and Asia the drop is⫺2 SD. Again, interpretation of the profiles is affected by the 24-month disjunction in the NCHS reference, but after the 24th month the process of stunting seems to continue, albeit at a much slower rate.
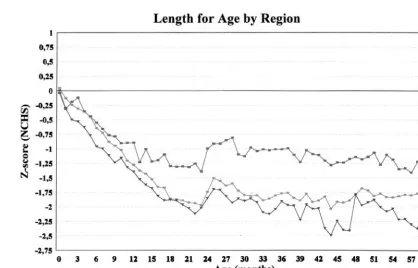
The process of wasting in the 3 regions is shown in Fig 4. At birth, Asian children are on average 0.4 SD below African children, who are in turn 0.4 SD below Latin American children. In each region the meanz score rises about 0.5 SD, reflecting the maintenance of weight growth (Fig 2) in the face of length falter-ing (Fig 3). From about 3 months of age, the meanz scores for weight for length fall in all regions—about
is about 0.25 SD thinner, and the Asian child about 0.75 SD thinner than the average Latin American and Caribbean child. A possible tendency toward over-weight children is observed in Latin America, where mean weight for height tends to be above the NCHS median after 39 months of age.
All analyses were repeated using the Cambridge reference (graphs available on request), but the con-clusions were not affected.
Differences in the faltering patterns for height for age and weight for age were highly consistent across countries. For the 35 countries with data from birth Fig 2. Mean weight-for-agezscores by age, relative to the NCHS reference, by region (0 –59 months).
onwards (Table 1), 32 had negativezscore changes in mean length for age from birth to 3 months. The average reduction was 0.37 zscore (SD⫽0.36). For weight for age, the average reduction was 0.07 z score (SD⫽ 0.36); 17 of the 35 countries had reduc-tions, and 18 had no change or increases.
DISCUSSION
This is the first attempt to investigate the timing of growth faltering on a global scale. The first striking finding was how similar the patterns of growth fal-tering were in different developing countries, not only within a region but also globally, despite the different instruments and measuring techniques used in the various surveys. A possible limitation is that although only nationally representative samples were included, data were not available for every country in each region, and thus the regional means are not necessarily representative. It was felt that weighting the results according to the country’s pop-ulations was not warranted, for the same reason, and also because similar shapes of curves were obtained from the different surveys.
The NCHS reference has been criticized for several reasons,5,14including its inappropriateness to reflect
the growth of breastfed infants and the 24-month disjunction. It is reassuring, however, that the anal-yses with both the NCHS and Cambridge references produced results that were very similar, with the exception of the artifacts resulting from the 24-month disjunction in the NCHS data.5
The use of data from 39 countries revealed inter-esting findings not apparent from previous analyses. The findings confirm the notion that, at the popula-tion level, wasting and stunting show different be-haviors,15a fact not widely appreciated in relation to
the timing of growth faltering. The findings also contradict common knowledge that faltering relative to international references starts at only about 3 months of age,5 because faltering in length starts
immediately after birth. This conclusion is supported by studies of the growth of individual children, showing that most of those malnourished at ages 3 to 5 years already presented anthropometric deficits at the end of the first year of life,16,17 Additional
re-search is needed to elucidate the reasons for the differences in the timing of height and weight falter-ing.
The importance of intrauterine growth retarda-tion18 on weight for age is evident. Because the
curves for the 3 regions have similar shapes but markedly different starting points, improvements in intrauterine growth per se can be expected to reduce the prevalence of underweight. The sharp faltering in the first year of life confirms the importance of concentrating preventive interventions at this age or earlier. Curative interventions, on the other hand, are still important for older children, who will make up the majority of those diagnosed with malnutrition in health facilities.
The fact that in the 3 regions mean birth lengths were very close and similar to the NCHS reference median was unexpected and merits additional inves-tigation. Accurate measurement of length is com-plex, but it is unlikely that errors would be sys-tematic in all studies. Some type of intrauterine programming of birth length seems to be present, so that adverse fetal conditions affect weight but not length. In at least 1 study prenatal interventions have been shown to affect postnatal growth19despite
hav-ing no effect on birth weight.20 Therefore, prenatal
The main priority should be the development of effective interventions to stop the remarkable falter-ing— upwards of 2 SD in Asia—that occurs from birth to 18 months. Interventions should be sustained until the third year of life because faltering continues until this age.
Faltering in weight for length or height shows a very different pattern. Starting at about 3 months, it stops around 12 months and is followed by a marked recovery, particularly in Africa. In Latin America and the Caribbean, the recovery phase leads to mean values above the NCHS reference at around 40 months, indicating a higher prevalence of over-weight. This is particularly worrisome because cor-onary heart disease seems to be particularly common among men who were thin at birth but whose weight caught up so that they had an average or above average body mass from age 7 years.21
It is unlikely that survival bias could explain the apparent catch-up in weight for length. First, preva-lences of wasting were low in many countries that showed this pattern—for example, in the Latin American countries wasting is typically between 3 and 5%,15and mortality between ages 1 and 4 years
is quite low. Second, it has been shown5that
weight-for-length curves are remarkably similar in shape across a wide range of wasting prevalences. The whole weight-for-length curve seems to shift and there is no evidence that its shape would change resulting from selective mortality of wasted chil-dren.
Community-based growth monitoring was the central plank of the child survival and development revolution promoted by UNICEF during the 1980s.6,7
The aim of growth monitoring is to weigh children and plot the weight on a growth chart to detect growth faltering early, allowing community workers to advise mothers on how to improve the growth of the faltering child. An evaluation of community-based growth monitoring programs in 6 countries in the early 1990s came to the conclusion that the weighing of children was often a mechanical act, which led to little action.22 Insufficient effort went
into training community workers. Growth monitor-ing has also been criticized for targetmonitor-ing all children under 5 years rather than being aimed at the first couple of years of life, when nutritional status is being determined.15
A somewhat different approach was adopted by the Integrated Management of Childhood Illness (IMCI) initiative. Promoted jointly by WHO and UNICEF, this is a broad strategy to reduce child mortality and morbidity in developing countries.23
IMCI recommends that all children be weighed and that their weight be plotted on the weight-for-age chart. This preference for assessing weight for age rather than assessing adequacy of growth velocity is based on the recognition that often the sick child who comes to a health facility has no previous weight with which to compare current status.
Based on our findings, monitoring length or height would be more relevant than weight monitoring for the assessment of nutritional status. However, there are obviously many issues related to the feasibility
and reliability of length measurement that would limit its wide adoption. Whatever the measurement being taken, growth monitoring constitutes primar-ily an individual-based, largely curative intervention in that it happens after the fact. Although it certainly has a role to play, the present results suggest that a preventive, population-based approach—aimed at improving the nutritional situation of affected pop-ulations rather than individuals24—would be more
desirable, with efforts directed primarily at mothers and young infants. Much more attention needs to be given to the prevention of low birth weight.
Our findings have important policy implications. The data show that interventions during the earliest periods of life—prenatally and during infancy and early childhood—are likely to have the greatest im-pact in preventing child malnutrition. Types of inter-ventions include culturally adaptable nutrition edu-cation on diet and feeding practices (with food supplementation if necessary), together with coun-seling on improved parental caring skills.25 Given
the complexity of the underlying and basic causes of the problem, new local specific efforts must be made to understand the specific economic, behavioral, di-etary, and other factors affecting child growth and development. A number of community-based pro-grams have had a substantial effect on declining child malnutrition rates.26,27 Wider application of
such programs is needed. Special effort should be made to improve the situation of women as primary child caregivers with particular attention to their health and nutrition throughout the life cycle. Simi-larly, a strong focus on complementary feeding and continued attention to the protection and promotion of breastfeeding remain key components for tackling the problem.
ACKNOWLEDGMENTS
This study was financed by the Nutrition Unit of UNICEF and by the Department of Nutrition for Health and Development of the World Health Organization.
We are grateful to Dr Allen Shoemaker for his assistance in the reanalysis of the national datasets.
REFERENCES
1. United Nations Administrative Committee on Coordination/Sub-Committee on Nutrition.Fourth Report on the World Nutrition Situation: Nutrition Throughout the Life Cycle.Geneva, Switzerland: United Nations Administrative Committee on Coordination/Sub-Committee on Nutrition; 2000
2. Pelletier DL, Frongillo EA, Habicht JP. Epidemiologic evidence for a potentiating effect of malnutrition on child mortality.Am J Public Health. 1993;83:1130 –1133
3. UNICEF.First Call for Children. Summit Declaration and Child Convention. New York, NY: UNICEF; 1990
4. Waterlow JC. Note on the assessment and classification of protein-energy malnutrition in children.Lancet. 1973;2:87– 89
5. World Health Organization. Expert Committee on Nutrition.Physical Status: Uses and Interpretation of Anthropometry. Geneva, Switzerland: World Health Organization; 1995. WHO Technical Report Series, Report No. 854
6. Cash R, Keusch GT, Lamstein J.Child Health and Survival: the UNICEF GOBI-FFF Program.Beckenham, England: Croom Helm; 1987 7. Morley D, Woodland M.See How They Grow: Monitoring Child Growth for
Appropriate Health Care in Developing Countries. London, United Kingdom: MacMillan Press; 1979
8. Waterlow JC, Thomson AM. Observations on the adequacy of breast-feeding.Lancet. 1979;2:238 –242
the breast-fed infant.Early Hum Dev. 1997;49(suppl):S157–S174 10. Beaton GH. Small but healthy: are we asking the right question?Eur
J Clin Nutr. 1989;43:863– 875
11. de Onis M, Blo¨ssner M. WHO Global Database on Child Growth and Malnutrition.Geneva, Switzerland: World Health Organization; 1997. Doc WHO/NUT/97.4
12. Hamill PVV, Hamill PVV, Drizid TA, et al.NCHS Growth Curves for Children Birth–18 Years. Vital and Health Statistics Series 11 No 165. Hyattsville, MD: USHEW-PHS; 1977. DHEW Publ. No. (PHS) 78-1650 13. Cole TJ, Freeman JV, Preece MA. British 1990 growth reference centiles
for weight, height, body mass index and head circumference fitted by maximum penalized likelihood.Stat Med.1998;17:407– 429
14. Victora CG, Morris SS, Barros FC, de Onis M, Yip R. The NCHS reference and the growth of breast and bottle-fed infants.J Nutr. 1998; 128:1134 –1138
15. Victora CG. The association between wasting and stunting: an interna-tional perspective.J Nutr. 1992;122:1105–1110
16. Huttly S, Victora CG, Barros FC, Vaughan JP. The timing of nutritional status determination: implications for intervention and growth moni-toring.Eur J Clin Nutr. 1991;45:85–95
17. Rivera J, Ruel MT. Growth retardation starts in the first three months of life among rural Guatemalan children.Eur J Clin Nutr. 1997;51:92–96 18. de Onis M, Blo¨ssner M, Villar J. Levels and patterns of intrauterine
growth retardation in developing countries. Eur J Clin Nutr. 1998; 52(suppl 1):S5–S15
19. Kusin JA, Kardjati S, Houtkooper JM, Renqvist UH. Energy
supplemen-tation during pregnancy and postnatal growth.Lancet. 1992;340:623– 626 20. Kardjati S, Kusin JA, De With C. Energy supplementation in the last trimester of pregnancy in East Java: I. Effect on birthweight.Br J Obstet Gynaecol. 1988;95:783–794
21. Eriksson JG, Forsen T, Tuomilehto J, Winter PD, Osmond C, Barker DJ. Catch-up growth in childhood and death from coronary heart disease: longitudinal study.Br Med. 1999;318:427– 431
22. Pearson R.Thematic Evaluation of UNICEF Support to Growth Monitoring. Working Paper Series No. 2. New York, NY: UNICEF; 1995
23. WHO. Division of Child Health and Development.The Management of Childhood Illness in Developing Countries: Rationale for an Integrated Strat-egy.Geneva, Switzerland: WHO (IMCI Information); 1997
24. Rose G. Sick individuals and sick populations.Int J Epidemiol.1985;14: 32–38
25. WHO.A Critical Link. Interventions for Physical Growth and Psychological Development. A Review. Geneva, Switzerland: World Health Organization; 1999. Doc WHO/CHS/CAH/99.3
26. United Nations Administrative Committee on Coordination/Sub-Committee on Nutrition (ACC/SCN). Managing Successful Nutrition Programmes.Geneva, Switzerland: United Nations Administrative Com-mittee on Coordination/Sub-ComCom-mittee on Nutrition; 1991. ACC/SCN State-of-the-Art Series Nutrition Policy Discussion Paper No. 8 27. United Nations Administrative Committee on
DOI: 10.1542/peds.107.5.e75
2001;107;e75
Pediatrics
Monika Blössner and Graeme Clugston
Roger Shrimpton, Cesar G. Victora, Mercedes de Onis, Rosângela Costa Lima,
Interventions
Worldwide Timing of Growth Faltering: Implications for Nutritional
Services
Updated Information &
http://pediatrics.aappublications.org/content/107/5/e75
including high resolution figures, can be found at:
References
http://pediatrics.aappublications.org/content/107/5/e75#BIBL
This article cites 15 articles, 3 of which you can access for free at:
Subspecialty Collections
http://www.aappublications.org/cgi/collection/breastfeeding_sub Breastfeeding
http://www.aappublications.org/cgi/collection/nutrition_sub Nutrition
sub
http://www.aappublications.org/cgi/collection/fetus:newborn_infant_ Fetus/Newborn Infant
following collection(s):
This article, along with others on similar topics, appears in the
Permissions & Licensing
http://www.aappublications.org/site/misc/Permissions.xhtml
in its entirety can be found online at:
Information about reproducing this article in parts (figures, tables) or
Reprints
http://www.aappublications.org/site/misc/reprints.xhtml
DOI: 10.1542/peds.107.5.e75
2001;107;e75
Pediatrics
Monika Blössner and Graeme Clugston
Roger Shrimpton, Cesar G. Victora, Mercedes de Onis, Rosângela Costa Lima,
Interventions
Worldwide Timing of Growth Faltering: Implications for Nutritional
http://pediatrics.aappublications.org/content/107/5/e75
located on the World Wide Web at:
The online version of this article, along with updated information and services, is
by the American Academy of Pediatrics. All rights reserved. Print ISSN: 1073-0397.