http://www.sciencepublishinggroup.com/j/ijctc doi: 10.11648/j.ijctc.20190701.21
ISSN: 2376-7286 (Print); ISSN: 2376-7308 (Online)
Synthesis and Characterization of Zn (II) and Mo (VI)
Complexes of Schiff Base Derived from
2-Hydroxy-4-Methoxyacetophenone
Hadiza Usman Abdullahi
1, *, Nuhu Abdullahi Mukhtar
2, Garba Yusuf Ali
2, Adamu Nadabo Panda
31
Department of Chemistry, Faculty of Science, Federal University, Dutse, Nigeria 2
Department of Chemistry, School of Science Education, Sa’adatu Rimi College of Education, Kumbotso, Nigeria 3
Department of Chemistry, Rabi’u Musa Kwankwaso College of Advance and Remedial Studies, Tudunwada Dankadai, Nigeria
Email address:
*
Corresponding author
To cite this article:
Hadiza Usman Abdullahi, Nuhu Abdullahi Mukhtar, Garba Yusuf Ali, Adamu Nadabo Panda. Synthesis and Characterization of Zn (II) and Mo (VI) Complexes of Schiff Base Derived from 2-Hydroxy-4-Methoxyacetophenone. International Journal of Computational and Theoretical Chemistry. Vol. 7, No. 1, 2019, pp. 100-106. doi: 10.11648/j.ijctc.20190701.21
Received: January 20, 2019; Accepted: April 12, 2019; Published: June 6, 2019
Abstract:
The four complexes of zinc (II) and molybdenum (VI) with Schiff base derived from acylhydrazones have been prepared and characterized by elemental analysis, IR, 1H-NMR, thermal analysis and molar conductance studies. Both the two free hydrazones (ligands) that were synthesized acts as a tridentate dianionic ONO donor towards the four complex centers. The conductance measurements in DMF of all the four metal complexes, suggest that they are non-electrolytes. Singlets found in the region 12-14 ppm of the free hydrazones indicates the present of iminol in solution. Also the NMR of zinc complexes was not as a result of its poor solubility. In the FTIR spectra of the free hydrazones, the bands due to carbonyl group were observed in the region 1630-1650cm-1 and these are absent in the spectra of the complexes suggesting enolization and deprotonation of ligands, whereas for the metal complexes, in compounds A and C broad bands observed at 3409 and 3417cm-1 indicates the present of lattice water. In the thermal analysis, there is a weight loss due to lattice in compound A and C.Keywords:
Schiff Base, Ligand, Complex, Molybdenum, Zinc1. Introduction
Coordinating complex or metal complex consists of a central atom or ion, which is usually metallic and is called coordination center, and surrounded by molecules or ions that are in turn known as ligands. For the formation of complex the central metal ion must have an empty orbital of suitable energy while the ligand must have a lone pair of electron [1]. Schiff base compounds are condensation products of primary amines and carbonyl compounds [2] and were discovered by a German chemist Hugo Schiff in 1864 [3-4]. Schiff base possess functional group containing carbon-nitrogen double bond with the nitrogen atom linked to an aryl or alkyl group, with the exception of hydrogen [5]. Schiff base ligands have played an essential role in the development of coordination chemistry [6] due to their ability to form a stable
their metal complexes have many applications in different fields Hydrazones, heteroaroyl hydrazones ligands and their metal complexes are biologically active [12]. Recently there has been a considerable interest in the coordination chemistry of transition metals especially, zinc and molybdenum with O-N donor hydrazone ligands because of their potential biological and pharmacological applications. Acylhydrazones and their transition metal complexes are very promising compounds in this field and their crystal structures and spectral investigations are well desirable. These metals (Zn (II) and Mo (VI)) have strong ability to form complexes with proteins, peptides, amino acids, hydrazones as well as other organic substances in the living organisms.
2. Materials and Methods
2.1. Chemicals and Solvents
Nicotinic acid hydrazide (Aldrich) and Benzhydrazide (Aldrich), MoO2(acac)2 (Aldrich) 2,2’bipyridine (LOBA
Chemie), 1,10-phenanthroline (LOBA Chemie) and Zn (CH3COO)2•2H2O (S. D. Fine) were used without further
purification. Solvents used were ethanol and methanol (Aldrich).
2.2. Physical Measurements
C, H, and N analyses were performed by Perkin-Elmer 2400 instrument. FT-IR spectra (4000-600 cm-1) as KBr discs of the samples were recorded on a JASCO-460 plus spectrophotometer. Electronic spectra were obtained using
a CECIL CE7400, 7000 SERIES, UV/VIS
spectrophotometer. Magnetic susceptibility was measured
with a Sherwood Scientific MSBMK1 sample
magnetometer with Hg [Co(SCN)4] as calibrant.
2.3. Syntheses of Ligands
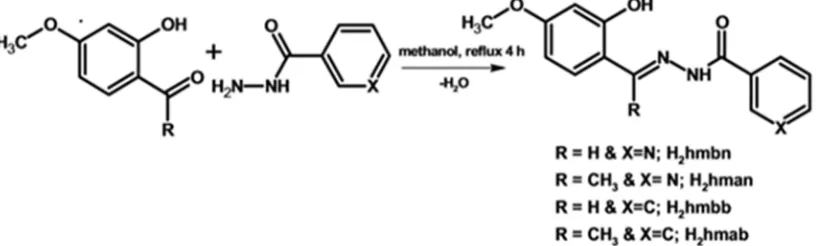
All the ligands and their complexes were synthesized using a standard procedure as report [13-14]. The scheme for the synthesis of acylhydrazones is shown in Figure 1 below.
Figure 1. Schematic representation of the syntheses of acylhydrazones.
2.3.1. 2-Hydroxy-4-methoxyacetophenone
Nicotinoylhydrazone (H2hman)
Nicotinic acid hydrazide (0.137 g, 1 mmol) dissolved in
methanol was refluxed with
2-hydroxy-4-methoxyacetophenone (0.166 g, 1 mmol) in methanol in presence of a few drops of glacial acetic acid for 4 hours. On cooling colorless needle shaped compound was separated. Yield 70%. Elemental Anal. Found (Calcd.) (%): C, 62.94 (63.15); H, 5.39 (5.30); N, 14.46 (14.73).
2.3.2. 2-Hydroxy-4-methoxyacetophenone
Benzoylhydrazone (H2hmab)
Benzhydrazide (0.136 g, 1 mmol) dissolved in methanol was refluxed with 2-hydroxy- 4-methoxyacetophenone (0.166 g, 1 mmol) in methanol in presence of a few drops of glacial acetic acid for 4 hours. On cooling colorless needle shaped compound was separated. Yield 68%. Elemental Anal. Found (Calcd.) (%): C, 67.25 (67.59); H, 5.61 (5.67); N, 9.68 (9.85).
2.4. Syntheses of Zinc (II) and Mo (VI) Complexes
[Zn(hman)]2•H2O (A): Zn (CH3COO)2•2H2O (0.219 g, 1
mmol) in methanol was added to the H2hman solution in
methanol (0.285 g, 1 mmol) and stirred for about two hours. The yellow product formed was filtered, washed with methanol, followed by ether and dried over P4O10 in
vacuo. Elemental Anal. Found (Calcd.) (%): C, 50.90 (50.37); H, 3.58 (3.94); N, 11.75 (11.75).
[Zn(hmab)]2 (B): Methanolic solutions of the H2hmab
(0.284 g, 1 mmol) and Zn (CH3COO)2•2H2O (0.219 g, 1
mmol) were mixed and stirred for about 2 hours. The product separated was yellow colored and it was filtered, washed with methanol, followed by ether and dried over P4O10 in vacuo. Elemental Anal. Found (Calcd.) (%): C,
54.89 (55.27); H, 3.59 (4.06); N, 7.9C9 (8.06).
[MoO2(hman)]2•H2O (C): To the H2hman solution in
methanol (0.285 g, 1 mmol), methanolic solution of MoO2(acac)2 (0.326 g, 1 mmol) was added. The resulting
solution has an orange color and it was refluxed for four hours. The orange colored product formed was filtered, washed with methanol, followed by ether and dried over P4O10 in vacuo. Elemental Anal. Found (Calcd.) (%): C,
42.85 (42.87); H, 3.20 (3.36); N, 10.17 (10.00).
[MoO2(hmab)]2 (D): Methanolic solutions of the
H2hmab (0.284 g, 1 mmol) and MoO2 (acac) 2 (0.326 g, 1
product separated was orange colored and it was filtered, washed with methanol, followed by ether and dried over P4O10 in vacuo. Elemental Anal. Found (Calcd.) (%): C,
46.14 (46.84); H, 3.32 (3.44); N, 6.86 (6.83).
3. Result and Discussion
3.1. Acylhydrazones Ligands
All the two acylhydrazones were synthesized in a very superficial and identical way and all the synthesized acyhydrazones act as tridentate ligands during the synthesis of their metal complexes
3.1.1. 1H NMR Spectral Studies
The 1H NMR spectrum of an organic compound
provides effective information concerning the number of different types of hydrogen present in the molecule, the relative numbers of the different types of hydrogen, the electronic environment of the different types of hydrogen and also the number of hydrogen ‘neighbor’ a hydrogen has. Here the 1H NMR spectra of the two hydrazones were taken in DMSO.
H2hman: In the 1H NMR spectrum of the compound,
OH and iminol protons gave sharp singlets at 11.43 ppm and 13.56 ppm respectively with a peak area corresponds to one each. These assignments are confirmed by D2O
exchange studies. During D2O exchange the intensity of
these peaks are considerably reduced. Here the methoxy protons gave a singlet at 3.78 ppm and the methyl protons show a singlet at 2.45 ppm. Here also the aromatic protons show multiplets in the region of 6-9.5 ppm. Figure 2 shows the 1H NMR spectrum of the compound.
Figure 2. 1HNMR Spectrum of H 2hman.
H2hmab: The 1H NMR spectrum of the compound is
shown in Figure 2 The singlet observed at 13.65 ppm is assigned to proton attached to iminol oxygen and singlet peak observed at 11.22 ppm is assigned to phenolic proton. Both of them have peak area corresponds to one. These assignments are confirmed by deuterium exchange studies.
Here the methoxy protons gave a singlet at 3.76 ppm and the methyl protons show a singlet at 2.43 ppm. Here also the aromatic protons show multiplets in the region of 6-8 ppm.
Figure 3. 1HNMR Spectrum of H 2hmab.
3.1.2. Infrared Spectral Studies
Figure 4. IR Spectrum of H2hman.
Figure 5. IR Spectrum of H2hmab.
provide valuable information regarding the structure. Table 1 lists the main vibrational bands of the hydrazones. In H2hmbn. H2O a band is observed at 3382 cm-1 which is due
to the presence of lattice water in the molecule. In the remaining compounds there are no bands in this region due to the absence of water molecules. In all the four hydrazones, a band observed around 3200 cm-1 is assigned to phenolic O─H and N─H groups gave bands around 3050
cm-1. A strong band is observed in between 1630-1650 cm-1 which indicates the presence of carbonyl group in these compounds. The azomethine bands are observed around 1600 cm-1 [15]. The C─O stretching is observed around 1275 cm-1. The N─N stretching vibrations are found in between 1110 and 1140 cm-1. Figures 4-5 show the infrared spectra of the four hydrazones.
Table 1. Selected IR frequencies (cm-1).
Ligand V (O-H) V (N-H) V (C=O) V (C=N) V (N-N) V (C-O)
H2hman. H2O 3219 3029 1638 1602 1135 1262
H2hmab 3326 3025 1650 1601 1127 1265
3.2. Zinc (II) and Molybdenum (VI) Complexes
3.2.1. Molar Conductivity
The experimental and calculated analytical data of all the four Zn (II) and Mo (VI) complexes are in close agreement. Magnetic susceptibility studies indicate diamagnetic nature of these complexes and it indicates the d10 outer electronic configuration of zinc, it is also an evidence for molybdenum is in +6 oxidation state. The molar conductivity measured for all the four complexes in 10-3 M DMF solution was found to be below 15 ohm-1 cm2 mol-1 which is much less than the value of 65-90 ohm-1 cm2 mol-1 obtained for a 1:1 electrolyte in the same solvent [16]. So the conductance measurements in DMF suggest that they are non-electrolytes. The Table 2 below present the molar conductivity measurement.
Table 2. Molar conductivity measurements.
A [Zn(hman)]2. H2O 10
B [Zn(hmab)] 09
C [MoO2(hman)]2. H2O 04
D [MoO2(hmab)]2 05
#molar conductivity (in mho cm2 mol-1) taken in 10-3 DMF.
3.2.2. Infrared Spectra
Significant IR spectral bands of the complexes are listed in Table 3. Free ligands show strong absorptions in the 1630-1650 cm-1 region which are assigned to carbonyl group, and bands due to azomethine group were observed around 1600
cm-1. In compound 4, broad bands were observed at 3409 and 3417 cm-1 due to lattice water. Coordination of hydrazones to the zinc ion through the azomethine nitrogen atom is expected to reduce the electron density in the azomethine link and thus, lower the v (C=N) absorption frequency. Hence this band undergoes a shift to lower wavenumber [16]. Also in complex 4, a lower shift is observed in v (C=N) absorption frequency indicates coordination of azomethine nitrogen to zinc. Coordination of azomethine nitrogen is also evident from the increase in N–N stretching frequency in all the complexes. In complex B, bands correspond to carbonyl groups are absent suggesting the enolization of ligands during complexation. But in compound A bands observed around 1645 and 3000 cm-1 are assigned to carbonyl group and NH group respectively, i.e in this complex, ligand is in the amido form. For the compound A, bands at 1600 and 1386 cm-1 correspond to symmetric and asymmetric vibrations of the acetate group are consistent with the presence of a unidentate acetate group [15]. In compound 3, a very intense band is observed at 1600 cm-1, is a combination band of v (C=N) and va (CH3COO) stretching frequencies.
For all the complexes, phenolic C–O stretching occurs at lower wavenumber when compared to that of the ligands indicating the deprotonation and coordination of phenolic OH. Appearance of new bands in the regions of 525-560 and 440-460 cm-1 are assignable to v (Zn–O) and v (Zn–N) respectively. The IR spectra of the complexes are shown in the Figures 6-7.
Table 3. Selected IR bands (cm-1) with speculative assignments of Zn (II) complexes (newly formed).
Ligand V (O-H) V (N-H) V (C=O) V (C=N) V (Zn--) V (Zn-N)
[Zn(hman)]2. H2O (A) 1597 1524 1161 1244 547 445
[Zn(hmab)]2 (B) 1593 1540 1150 1223 540 459
Table 4. Selected IR bands (cm-1) with speculative assignments of Mo (VI) complexes (newly formed).
Compounds V (C=N) V (C=N)2 V (N-N) V (C-O) V (Mo=O) V (Mo=OMo)
[MoO2 (hman)]2. H2O 1593 1532 1140 1249 913,942 854
Figure 6. IR-Spectrum of [Zn(hman)]2. H2O (A).
Figure 7. IR-Spectrum of [Zn(hmab)]2 (B).
Figure 8. IR-Spectrum of [MoO2(hman)]2. H2O (C).
Figure 9. IR-Spectrum of [MoO2(hmab)]2 (D).
3.2.3. 1H NMR Spectral Studies
In the case of diamagnetic Mo (VI) complexes the coordination of ligands to the metal centre is substantiated by
1
H NMR spectral studies of the ligands and complexes, in DMSO solution. Singlets found in the region 12-14 ppm due to iminol protons in free hydrazones were not found in the spectra of complexes indicate the coordination of iminol oxygen to metal center. Similarly singlets due to OH proton were found in-between 11 ppm and 12 ppm in free hydrazones were also absent in the spectra of complexes indicate the coordination of phenolic oxygen to metal centre. This leads to the conclusion that the hydrazones are coordinated in all the complexes in a dianionic form suggesting the ONO coordination to molybdenum. The singlets with an area integral of three in the range of 3-3.8 ppm indicate the presence of three methoxy hydrogens in free acylhydrazones were slightly shifted upon complexation. Multiplets for aromatic protons were found in the region 6-8 ppm in ligands do not show much shift in complexes. The 1H NMR spectra of the complexes are shown in the Figures 10-11.
Figure 10. 1HNMR Spectra of [MoO
Figure 11. 1HNMR Spectra of [MoO(hmab)] 2 (D).
3.2.4. Thermal Analyses
Figure 12. TG-DTG plot of [MoO2(hman)]2. H2O (C).
Figure 13. TG-DTG plot of [MoO2(hmab)]2 (D).
In complex A, there is a weight loss below 120°C indicating the presence of lattice water. Whereas in complex B, no weight loss is observed in between 50-250°C indicating absence of water molecules in this complex.
Above 400°C the complexes begin to decompose and the decomposition was not seen to be completed even at 1000°C.
In molybdenum, the complex C showed loss of weight corresponds to one water molecule in the temperature range 80-110°C indicate the presence of lattice water in this complex. Whereas complex D, showed no weight loss in the region below 250°C and this indicated the absence of water molecule. All the complexes decompose over 250°C. TG-DTG curves of the complexes are shown in Figures 12-13.
4. Conclusion
The four new complexes of zinc and molybdenum prepared using different acylhydrazones derived from 2-hydroxy-4-methoxyacetophenone were characterized. Both the two free hydrazones (ligands) that were synthesized acts as a tridentate dianionic ONO donor towards the eight complex centers. The conductance measurements in DMF of all the four metal complexes, suggest that they are non-electrolytes. Singlets found in the region 12-14 ppm of the free hydrazones indicates the present of iminol in solution. Also the NMR of zinc complexes was not as a result of its poor solubility. In the FTIR spectra of the free hydrazones, the bands due to carbonyl group are observed in the region 1630-1650 cm-1 and these are absent in the spectra of the complexes suggesting enolization and deprotonation of ligands, whereas for the metal complexes, in compounds A and C broad bands observed at 3409 and 3417 cm-1 indicates the present of lattice water. In the thermal analysis, there is a weight loss due to lattice in compound A and C.
References
[1] Ahmed B., Yammama S. G., Kamaladdeen A., Bashir S. S., Muhammad A. A. and Abdulmalik A. (2018). Synthesis, Characterization, and Antimicrobial study of metal (II) complexes of Barbituric acid. Being a paper presented at the 1st regional conference organized by Students' Chemical Society of Nigeria Northwest region, BUK, Kano, 23rd-26th, March, 2018.
[2] Ibrahim A. K., Yusuf B. A. and Sambo B. U. (2018). Synthesis, characterization and antimicrobial activity of mn (ii) Co (ii) and Ni (II) complexes with schiff base derived from 4 Chloroaniline and salicylaldehyde. Bayero Journal of Pure and Applied Sciences, 11 (1): 61-66.
[3] Ashraf, M. A.; Mahmood, K.; Wajid, A. (2011). Synthesis, Characterization and Biological activity of Schiff bases.
IPCBEE, (185) 10, 1-7.
[4] Brodowska, K.; Lodyga-Chruscinska, E. (2014). Schiff bases– interesting range of applications in various fields of science.
Chemik 68, 129-134.
[5] Kostova, I.; Sasa, l. (2013). Advances in research of Schiff-base metal complexes as potent antioxidants. Curr. Med. Chem, 20, 4609-4632.
[7] Natarajan, K., Jayalakrishnan C., and Karvembu R., (2002). Catalytic and antimicrobial activities of Ruthenium (II) unsymmetrical Schiff base complexes. Transition Metal Chemistry 27: 790-794.
[8] Muzammil k, Trivedi P. and Khetani D. B. (2015). Synthesis and characterization of Schiff base m-nitro aniline and their complexes. Research Journal of Chemical Sciences, vol. 5 (5), 52-55.
[9] Muhammad, A. S. And Shedewo, O. A. (2017). Synthesis, characterization and antibacterial properties of nickel (ii) schiff base complex derived from benzoin and oamino benzoic acid. Bayero Journal of Pure and Applied Sciences, 8 (1): 33-36.
[10] Wail al Z. Young G. K. (2016). Organometallic complexes of Schiff bases: recent progress in oxidation catalysis. Journal of Organometallic Chemistry, 822 (3) 173-188.
[11] Siraj I. T. And Sambo B. U. (2017). Synthesis, Characterization and antimicrobial activities of Schiff base derived from Thiourea and Anisaldehyde and its Mn (II), Fe (II) And Co (II) complexes.
Bayero Journal of Pure and Applied Sciences, 11 (1): 20-24.
[12] Nagar R. (1990). Syntheses, Characterization, and Microbial activity of some transition metal complexes involving potentially active O and N donor heterocyclic ligands. Journal of Inorganic and Biochemistry, 340: 349.
[13] Murthy, A. S. N. and A. R. Reddy, 1981. Electronic absorption spectroscopic studies of enolimine-ketoamineequilibria in Schiff bases. Journal of Chemical Sci., 90: 519-526.
[14] Shahriar Ghammamy and Sajjad Sedaghatb (2013). Preparation and Characterization of Co (III) and Ni (II) Complexes of the New Chiral Schiff Base (z)-1-(Pyridine-2-Ylmethylene) Thiosemicarbazide. Middle-East Journal of Scientific Research 13 (9): 1213-1216.
[15] Nakamoto K. (1997). Infrared and Raman spectra of inorganic and coordination compounds, 5th ed., Wiley, New York.


![Figure 6. IR-Spectrum of [Zn(hman)]2. H2O (A).](https://thumb-us.123doks.com/thumbv2/123dok_us/9566039.1485309/5.595.45.290.75.280/figure-ir-spectrum-of-zn-hman-h-o.webp)
![Figure 11. 1HNMR Spectra of [MoO(hmab)]2 (D).](https://thumb-us.123doks.com/thumbv2/123dok_us/9566039.1485309/6.595.46.288.73.279/figure-hnmr-spectra-of-moo-hmab-d.webp)
