Cavitation Damage Evaluation Using Laser Impacts
Tao Wan
1,+, Takashi Naoe
2, Takashi Wakui
2,
Masatoshi Futakawa
2and Katsuhiro Maekawa
31Graduate School of Science and Engineering, Ibaraki University, Hitachi 316-8511, Japan
2J-PARC Center, Japan Atomic Energy Agency, Tokai-mura, Ibaraki 319-1195, Japan 3College of Engineering, Ibaraki University, Hitachi 316-8511, Japan
Ultrasonic waves generated by a pulsed Nd-YAG laser are being adopted to evaluate the cavitation damage, so-called pitting, caused by proton beam injection in pulsed neutron sources. The wave’s propagation behavior depends on the density and depth of the pits. To quantitatively understand the relationship between the pits and the wave propagation behavior, the artificial pits were imposed on the evaluated specimen while controlling the density and depth. A laser Doppler vibrometer was used to remotely detect the ultrasonic waves generated by the Nd-YAG laser. It was found that the two parameters, namely, the maximum negative peak value and the attenuation of received waveforms were useful for quantitatively evaluating the damage. As a result, cavitation damage with a peak-to-peak roughness of more than 15 µm was successfully evaluated. [doi:10.2320/matertrans.I-M2014813]
(Received August 30, 2013; Accepted January 7, 2014; Published June 25, 2014)
Keywords: cavitation damage, laser ultrasonic, vibration velocity, attenuation, effective thickness
1. Introduction
In the last decade, the use of liquid metals for spallation neutron sources and next-generation reactors has been examined. In the USA and Japan, mercury target systems are being developed for the MW-scale neutron sources taking into account the advantages of self-circulating heat removal and neutron yield.1,2) Pulsed proton beams (3 GeV, 25 Hz, 1 µs pulse duration) are injected into the mercury target in order to produce high neutronfluxes in the Japan Spallation Neutron Source (JSNS). The repeated bombardment of pulsed proton beams introduces high-intensity and impulsive pressure waves in the mercury.4)The pressure waves induce cavitation in the mercury which finally causes cavitation damage on the inner wall of the target vessel.35) The cavitation damage, referred to as pitting damage, significantly reduces the lifetime of the mercury target vessel.69) There-fore, it is extremely important to evaluate the pitting damage from the viewpoints of the structural integrity and the lifetime evaluation.
Ultrasonic techniques are widely used in non-destructive inspection. Routine ultrasonic inspections are performed using piezoelectric transducers that are either in contact with the specimen or immersed in a suitable coupling fluid such as water.10) However, the application of piezoelectric trans-ducers is occasionally limited by hot, high radioactive, moving products, specimens having complex geometries, and work pieces that are hard to contact using ultrasonic couplants.11)
Considering the high radiation in the operation environ-ment, a remotely noncontact evaluation technique is expected to be developed. Electromagnetic-acoustic transducers (EMATs) are commonly used as the noncontact transducers. While EMATs do not suffer from couplant problems, they still have to be deployed close to the specimen to obtain
strong signal, and will be affected by high radiation enviroment.10)
The combination of laser and the detector for the generation and detection of ultrasonic waves offer not only non-contact but also fully remote evaluation techniques. The laser-generated ultrasound provides a wideband and control-lable source capable of generating compression, shear, and surface waves. Subsequently, the laser interferometer records the specimen vibration displacement or velocity.1214) An-other very important viewpoint is that the laser-generated source can be used to simulate the bombardment of the pulsed proton beams owing to the similar pulse widths relatively.
In this study, we evaluated the cavitation damage of mercury target by using the ultrasonic inspection system consisting of a pulsed Nd-YAG laser as a source and a HeNe laser Doppler vibrometer as a detector.
2. Experimental Procedure
2.1 Laser ultrasonic system
Figure 1 shows the laser ultrasonic system employed in the experiment. The bottom side of the specimen is the damaged
Nd-YAG laser CCD camera
He-Ne LDV system
Specimen
Oscilloscope Micro scope
lens Mirror
LCD
Half mirror
X-Y Stage X
Z
Y
Fig. 1 Schematic of the laser ultrasonic inspection system. +Corresponding author, E-mail: wan.tao@jaea.go.jp, Graduate Student,
Ibaraki University. Present address: J-PARC Center, Japan Atomic Energy Agency, Tokai-mura, Ibaraki 319-1195, Japan
Special Issue on Laser Ultrasonics and Advanced Sensing 2013
[image:1.595.320.535.623.769.2]surface. A Q-switched Nd-YAG laser (QUANTEL USA, Ultra 100-55-20) operating at a wavelength of 532 nm was directed on the upper surface. The laser provided an output energy of 2.5 mJ in 6.5 ns, a repetition frequency of 1 Hz, and a Gaussian beam profile of 3 mm in diameter. The laser beam does not impose any damage on the specimen.
The interference between the reference and the scattered beams was monitored by a laser Doppler vibrometer (LDV) (ONOSOKKI, LV-1710) with a HeNe laser (633 nm, 1 mW), having a detecting frequency range of 1 Hz3 MHz. Signals captured by the LDV were recorded using an oscilloscope with a sampling rate of 12.5 MHz. Each waveform was obtained by averaging 180 signals to reduce the noise. The HeNe laser beam was focused by a microscope lens onto the specimen surface to form a spot with 3.5 µm in diameter to obtain an accurate spatial resolution. The distance between the central point of the HeNe laser beam spot and that of the Nd-YAG laser beam spot wasfixed to be 5 mm.
2.2 Artificial damage
To quantitatively understand the correlation between the wave propagation behavior and the pits, the artificial pits with varying depths and densities were formed on the specimens. The material of the specimen is an austenitic stainless steel type 316, which is the same as the material of the mercury target vessel, with a size of 60 mm©60 mm©2.4 mm. The specimen surface was polished to a roughness of less than 1 µm. Figure 2 shows the two artificial damaged specimens and Laser Scanning Microscope (LSM) image of indents. The Vickers indents were conducted by a load of 490 N. The depth and side length of the indent were approximately 110 and 550 µm, respectively. The number of Vickers indents are 121 and 900, respectively, which were formed at the same center area (30©30 mm2) of the two specimens to simulate the pits. In the experiments, the detection laser was placed at the center of the specimen.
2.3 Cavitation damage
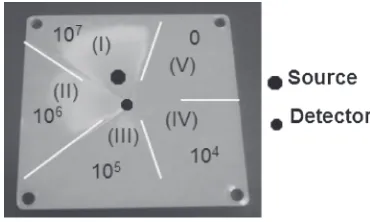
[image:2.595.126.469.70.151.2]After making clear the correlation between the wave propagation behavior and the artificial pits, experiments were performed to quantitatively evaluating the cavitation damage. Figure 3 shows a photograph of the specimen with distribut-ed cavitation damage. The cavitation damage was imposdistribut-ed on the specimen using an electro-Magnetic Impact Testing Machine (MIMTM) in mercury. The detailed information of MIMTM and cavitation damage was described in refer-ence.17) The specimen was divided into five areas. The number of impacts performed at each area was 0, 104, 105, 106and 107, respectively. The peak-to-peak (P-P) roughness
of the cavitation damage at each area was: (I) 45 µm, (II) 35 µm, (III) 25 µm, (IV) 15 µm. The position of the detector wasfixed and the laser source was placed in turn at each area in the evaluation process. The cavitation damage in each area could be placed between the source and detector through such an arrangement.
3. Numerical Simulation
It is very time-consuming to systematically investigate the dependency of the ultrasonic wave propagation behavior on the shape and depth of pits by artificially making the simulated pits. Moreover, it is impossible to directly investigate the wave propagation behavior inside the material by experiments. On the contrast, it is capable of performing such investigations much more efficiently and intuitively by the numerical simulation. In order to systematically inves-tigate the dependency of ultrasonic wave propagation behavior on the aspect ratio and depth of pits, the numerical simulations were performed using a Finite Difference Method referred to as Wave3000 (Cyber Logic).15,16) The specific acoustic equation used in Wave3000 is given by:16)
μ@2w
@2t ¼ ®þ© @ @t
r2w
þ þ®þº @
@tþ © 3
@ @t
rðr•wÞ ð1Þ
where μ is the material density, kg/m3; is thefirst Lame constant, N/m2;®is the second Lame constant, N/m2;© is the shear viscosity, N·s/m2;ºis the bulk viscosity, N·s/m2;r is the gradient operator; r• is the divergence operator; t is the time, s; w is a three-dimensional column vector whose components are thex,y, andz components of the displace-ment of the medium at locationðx; y; zÞ.
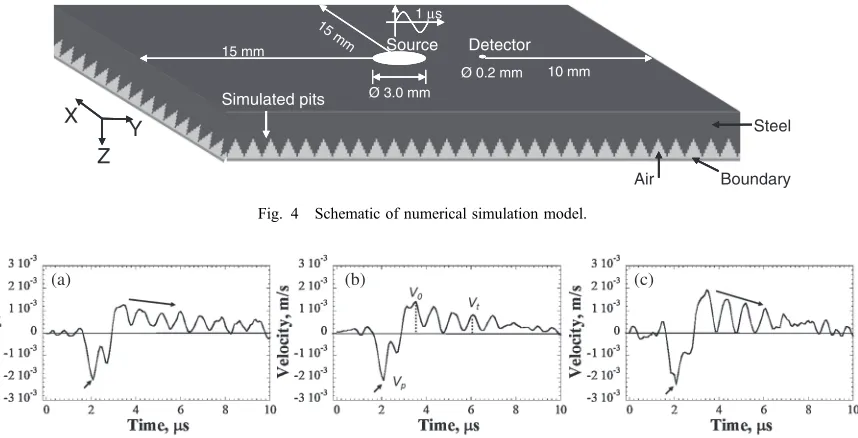
Figure 4 shows the schematic of numerical simulation model for a simulated pits specimen. The geometrical size of each model is 30©30©2.5 mm3. The time increment is
(a) (b) (c)
Fig. 2 Artificial damaged specimens and LSM image of indents; (a) 121 indents, (b) 900 indents, (c) LSM image of indents.
[image:2.595.333.518.192.303.2]0.0127 µs. The mesh size is 0.1 mm. The boundary condition of the maximum Z surface is infinite, whereas that of the other surfaces is“freefree”. The source and detector are 3.0 and 0.2 mm in diameter, respectively. The source is a pulsed longitudinal sinusoidal wave with a frequency of 1 MHz and a duration of 1 µs. The vibration velocity in the Z-direction as a function of time was calculated. Simulated pits with varying depths,D, and aspect ratios,AS(depth/width), were established at the bottom of the model.
4. Results and Discussions
4.1 Wave propagation
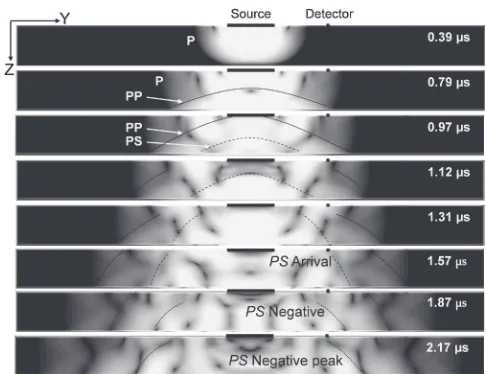
Figure 5 shows the time history of the vibration velocity detected from an undamaged specimen and the two artificial damaged specimens. For all the cases, the time-response indicates the similar trend; a negative peak appeared at approximately 2.08 µs; and the positive peak attenuated gradually. However, the amplitude of the negative peak and the damping degree of waveforms were different. When the density of indents increased, the amplitude of the largest negative peak and the damping degree of waves also increased.
Figure 6 shows the time history of vibration velocity obtained from the numerical simulation. The thickness of specimen is 2.4 mm. The damaged specimen is established with 900 simulated pits, the depth of pits (D) was 0.5 mm and
the aspect ratio (AS) was 0.5. The other conditions are described in Sec. 3. The time-response signals showed the same tendency as the experimental results: the negative peak appeared at approximately 2.16 µs and the positive peak attenuated gradually. However, the time-response of experi-ments and numerical simulations showed some differences after approximately 4 µs. The numerical simulation results showed positive and negative peaks whereas the experimen-tal results showed only positive peaks. It will be discussed later in detail.
In order to quantitatively describe the attenuation behavior, the amplitude of the first negative peak was defined as VP (m/s). Furthermore, the attenuation coefficient is defined as follows:
Vt¼V0e¡t ð2Þ
where¡is the attenuation coefficient, µs¹1;Vtis the vibration
velocity at timet, m/s, andV0is the vibration velocity of the largest positive peak, m/s.
As shown in Fig. 7, when the laser impacted the upper surface of the specimen, longitudinal waves (P) were generated owing to the thermalelastic effects. Subsequently, they travelled through the thickness direction of specimen and reach the bottom surface. A part of the P wave was converted into shear waves (PS) when reflected. The propagating velocities of the P wave (CP) and PS wave (CS) in stainless steel are 5.9 and 3.2 mm/s, respectively, the
Source Detector
Simulated pits
Steel
Air X
Z Y
Boundary
Ø 3.0 mm
Ø 0.2 mm 15 mm
15 mm
10 mm 1μs
Fig. 4 Schematic of numerical simulation model.
(a) (b) (c)
Fig. 5 Detected waveforms obtained from different specimens; (a) no damage, (b) 121 indents, (c) 900 indents.
(a) (b)
[image:3.595.87.516.69.288.2] [image:3.595.106.487.315.435.2]arrival time of the PS waves (tPS) is expected to be approximately 1.6 µs. In the experiment, the arrival time of
PSwaves was approximately 1.6 µs. Then thePSwaves keep propagating and the negative peak of PS waves arrived at approximately 2.08 µs. Therefore, the negative peak might be caused by PSwaves.
The wave propagation behavior was also investigated through the numerical simulation. Figure 8 shows the wave propagation images in the YZ plane at X equals to 15 mm at various times. ThePwaves propagated through the thickness direction of the specimen and reached the bottom of specimen at about 0.4 µs. A part of the Pwave was directly reflected as longitudinal waves (PP) and consequently they spread back. Meanwhile, thePSwaves were converted from
P waves and comparatively they spread slower due to the lower propagation velocity. It was unable to observe the PS waves at 0.79 µs because they were covered by P and PP
waves. At 1.12 µs, the PSwaves could be clearly observed. At approximately 1.57 µs, thePSwaves reached the position of the detector. Then thePSwaves keep propagating and the negative peak ofPSwaves arrived at approximately 2.17 µs. The numerical simulation results support the assumption that the negative peak was caused byPSwaves.
On the other hand, with respect to the attenuation, the time interval (tinterval) between two adjacent positive peaks was approximately 0.8 µs according to the experiment and numerical simulation results. The time is in agreement with the time taken by Pwaves to travel between the upper and
bottom surfaces of the specimen. Therefore, the attenuation is regarded to have been caused byPwaves.
As mentioned before, the numerical simulation results showed positive and negative peaks, whereas the experi-mental results showed only positive peaks. In the experiment, the YAG laser impacted the specimen and then generated ultrasonic waves with a wideband frequency. On one hand, there was vibration of the whole plate specimen due to the impact. The plate specimen was bended by the vibration and the displacement of the specimen kept increasing due to the bending, which induced the vibration velocity was positive. On the other hand, the P waves propagated between the upper and bottom surfaces of the specimen leaded to positive and negative vibration velocity at the detected position. However, the vibration of the whole specimen was dominant. For this reason, only positive velocity peaks appeared and attenuated in the experimental results. On the contrast, the numerical simulations carried out by the Wave300 mode only simulated the wave propagation in material and were unable to simulate the specimen vibration. So that there were positive and negative peaks appeared in the numerical simulation results.
It is easy to understand that the variation in the attenuations shown in Figs. 5 and 6 were mainly due to the wave scattering caused by pits. Furthermore, it is evident that the attenuation increases by increasing the density of the pits. In addition, the amplitude of V0 is almost the same as the amplitude ofVpaccording to the experimental and numerical simulation results. However, the mechanism of dependency ofVPandV0on pits remains unclear. This dependency will be discussed in the next section.
4.2 Dependency of VP and V0on aspect ratio, depth of
pits, and effective thickness
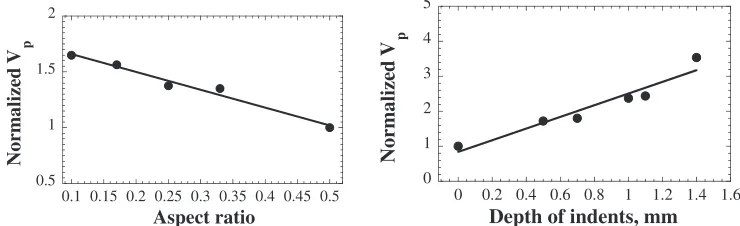
Using the numerical simulation models described in Sec. 3, the dependencies ofVPandV0on the aspect ratio (AS) and depth (D) of the pits were systematically investigated. The number of simulated pits is 100. TheDwasfixed to be 0.5 mm when adjusting theAs, whereas theAswasfixed to be 0.5 when adjusting the D. Figure 9 shows VPas a function of both AS and D. It can be seen that VP decreases with increasing AS, whereas it increases with increasing D. Considering that both AS and D of the pits change the effective thickness (Teffective) of the specimen, it is assumed that the variation ofVPis caused by the change ofTeffectivedue to the pits.
Fig. 7 Schematic of wave propagation.
[image:4.595.99.494.72.204.2] [image:4.595.47.290.237.424.2]For the artificial damaged specimen, the volume of the specimen is reduced by the artificial pits. The effective thickness of the artificial damaged specimen was used to indicate the thickness variance of specimen caused by the volume reduction due to the artificial pits. It is defined as follows:
TACdl2¼TeffectiveA ð3Þ
where,Tis the thickness of the specimen,Ais the observed area in which pits are located,d is the depth of the pits,lis the side length of the pits, and Teffective is the effective thickness of the specimen. Each parameter has a unit of mm.
C is a constant that related to the shape of damage. In the present study,Cequals to 1/3.
[image:5.595.112.482.74.187.2]Specimens with effective thicknesses of 2.3, 2.4, 2.5, and 2.6 mm were assumed in the numerical simulations. Figure 10 shows a wave propagation snapshot in the YZ plane (X: 15 mm; t: 1.12 µs). The intensity of the contour indicates the amplitude of displacement, Ia. With increasing the effective thickness of specimen, the displacement of the
PS waves (black dashed curve: approximately 5©1.2 mm2) trends weaker. To quantitatively make clear the correlation between PS waves, VP and the effective thickness of specimen, it will be discussed from the viewpoint of the wave energy.
For the reflectedPSwaves, the energy of the wave,Ea, is proportional to the square of Ia; On the other hand, for the detected waveforms, at the time VP appears, the energy of waves, EP, is proportional to the square of VP. Figure 11 shows the normalized energy as a function of the specimen’s effective thickness.Eaand EPwere normalized by the value for the case of 2.4 mm. When the specimen thickness increased, the energies of both reflected and detected waves decreased. It can be seen thatVPis inversely proportional to
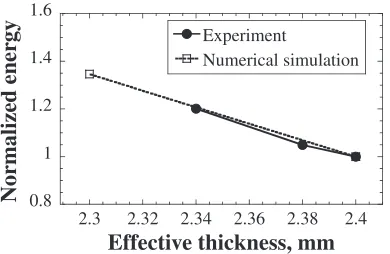
Teffective. Moreover, the normalized energy of the detected waveforms closely agrees with that of the reflected wave-forms. This further explains that VPis caused by the shear waves that were reflected from the bottom of the specimen. According to eq. (3), the effective thickness of the specimen with 121 indents is estimated to be 2.38 mm, whereas that of the specimen with 900 indents is 2.34 mm. Then, to draw comparisons with the numerical simulation result, the normalized energy of the negative peak of the detected waves was plotted as a function of the effective thickness, as shown in Fig. 12. The trend of the normalized energy is almost the same as that predicted by the simulations. This further proves that the variation of Vp is
caused by the change ofTeffective. This phenomenon is related to the energy of the ultrasonic waves. Equation (1) used in Wave3000 includes the material viscosity. When ultrasonic waves are propagating in material, in a certain propagation direction, the energy density reduces due to the spreading of ultrasonic waves and the attenuation caused by absorption. If
Teffective increases, the travel path of the detected ultrasonic waves is longer. So that in the direction of the travel path, the energy density of the ultrasonic waves decreases due to ultrasonic waves spreading and attenuation. As a result, the ultrasonic waves possess relatively smaller energy density when arriving at the detector. The vibration velocity is proportional to the energy of ultrasonic waves, so that less energy density leads to a smaller vibration velocity.
0.5 1 1.5 2
0.1 0.15 0.2 0.25 0.3 0.35 0.4 0.45 0.5
Normalized V
p
Aspect ratio
0 1 2 3 4 5
0 0.2 0.4 0.6 0.8 1 1.2 1.4 1.6
Normalized V
p
Depth of indents, mm
[image:5.595.305.546.228.390.2]Fig. 9 Vpas a function ofAsandD.
Fig. 10 A snapshot of wave propagation in the YZ plane (X: 15 mm;
t: 1.12 µs).
0.6 0.8 1 1.2 1.4 1.6
2.2 2.3 2.4 2.5 2.6 2.7
Reflected Detected
Normalized ener
gy
Effective thickness, mm
[image:5.595.324.525.438.564.2]4.3 Evaluation of cavitation damage
To assess the effectiveness of the two parameters ofVPand ¡ for the quantitative damage evaluation, the cavitation damage related to various P-P roughness values was detected by the laser ultrasonic system.
Figure 13 shows the results of VPand ¡ as a function of P-P roughness. It is noted thatVPand ¡were normalized by the value for the case of no damage. It can be seen that both
VP and ¡ were dependent on the P-P roughness of the cavitation damage. When increasing the P-P roughness, the
VPand¡also increased. It is considered that the value of P-P roughness indicates the depth of the cavitation damage. According to the discussion in the Sec. 4.2, the VP is proportional to the depth of indents. Therefore, the higher P-P roughness leads to the larger VP. On the other hand, the attenuation of waveforms trends larger due to the stronger wave scattering from the cavitation damage with higher P-P roughness.
Recently, the authors developed a nonlinear ultrasonic measuring procedure18) to evaluate the same distributed cavitation damage, however the cavitation damage with a P-P roughness of approximately 15 µm was not very clearly imaged. In the present study, the two parameters, VPand ¡, are used to quantitatively evaluate the cavitation damage. It was seen from the experimental results that VP and ¡ were clearly different from that of without damage even in the case of 15 µm. For this reason, it can be summarized that the cavitation damage with a P-P roughness of approximately 15 µm was successfully evaluated by the method proposed in this study.
5. Conclusion
To quantitatively understand the relationship between the wave propagation behavior and the pits, the artificial pits which were imposed on two plate specimens controlling the density and depth were evaluated by a laser ultrasonic system. The numerical simulation was carried out to systematically investigate the dependency of wave propaga-tion behavior on the pits. Based on the results, the followings were obtained:
(1) The maximum negative peak value (VP) and the attenuation coefficient (¡) of the received waveforms were very dependent on pits and were useful for quantitatively evaluating the cavitation damage.
(2) By calculating the travel time of the wave, it is deduced that the negative peak was caused by the shear waves that were reflected from the bottom of the specimen, whereas the attenuation was caused by the longitudinal waves that propagate between the upper and bottom surface of the specimen.
(3) VP and ¡ were applied to quantitatively evaluate the cavitation damage distribution. A cavitation damage with P-P roughness of approximately 15 µm was successfully evaluated.
Acknowledgements
This work was partly supported by the Japan Society for the Promotion of Science through a Grant-in-Aid for Scientific Research C (No. 23561021).
REFERENCES
1) Y. Ikeda:Nucl. Instrum. Methods Phys. Res. A600(2009) 14. 2) F. Maekawaet al.:Nucl. Instrum. Methods Phys. Res. A620(2010)
159165.
3) M. Futakawa, H. Kogawa and R. Hino:J. Phys. IV France10(2000) Pr9-237242.
4) M. Futakawa, K. Kikuchi, H. Conrad and H. Stechemesser: Nucl. Instrum. Methods A439(2000) 17.
5) M. Futakawa, T. Naoe, C. C. Tsai, H. Kogawa, S. Ishikura, Y. Ikeda, H. Soyama and H. Date:J. Nucl. Mater.343(2005) 7080.
6) M. Futakawa, T. Naoe, H. Kogawa, C. C. Tsai and Y. Ikeda:J. Nucl. Sci. Technol.40(2003) 895904.
7) M. Futakawa, H. Kogawa, R. Hino, H. Date and H. Takeishi:Int. J. Impact Eng.28(2003) 123135.
8) M. Futakawa, T. Wakui, H. Kogawa and Y. Ikeda: Nucl. Instrum. Methods A562(2006) 676679.
9) M. Futakawa, H. Kogawa, S. Hasegawa, Y. Ikeda, B. Riemer, M. Wendel, J. Haines, G. Bauer, T. Naoe, K. Okita, A. Fujiwara, Y. Matsumoto and N. Tanaka:J. Nucl. Mater.377(2008) 182188. 10) C. B. Scruby:Ultrasonics27(1989) 195209.
11) J. D. Aussel, A. Le Burn and J. C. Baboux:Ultrasonics26(1988) 245 255.
12) V. A. Golenishchev-Kutuzov, R. I. Kalimullin, S. A. Migachev, Yu. Ya. Petrushenko and A. A. Khasanov:Russ. J. Nondestruct.47(2011) 118 121.
13) A. M. Aindow, R. J. Dewhurst, S. B. Palmer and C. B. Scruby:NDT Int.17(1984) 329335.
14) C. B. Scruby:J. Appl. Phys.51(1980) 62106216.
15) P. P. Delsanto, R. S. Schechter and R. B. Mignogna:Wave Motion26
(1997) 329339.
16) CyberLogic, Wave3000 manual.
17) T. Wan, T. Wakui, T. Naoe, M. Futakawa, K. Kawashima and K. Maekawa:Int. J. Mater. Prod. Tecnol.46(2013) 141154.
18) T. Wan, T. Wakui, T. Naoe, M. Futakawa and K. Maekawa: J. JSEM13
(2013) 5764. 0.8
1 1.2 1.4 1.6
2.3 2.32 2.34 2.36 2.38 2.4 Experiment
Numerical simulation
Normalized ener
gy
[image:6.595.74.269.71.198.2]Effective thickness, mm
Fig. 12 Comparison between numerical simulation and experimental results.
0.9 1 1.1 1.2 1.3 1.4
0 10 20 30 40 50
0.9 1 1.1 1.2 1.3 1.4 1.5
Normalized V
P
P-P roughness, μm
Normalized
α
[image:6.595.318.534.72.188.2]