_____________________________________________________________________________________________________ *Corresponding author: E-mail: [email protected], [email protected];
3(1): 1-14, 2019; Article no.JENRR.49141
ISSN: 2581-8368
A Comparative study of Time Series, Empirical
Orthogonal Transformation and Descriptive
Statistical Analysis on Meteorological Parameters
over Ogoja and Maiduguri
D. O. Akpootu
1*, B. I. Tijjani
2and U. M. Gana
21Department of Physics, Usmanu Danfodiyo University, Sokoto, Nigeria. 2
Department of Physics, Bayero University, Kano, Nigeria.
Authors’ contributions
This work was carried out in collaboration among all the authors. The data for the work was sourced and analyzed by author DOA. Author DOA also designed the study, drafted and edited the manuscript. Authors BIT and UMG supervised the work. All the authors read and approved the final manuscript.
Article Information
DOI: 10.9734/JENRR/2019/v3i130088 Editor(s): (1)Salisu Muhammad Lawan, Department of Electrical and Electronics Engineering, Kano University of Science and Technology (KUST) Wudil, Nigeria. (2)David Dotse Wemegah, Senior Lecturer, Department of Physics, Kwame Nkrumah University of Science and Technology, Kumasi, Ghana. Reviewers: (1) R. Ahmad Albattat, Management and Science University, Malaysia. (2)A. Ayeshamariam, Khadir Mohideen College, India. Complete Peer review History:http://www.sdiarticle3.com/review-history/49141
Received 02 March 2019 Accepted 16 May 2019 Published 01 June 2019
ABSTRACT
In this study, time series statistical analysis was carried out on the monthly average daily meteorological parameters of global solar radiation, sunshine hours, wind speed, mean temperature, rainfall, cloud cover and relative humidity during the period of thirty one years (1980 – 2010) using IBM SPSS Statistics version 20 with expert modeler to determine the level, trend and seasonal variations for Ogoja and Maiduguri. Seasonal Auto Regressive Integrated Moving Average models were determined for the two locations along with their respective statistical indicators of coefficient of determination, Root Mean Square Error, Mean Absolute Percentage Error and Mean Absolute Error and are found suitable for one step ahead forecast for the studied area. The factor analysis (empirical orthogonal transformation) and descriptive statistical analysis
was also carried out for the study areas under investigation. The results indicated that the model type for all the meteorological parameters for Ogoja is simple seasonal while that for Maiduguri is simple seasonal except for rainfall and cloud cover with winter’s additive and ARIMA models respectively. The correlation matrix obtained from the factor analysis for the studied area indicated that the global solar radiation and wind speed are more correlated with the mean temperature. The sunshine hours and mean temperature are more correlated with the global solar radiation. The rainfall is more correlated with the relative humidity; similarly, the relative humidity is more correlated with the rainfall. However, the cloud cover is more correlated to the rainfall for Ogoja while for Maiduguri the cloud cover is more correlated to the relative humidity. The component matrix analysis revealed that two seasons are identified for Ogoja; the rainy and dry seasons while for Maiduguri three seasons are identified; the rainy, cool dry (harmattan) and hot dry seasons. The skewness and kurtosis test for Ogoja indicated that the global solar radiation, sunshine hours, cloud cover and relative humidity are negatively skewed and the wind speed, mean temperature and rainfall are positively skewed while the global solar radiation, sunshine hours, wind speed, cloud cover and relative humidity indicates possibility of a leptokurtic distribution and the mean temperature and rainfall indicates possibility of a platykurtic distribution. The skewness and kurtosis for Maiduguri indicated that the solar radiation, rainfall and relative humidity are positively skewed and the sunshine hours, wind speed, mean temperature and cloud cover are negatively skewed while the global solar radiation, rainfall and cloud cover indicates possibility of a leptokurtic distribution and the sunshine hours, wind speed, mean temperature and relative humidity indicates possibility of a platykurtic distribution.
Keywords: Time series; factor analysis; descriptive statistics; meteorological parameters; Ogoja, Maiduguri.
1. INTRODUCTION
Solar radiation research is a field of rising interest due to its many applications, such as the study of evapotranspiration [1], optimization of water demand in irrigation, crop forecasting [2] and the adjustment of energy policies to promote solar energies, and research on climate change [3]. The process of converting sunlight to electricity without combustion allows creating power without direct pollution. In view of this, it is therefore necessary to propose some prediction models [4] that use this technology and to
integrate solar energy photovoltaic (PV)
production systems in the energetic mix [5]. Thus, solar energy forecasting is used to predict the amount of solar energy available in near terms [6]. Several methods have been developed by different researchers around the globe and the mathematical formalism of times series has often been used [7]. Time series has been defined as a set of numbers that measures the status of some activity over time. It is the
historical record of some activity, with
measurements taken at equally spaced intervals with a consistency in the activity and the method of measurement [8]. Autoregressive Integrated Moving Average (ARIMA) model has been studied extensively to time series analysis and forecasting. They were widespread by Box and Jenkins in the 1976s [9] making their names
frequently used synonymously with general ARIMA models. Some of the best predictors found in literature are Autoregressive and moving average (ARMA) [7,10]. The forecasting of the solar irradiance is currently done by statistical methods, among which the ARIMA model [11] is the most popular. In the research community,
Autoregressive Moving Average (ARMA)
methods are widely used and popular time series models compared to other models [12]. The ARMA model is able to extract many regions, useful statistical properties and can easily take on the familiar box-Jenkins method [13]. Also, these models are very flexible; thus, can be used in various types of time series with different orders. Lastly, it offers regular pervasive in individual phases (identification, estimation and diagnostic check) for a suitable model [14].
The Empirical orthogonal transformation (EOT) has become standard statistical techniques
particularly in the field of climate and
The skewness and kurtosis are the basic components that are investigated in the descriptive statistical analysis. The skewness
test ( ) measures the asymmetry of the
independent meteorological parameters data around their mean value [16]. It tells us about the direction of variation of the dataset. If (i)
have a Gaussian distribution (normal distribution) (ii) the data are spread out more to the left of the mean value than to its right (negatively skewed) (iii) the data are spread out more to the right than to its left (positively skewed). The Kurtosis test
( ) describes the shape of a random variable’s probability distribution, that is, it characterizes the relative peak or flatness of a distribution compared to the normal distribution. It measures the degree of normality of each of the meteorological parameters for the studied location [16].
In this present study, time series,
Orthogonal Transformation (EOT) and
descriptive statistical analysis on the
meteorological parameters of monthly average daily global solar radiation, sunshine hours, wind speed, mean temperature, rainfall, cloud cover and relative humidity during the period of thirty one years (1980 – 2010) for two locations Ogoja
Fig. 1. Map of Nigeria showing the study areas
Akpootu et al.;JENRR, 3(1): 1-14, 2019; Article no.
and kurtosis are the basic components that are investigated in the descriptive statistical analysis. The skewness measures the asymmetry of the independent meteorological parameters data around their mean value [16]. It tells us about the direction of variation of the dataset. If (i) the data have a Gaussian distribution (normal distribution) out more to the left of the mean value than to its right (negatively skewed) (iii) the data are spread out more to the right than to its left (positively skewed). The Kurtosis test describes the shape of a random variable’s that is, it characterizes the relative peak or flatness of a distribution compared to the normal distribution. It measures the degree of normality of each of the meteorological parameters for the studied
In this present study, time series, Empirical
Orthogonal Transformation (EOT) and
descriptive statistical analysis on the
meteorological parameters of monthly average daily global solar radiation, sunshine hours, wind speed, mean temperature, rainfall, cloud cover ng the period of thirty 2010) for two locations Ogoja
and Maiduguri located in the coastal and sahelian regions of Nigeria were studied and compared.
2. METHODOLOGY
2.1 Study Area
Ogoja (Latitude 6.67.030N and Longitude 8.80
is one of the Local Government Area
River State, Nigeria. The town was one of the provinces during pre-colonial independence and is largely an agrarian area which is about 300 km north of Calabar, falls within the Coas
has many tribal units, including Ishibori (this village has different clans such as Uhmuria, Ikaptang, Ikajor, Ishinyema, Ikariku, Imerakorm) and Igoli as the central town. The key occupation of the people is subsistence agriculture, basically farming of cassava, yams, palm oil, palm wine etc. Ekajuk, is one of the major clan in Ogoja Local government area. Ogoja just like any other Coastal zone experiences two distinct seasons, the rainy and dry seasons. The rainy season lasts for about seven months, April to October while the dry season lasts from November to March.
Map of Nigeria showing the study areas
; Article no.JENRR.49141
and Maiduguri located in the coastal and sahelian regions of Nigeria were studied and
Maiduguri (Latitude 11.85°N and Longitude 13.08°E) also known as Yerwa by its locals, is the capital city of Borno State in north-eastern Nigeria. The city sits along the seasonal Ngadda River which disappears into the Firki swamps in the areas around Lake Chad. The highest temperature recorded was 47°C (117°F) on 28 May, 1983. While the lowest temperature recorded was 5°C (41°F) on 26 December, 1979. Its residents are basically Muslim including Kanuri, Hausa, Shuwa, Bura, Marghi, and Fulani ethnic groups. Though, a good number of Christians from the Southern states like the Ijaw, Urhobo, Igbo, and Yoruba are also living in the city. Three seasons have been identified in Maiduguri found in the Sahelian zone: The cool dry (harmattan) season (October-March), hot dry season (April-June) and rainy season (July-September) [17]. Temperatures are usually high all the year round, with hot season temperatures under the shade. In the southern part of the state, the weather is relatively mild. In the extreme north, the rainy season lasts for less than eighty days, while in the extreme south; it can be as high as 140 days. The mean annual rainfall is over 800 mm on the Biu Plateau but less than 500 mm the extreme north around Lake Chad. Changes in rainfall are over 100%. Generally, the city experiences low relative humidity, which can be as low as 13% in the driest months of February and March to the highest values of 70 to 80% in the rainy season months of July and August.
2.2 Statistical Analysis
The measured monthly average daily global solar radiation, sunshine hours, wind speed, maximum and minimum temperature, rainfall, cloud cover and relative humidity data for Ogoja and Maiduguri were obtained from the Nigerian Meteorological Agency (NIMET). The period under focus is thirty one years (1980 – 2010). The mean temperature was obtained by taken the average of the maximum and minimum temperature.
The time series statistical analysis was carried out on the monthly averaged data using IBM SPSS Statistics version 20 with expert modeler, to determine the level, trend and seasonal variations of the meteorological parameters. The
expert modeler determined whether Auto
regression integration moving average (ARIMA) or exponential smoothing is the best based on which model gives the highest coefficient of determination (R2).
An ARIMA model expresses the observation at the time as a linear function of previous observations, a current error term and a linear combination of previous error terms. A seasonal
ARIMA model is usually denoted
( , , ) × ( , , ) and contains the
following terms: (1) ( ) − the non-seasonal
autoregressive term of order ; (2) ( ) − the
non-seasonal differencing of order ; (3)
( ) − the non-seasonal moving average term
of order ; (4) ( ) − the seasonal
autoregressive term of order ; (5) ( ) − the
seasonal differencing of order ; (6) ( ) −
the seasonal moving average term of order .
In general the seasonal ARIMA model is expressed as [18]:
( )Φ ( )∇ ∇ = + ( )Θ ( ) (1)
where is the backshift operator defined by the expression:
= (2)
where is the random error at time usually assumed with normal distribution, zero mean and
standard deviation (white noise). Sometimes
an adjustment constant is included in equation (1). The ARIMA model is developed using coefficients , Φ , and Θ obtained from the analysis.
( ) = 1 − − … … − ,
( ) = 1 − − … … . −
∇ = (1 − ) ,
∇ = (1 − )
Φ ( ) = 1 −Φ −Φ … … .Φ ,
Θ ( ) = 1 −Θ −Θ … … .Θ
Other formulations using the concept of equation (1) and (2) are
= ,
= ,
∇ = − = ( − ) = (1 − ) ,
∇ = ∇( − ) = ∇ − ∇ ,
∇ = − = (1 − )
short-Akpootu et al.;JENRR, 3(1): 1-14, 2019; Article no.JENRR.49141
term forecasting [19]. High values of stationary R2 and R2 are desirable also the smaller the values of Root Mean Square Error (RMSE), Mean Absolute Percentage Error (MAPE), Mean Absolute Error (MAE), MaxAPE and MaxAE the better is the performance of the model.
The factor analysis using IBM SPSS Statistics version 20 was carried out to determine the correlation matrix, Kaiser-Meyer-Olkin (KMO) and Bartlett’s test, scree plot and component matrix. The correlation matrix shows how each of the meteorological parameters is correlated to other parameters; the KMO and Bartlett’s test measures the sampling adequacy and test of sphericity; the scree plot shows the variation of
Eigenvalue with component number; the
component matrix obtained for this study was to determine the prevalence of rainy/dry season in each component based on rainfall, relative humidity, solar radiation and mean temperature. High rainfall and relative humidity and low solar radiation and mean temperature indicates prevalence of rainy season while high solar radiation and mean temperature and low rainfall and relative humidity indicates prevalence of dry season.
The descriptive statistical analysis using IBM SPSS Statistics version 20 was carried out to determine the skewness, kurtosis and to compare the values of the meteorological
parameters for the study areas under
investigation. The skewness test ( ) measures
the asymmetry of the six independent
meteorological parameters data around their mean value; it is a measure of symmetry, or more precisely, the lack of symmetry. It tells us about the direction of variation of the dataset. If
= 0, the data have a Gaussian distribution (normal distribution), while < 0 indicates that the data are spread out more to the left of the mean value than to its right (negatively skewed), when > 0 indicates that data are spread out more to the right than to its left (positively skewed) [16]. The Kurtosis test ( ) describes the shape of a random variable’s probability distribution, that is it characterizes the relative peakedness or flatness of a distribution compared to the normal distribution. It measures the degree of normality of each of the meteorological parameters under investigation
[16]. For = 0 the data have normal
distribution, for > 0 the data have positive kurtosis which implies peaked distribution, that is, leptokurtic distribution (that is, too tall), when
< 0 the data have negative kurtosis which
implies flat distribution, that is, platykurtic distribution (that is, too flat, or even concave if the value is large enough).
3. RESULTS AND DISCUSSION
The time series, empirical orthogonal
transformation (EOT) and descriptive statistical techniques has been employed to compare the variability for two locations, Ogoja and Maiduguri situated in the Sahelian and Coastal region of Nigeria using monthly average daily global solar radiation, sunshine hours, wind speed, mean temperature, rainfall, cloud cover and relative humidity meteorological data during the period of thirty one years (1980 – 2010).
3.1 Time Series, Eot and Descriptive Statistical Analysis for Ogoja
Table 1 shows the model statistics for Ogoja. It was observed that the rainfall model has the highest value of stationary R2 with 71.0% and was judged the best while wind speed and mean temperature has the least with 58.5%. Based on the coefficient of determination, R2, the mean temperature model has the highest value with 75.4% and was judged the best while the cloud cover model has the least value with 26.4%. The RMSE, MAPE, MAE, MaxAPE and MaxAE are also given in the table. The values vary as each model is independent on others with different range of values.
The seasonal (1, 0, 0) × (0, 1, 1) model
with = 0.474 and = 0.988
developed for Ogoja with the solar radiation as dependent variable is given by the expression
= 0.474 + − 0.474 −
0.988 + (3)
The R2, RMSE, MAPE and MAE for Ogoja were
found to be 55.3 %, 1.666 MJm-2day-1, 8.617 % and 1.153 % respectively and are significant at 95% confidence level with significant value of 0.
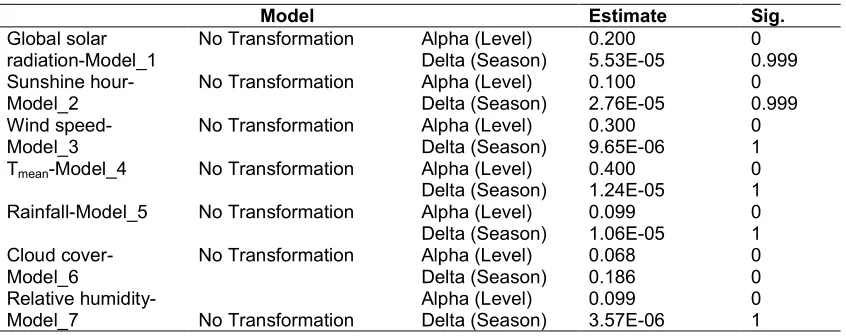
Table 2 shows the exponential smoothing model for the meteorological parameters for Ogoja. The results showed that all the parameters have only level and seasonal variations. It is obvious that the variation of the level is more dominant as compared to the seasonal variation since the significant level for the level is less than 0.05 while that of the seasonal variation is greater
Table 1. Model statistics for Ogoja
Model Model fit statistics
Stationary R2
R2 RMSE MAPE MAE MaxAPE MaxAE
Global solar radiation-Model_1
0.592 0.574 1.623 8.353 1.123 547.401 11.885
Sunshine hour-Model_2
0.699 0.579 0.912 14.865 0.663 345.157 4.487
Wind speed-Model_3 0.585 0.526 0.774 15.425 0.562 139.642 6.401
Tmean-Model_4 0.585 0.754 0.693 1.876 0.52 9.507 2.538
Rainfall-Model_5 0.71 0.699 81.359 286.649 57.404 46163.6 363.879
Cloud cover-Model_6 0.68 0.264 0.222 1.857 0.123 32.971 1.484
Relative humidity-Model_7
0.689 0.729 7.22 8.499 4.766 113.422 30.624
Table 2. Exponential smoothing model parameters for Ogoja
Model Estimate Sig.
Global solar radiation-Model_1
No Transformation Alpha (Level) 0.200 0
Delta (Season) 5.53E-05 0.999
Sunshine hour-Model_2
No Transformation Alpha (Level) 0.100 0
Delta (Season) 2.76E-05 0.999
Wind speed-Model_3
No Transformation Alpha (Level) 0.300 0
Delta (Season) 9.65E-06 1
Tmean-Model_4 No Transformation Alpha (Level) 0.400 0
Delta (Season) 1.24E-05 1
Rainfall-Model_5 No Transformation Alpha (Level) 0.099 0
Delta (Season) 1.06E-05 1
Cloud cover-Model_6
No Transformation Alpha (Level) 0.068 0
Delta (Season) 0.186 0
Relative
humidity-Model_7 No Transformation
Alpha (Level) 0.099 0
Delta (Season) 3.57E-06 1
Table 3. Model description for Ogoja
Model type
Model ID Global solar radiation Model_1 Simple seasonal
Sunshine hour Model_2 Simple seasonal
Wind speed Model_3 Simple seasonal
Tmean Model_4 Simple seasonal
Rainfall Model_5 Simple seasonal
Cloud cover Model_6 Simple seasonal
Relative humidity Model_7 Simple seasonal
Table 3 shows that the model type for the model description is simple seasonal for all the meteorological parameters for Ogoja.
Table 4 presents the correlation matrix for Ogoja, it indicates how each of the meteorological parameters is correlated to other parameters. It was observed that the global solar radiation and wind speed are more correlated to the mean temperature with 53.4% and 28.6% respectively. The sunshine hours and mean temperature are
Akpootu et al.;JENRR, 3(1): 1-14, 2019; Article no.JENRR.49141
hours and the meteorological parameters of rainfall, cloud cover and relative humidity. Negative correlations (inverse relationship) exist between the wind speed and the meteorological parameters of rainfall and relative humidity. Negative correlations (inverse relationship) exist between the mean temperature and the meteorological parameters of rainfall, cloud cover and relative humidity. Negative correlations (inverse relationship) exist between the rainfall and the meteorological parameters of global solar radiation, sunshine hours, wind speed and
mean temperature. Negative correlations
(inverse relationship) exist between the cloud cover and the meteorological parameters of global solar radiation, sunshine hours and mean temperature. Negative correlations (inverse relationship) exist between the relative humidity and the meteorological parameters of global solar radiation, sunshine hours, wind speed and mean temperature.
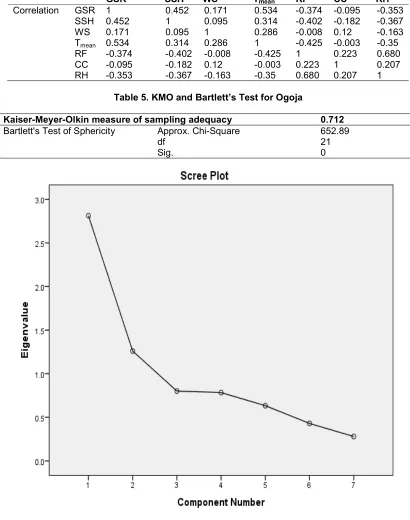
In Table 5, the Kaiser-Meyer-Olkin (KMO) shows that the sampling adequacy of 71.2% was obtained. ≥ (0.05) or ≥ 50% is the acceptable value and is in agreement with the study report by Aliyu et al. [15]. The Bartlett’s test of sphericity gives degree of freedom of 21 and it’s significant at 95% confidence level.
Fig. 2 shows the scree plot for Ogoja. The scree plots which indicates the relationship between the eigenvalues and component numbers; to extract initial factors, the most common approach is to use a statistics called the eigenvalues. Eigenvalue is a measure that reflects the amount of variance in the original variables is set to be a
decisive factor. The eigenvalue decreases from 2.80 to 0.30. According to Salah Shour et al. [20], general agent are selected such that their eigenvalues are greater than one. It can be observed that the Eigenvalue greater than one for Ogoja is component 1 and
2.
The component matrix for Ogoja is given in Table 6. For component 1 the rainfall and relative humidity has negative correlation of 78.4% and 76.2% while global solar radiation and mean temperature has correlation of 72.4% and 70.4% this is an indication that the rainy season is prevalence. Component 2 shows that rainfall and relative humidity has correlation of 27.1% and
17.5% while solar radiation and mean
temperature has correlation of 19.6% and 37.6% this is an indication that the dry season is prevalence. The overall results indicated that two
seasons are identified in Ogoja; the rainy and dry seasons respectively.
Table 7 shows the descriptive statistics for Ogoja. It was observed that the global solar radiation, sunshine hours, cloud cover and relative humidity data spread out more to the left of their mean value (negatively skewed) and the wind speed, mean temperature and rainfall data spread out more to the right of their mean value (positively skewed). The global solar radiation, sunshine hours, wind speed, cloud cover and relative humidity data have positive kurtosis which indicates a relatively peaked distribution and possibility of a leptokurtic distribution and the mean temperature and rainfall data have negative kurtosis which indicates a relatively flat distribution and possibility of a platykurtic distribution. In the study carried out by Hejase and Assi [16] at Al Ain city – UAE, they found that the temperature, sunshine hours and global solar radiation spread out more to the left of their mean value (negatively skewed) and the wind speed and relative humidity spread out more to the right of their mean value (positively skewed). The wind speed and sunshine hours have positive kurtosis while the temperature, relative humidity and global solar radiation have negative kurtosis; comparing with the results for Ogoja in this study, it was observed that for the skewness test, there are differences in the temperature and relative humidity data and similarity in the wind speed, sunshine hours and global solar radiation data, while for the kurtosis test, there are differences in the relative humidity and global solar radiation data and similarity in the mean temperature, wind speed and sunshine hours data; the differences is due to atmospheric and climatic conditions associated with the locations.
The sum of global solar radiation, mean temperature, rainfall and relative humidity during the period under investigation for Ogoja are 5984.510 MJm-2day-1, 10270.100 0C, 58466.400 mm and 27115.000 % respectively.
3.2 Time Series, Eot and Descriptive
Statistical Analysis for Maiduguri
has the least value with 49.3%. The RMSE, MAPE, MAE, MaxAPE and MaxAE are also given in the table. The values vary as each
model is independent on others with different range of values.
Table 4. Correlation matrix for Ogoja
GSR SSH WS Tmean RF CC RH
Correlation GSR 1 0.452 0.171 0.534 -0.374 -0.095 -0.353
SSH 0.452 1 0.095 0.314 -0.402 -0.182 -0.367
WS 0.171 0.095 1 0.286 -0.008 0.12 -0.163
Tmean 0.534 0.314 0.286 1 -0.425 -0.003 -0.35
RF -0.374 -0.402 -0.008 -0.425 1 0.223 0.680
CC -0.095 -0.182 0.12 -0.003 0.223 1 0.207
RH -0.353 -0.367 -0.163 -0.35 0.680 0.207 1
Table 5. KMO and Bartlett’s Test for Ogoja
Kaiser-Meyer-Olkin measure of sampling adequacy 0.712
Bartlett's Test of Sphericity Approx. Chi-Square 652.89
df 21
Sig. 0
Akpootu et al.;JENRR, 3(1): 1-14, 2019; Article no.JENRR.49141
Table 6. Component matrix for Ogoja
Component
1 2
Rainfall -0.784 0.271
Relative humidity -0.762 0.175
Global solar radiation 0.724 0.196
Tmean 0.704 0.376
Sunshine hour 0.672 -0.094
Wind speed 0.269 0.705
Cloud cover -0.272 0.686
Extraction Method: Principal Component Analysis. a. 2 components extracted.
Table 7. Descriptive statistics for Ogoja
Range Minimum Maximum Sum Mean Std. Deviation
Skewness Kurtosis
Statistic Statistic Statistic Statistic Statistic Statistic Statistic Statistic
GSR 22.255 2.171 24.426 5984.510 16.087 2.482 -0.643 2.856
SSH 7.100 1.300 8.400 2149.900 5.779 1.403 -0.695 0.164
WS 8.700 1.100 9.800 1459.100 3.922 1.122 0.677 1.645
Tmean 7.800 24.000 31.800 10270.100 27.608 1.396 0.645 -0.112
RF 625.500 0.000 625.500 58466.400 157.168 147.977 0.637 -0.514
CC 2.800 4.500 7.300 2572.600 6.916 0.258 -4.699 30.589
RH 65.000 25.000 90.000 27115.000 72.890 13.845 -1.313 1.096
Table 8. Model statistics for Maiduguri
Model Model Fit statistics
Stationary R2
R2 RMSE MAPE MAE MaxAPE MaxAE
Global solar radiation-Model_1
0.572 0.71 2.528 7.274 1.615 166.047 20.072
Sunshine hour-Model_2 0.647 0.493 0.939 9.671 0.737 55.483 3.273
Wind speed-Model_3 0.583 0.533 1.009 15.182 0.764 106.854 3.838
Tmean-Model_4 0.656 0.893 1.155 3.307 0.881 19.726 4.092
Rainfall-Model_5 0.711 0.755 37.557 306.443 23.113 30796.7 286.317
Cloud cover-Model_6 0.526 0.526 0.548 5.41 0.264 216.917 4.555
Relative humidity-Model_7
0.606 0.912 6.299 14.158 4.315 115.928 28.994
Table 9. Exponential smoothing model parameters for Maiduguri
Model Estimate Sig.
Global solar radiation-Model_1
No Transformation Alpha (Level) 0.500 0
Delta (Season) 2.79E-06 1
Sunshine hour-Model_2
No Transformation Alpha (Level) 0.100 0
Delta (Season) 3.18E-05 0.999
Wind speed-Model_3 No Transformation Alpha (Level) 0.400 0
Delta (Season) 6.19E-05 0.998
Tmean-Model_4 No Transformation Alpha (Level) 0.300 0
Delta (Season) 2.96E-06 1
Rainfall-Model_5 No Transformation Alpha (Level) 0.008 0.033
Gamma (Trend) 4.53E-05 0.919
Delta (Season) 0 0.981
Relative humidity-Model_7
No Transformation Alpha (Level) 0.100 0
Table 10. Model description for Maiduguri
Model Type
Model ID Global solar radiation Model_1 Simple seasonal
Sunshine hour Model_2 Simple seasonal
Wind speed Model_3 Simple seasonal
Tmean Model_4 Simple seasonal
Rainfall Model_5 Winters' additive
Cloud cover Model_6 ARIMA(1,0,9)(0,0,1)
Relative humidity Model_7 Simple seasonal
Table 11. Correlation matrix for Maiduguri
GSR SSH WS Tmean RF CC RH
Correlation GSR 1 0.057 0.031 0.281 -0.251 -0.100 -0.273
SSH 0.057 1 -0.036 -0.24 -0.502 -0.082 -0.495
WS 0.031 -0.036 1 0.237 -0.001 -0.092 -0.120
Tmean 0.281 -0.240 0.237 1 0.131 0.137 0.235
RF -0.251 -0.502 -0.001 0.131 1 0.205 0.808
CC -0.100 -0.082 -0.092 0.137 0.205 1 0.272
RH -0.273 -0.495 -0.120 0.235 0.808 0.272 1
Table 12. KMO and Bartlett’s test for Maiduguri
Kaiser-Meyer-Olkin measure of sampling adequacy 0.59
Bartlett's Test of Sphericity
Approx. Chi-Square 717.528
df 21
Sig. 0
Table 13. Component matrix for Maiduguri
Component
1 2 3
Relative humidity 0.913 -0.079 0.023
Rainfall 0.885 -0.076 -0.132
Sunshine hour -0.7 -0.213 0.154
Tmean 0.311 0.788 0.189
Global solar radiation -0.318 0.655 0.395
Cloud cover 0.388 -0.066 0.634
Wind speed -0.039 0.553 -0.617
Extraction Method: Principal Component Analysis. a. 3 components extracted.
The seasonal (1, 0, 1) × (0, 1, 1) model
with = 0.934, = 0.412 and =
0.967 developed for Maiduguri with the solar radiation as dependent is given by the expression
= 0.934 + − 0.934 −
0.967 − 0.967 + 0.398 + (4)
The R2, RMSE, MAPE and MAE for Maiduguri
were found to be 69.7 %, 2.637 MJm-2day-1, 7.929 % and 1.760 % respectively.
Table 9 shows the exponential smoothing model for the meteorological parameters for Maiduguri.
The results showed that all the parameters have only level and seasonal variations, except for rainfall with level, trend and seasonal variations and cloud cover with ARIMA model. It is obvious that the variation of the level is more dominant as compared to the trend and seasonal variations since the significant level for the level is less than 0.05 while that of the trend and seasonal variations are greater than 0.05 at 95% confidence level. The estimates of the ARIMA model for cloud cover are
= 6.655; = 0.619; =
−0.47 = −0.378.
Akpootu et al.;JENRR, 3(1): 1-14, 2019; Article no.JENRR.49141
meteorological parameters for Maiduguri, except for rainfall and cloud cover with winter’s additive and ARIMA models respectively.
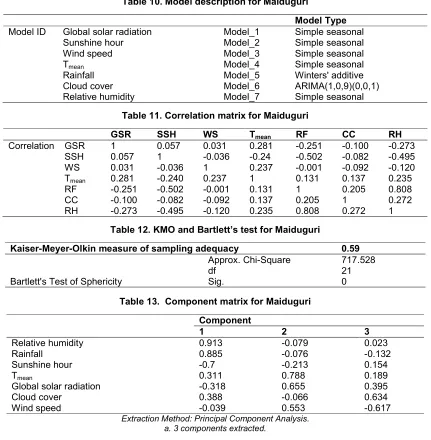
Table 11 presents the correlation matrix for Maiduguri, it indicates how each of the meteorological parameters is correlated to other parameters. It was observed that the global solar radiation and wind speed are more correlated to the mean temperature with 28.1% and 23.7% respectively. The sunshine hours and mean temperature are more correlated to the solar radiation with 5.7% and 28.1% respectively. The rainfall is more correlated to the relative humidity with 80.8%. The cloud cover is more correlated to the relative humidity with 27.2%. The relative humidity is more correlated to the rainfall with 80.8%. The results showed that a negative correlation (inverse relationship) exists between the global solar radiation and the meteorological parameters of rainfall, cloud cover and relative
humidity. Negative correlations (inverse
relationship) exist between the sunshine hours and the meteorological parameters of wind speed, mean temperature, rainfall, cloud cover and relative humidity. Negative correlations (inverse relationship) exist between the wind speed and the meteorological parameters of sunshine hours, rainfall, cloud cover and relative
humidity. Negative correlations (inverse
relationship) exist between the mean
temperature and the meteorological parameter of sunshine hours. Negative correlations (inverse relationship) exist between the rainfall and the meteorological parameters of global solar radiation, sunshine hours and wind speed. Negative correlations (inverse relationship) exist between the cloud cover and the meteorological parameters of global solar radiation, sunshine hours and wind speed. Negative correlations (inverse relationship) exist between the relative humidity and the meteorological parameters of global solar radiation, sunshine hours and wind speed.
In Table 12, the Kaiser-Meyer-Olkin (KMO) shows that the sampling adequacy of 59.0% was obtained. ≥ (0.05) or ≥ 50% is the acceptable value and is in agreement with the study report by Aliyu et al. [15]. The Bartlett’s test of sphericity gives degree of freedom of 21 and it’s significant at 95% confidence level.
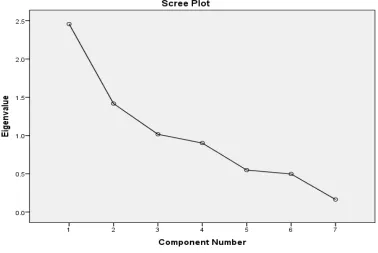
Fig. 3 shows the Scree plot for Maiduguri. The scree plots which indicates the relationship between the eigenvalues and component numbers; to extract initial factors, the most
common approach is to use a statistic called the eigenvalues. Eigenvalue is a measure that reflects the amount of variance in the original variables is set to be a decisive factor. The eigenvalue decreases from 2.40 to 0.20. According to Salah Shour et al. [20], general agent are selected such that their eigenvalues are greater than one. It can be observed that the Eigenvalue greater than one for Maiduguri is component 1, 2 and 3.
The component matrix for Maiduguri is given in Table 13. For component 1 the relative humidity and rainfall has correlation of 91.3% and 88.5% while the mean temperature and global solar radiation has positive and negative correlation of 31.1% and 31.8% this is an indication that the rainy season is prevalence. Component 2 shows that the relative humidity and rainfall has negative correlation of 7.9% and 7.6% while the mean temperature and global solar radiation has correlation of 78.8% and 65.5% this is an indication that the hot dry season is prevalence. Component 3 shows that the relative humidity and rainfall has positive and negative correlation of 2.3% and 13.2% while the mean temperature and global solar radiation has correlation of 18.9% and 39.5% this is an indication that the cool dry (harmattan) season is prevalence. The overall results indicated that three seasons are identified in Maiduguri; the cool dry (harmattan) season, hot dry and rainy seasons respectively.
Fig. 3. Scree plot for Maiduguri
Table 14. Descriptive statistics for Maiduguri
Range Minimum Maximum Sum Mean Std. Deviation
Skewness Kurtosis
Statistic Statistic Statistic Statistic Statistic Statistic Statistic Statistic
GSR 28.163 11.188 39.352 8579.549 23.063 4.686 0.141 0.454
SSH 6.400 4.400 10.800 3041.700 8.177 1.317 -0.303 -0.586
WS 7.000 2.100 9.100 2086.900 5.610 1.474 -0.107 -0.419
Tmean 16.500 18.400 34.900 10327.550 27.762 3.524 -0.340 -0.516
RF 371.600 0.000 371.600 17847.700 47.978 75.595 1.746 2.389
CC 5.300 1.900 7.200 2481.800 6.672 0.793 -3.419 13.128
RH 86.000 10.000 96.000 14589.000 39.218 21.228 0.447 -1.238
global solar radiation have negative kurtosis; comparing with the results for Maiduguri in this study, it was observed that for the skewness test, there are differences in the wind speed and global solar radiation data and similarity in the mean temperature, sunshine hours and relative humidity data, while for the kurtosis test, there are differences in the relative humidity and global solar radiation data and similarity in the mean temperature, wind speed and sunshine hours data; the differences is due to atmospheric and climatic conditions associated with the locations.
The sum of global solar radiation, mean temperature, rainfall and relative humidity during the period under investigation for Ogoja are 8579.549 MJm-2day-1, 10327.550°C, 17847.700 mm and 14589.000% respectively.
4. CONCLUSION
Akpootu et al.;JENRR, 3(1): 1-14, 2019; Article no.JENRR.49141
dominant. For Maiduguri, the pattern of variation is also level and seasonal except for rainfall where level, trend and seasonal variations were observed and ARIMA model for cloud cover. The correlation matrix obtained from the factor analysis for the locations indicated that the global solar radiation and wind speed are more correlated to the mean temperature. The sunshine hours and mean temperature are more correlated to the global solar radiation. The rainfall is more correlated to the relative humidity and the relative humidity is more correlated to the rainfall. However, the cloud cover is more correlated to the rainfall for Ogoja while for Maiduguri the cloud cover is more correlated to the relative humidity. The scree plots revealed that eigenvalues greater than one are found from component numbers 1 and 2 for Ogoja and 1, 2 and 3 for Maiduguri. It was observed that the component matrix analysis for Ogoja has two components indicating prevalence of rainy and dry seasons respectively while for Maiduguri has three components indicating prevalence of rainy, cool dry (harmattan) and hot dry seasons respectively. Based on skewness and kurtosis test, the result indicated that for Ogoja, the global solar radiation is negatively skewed and the wind speed and mean temperature are positively skewed while the sunshine hours, wind speed and relative humidity indicates possibility of a leptokurtic distribution. For Maiduguri, the global solar radiation is positively skewed and the wind speed and mean temperature are negatively skewed and the sunshine hours, wind speed and relative humidity indicates possibility of a platykurtic distribution. The rainfall and relative humidity for Ogoja is greater than that of Maiduguri while the global solar radiation and
mean temperature for Maiduguri is greater than that of Ogoja, this is expected as Ogoja is a Coastal zone while Maiduguri is a Sahelian
zone.
ACKNOWLEDGEMENTS
The authors are grateful to the management and staff of the Nigerian Meteorological Agency (NIMET), Oshodi, Lagos for providing all the necessary data used in this study. The contributions of the anonymous reviewers to improving the quality of this paper are well appreciated.
COMPETING INTERESTS
Authors have declared that no competing interests exist.
REFERENCES
1. Running SW, Nemani RR, Hungerford RD.
Extrapolation of synoptic meteorological data in mountainous terrain and its use for simulating forest evapotranspiration and photosynthesis. Can J For Res. 1987;17: 472 - 83.
2. Crop Growth Monitoring System.
Available:http://www.marsop.info/marsopd oc/ cgms92/2_2_2_en.htm
3. Schulz J, Albert P, Behr HD, Caprion D, Deneke H, Dewitte S, et al. Operational climate monitoring from space: The EUMETSAT satellite application facility on
climate monitoring (CM-SAF). Atmos
Chem Phys. 2009;9(5):1687e709.
4. Diagne M, David M, Boland J, Schmutz N,
Lauret P. Post-processing of solar
irradiance forecasts from WRF model at Reunion Island. Energy Procedia. 2014; 57:1364–73.
DOI: 10.1016/j.egypro.2014.10.127 5. Bofinger S, Heilscher G. solar electricity
forecast: Approach and first results; 2006.
6. Perez R, Hoff T, Dise J, Chalmers D,
Kivalov S. The cost of mitigating short-term PV output variability. Energy Procedia 2014;57:755–62
DOI: 10.1016/j.egypro.2014.10.283
7. De Gooijer JG, Hyndman RJ. 25 years of
time series forecasting. Int J Forecast 2006;22:443–73.
DOI: 10.1016/j.ijforecast.2006.01.001
8. Soubdhan T, Abadi M, Emilion R. Time
dependent classification of solar radiation sequences using best information criterion. Energy Procedia. 2014;57:1309–16. DOI: 10.1016/j.egypro.2014.10.121
9. Box GG, Jenkins M, Gregory CR. Time
series analysis: Forecasting and control. 4th Edition. Wiley series, probability and statistics, Prentice Hall Inc., London; 1976.
10. Brockwell PJ, Davis RA. Time series:
Theory and methods. 2nd ed. New York: Springer-Verlag; 1991.
11. Box GEP, Jenkins GM. Time series
analysis. Forecasting and Control, Holden-Day, San Francisco; 1970.
12. McKenzie E. General exponential
smoothing and the equivalent ARMA process. Journal of Forecasting. 1984;3: 333-344.
13. Ong CS, Huang JJ, Tzeng GH. Model
14. Yashwant K, Ankit B, Anil KS, Satyanarayan P. Comparative study of parameter estimation methods for solar irradiation forecasting. Journal of Clean
Energy Technologies.2016;4(3):192–196.
15. Aliyu R, Tijjani BI, Sharafa SB. Assesment
and comparison of MODIS AOD and AE product over ilorin aeronet station using
the statistical analysis of empirical
orthogonal function (EOF). Bayero Journal of Pure and Applied Sciences. 2018;11(1): 223–229.
16. Hejase HAN, Assi AH. Time-series
regression model for prediction of monthly and daily average global solar radiation in Al Ain City-UAE. Proceedings of the
Global Conference on Global Warming held on 2011 Lisbon, Portugal. 2011;1– 11.
17. Available:www.thecaliberassociates.com/b
orno/page-5/page-10/
(Accessed online on September 6, 2017) 18. Lee C, Ko C. Short-term load forecasting
using lifting scheme and ARIMA models. Expert Systems with Applications. 2011; 38:5902–5911.
19. Hendranata A. Water quality trend at the upper part of Johor river in relation to rainfall and run-off pattern. Universiti Teknologi, Malaysia; 2003.
20. SalahShour F, Moulai Pardeh A, Khazaee
K. Potential environmental assessment synoptic stations in Khuzestan province in order to generate solar power. Journal of Applied Sciences Research. 2014;10(6): 565-570.
_________________________________________________________________________________ © 2019 Akpootu et al.; This is an Open Access article distributed under the terms of the Creative Commons Attribution License (http://creativecommons.org/licenses/by/4.0), which permits unrestricted use, distribution, and reproduction in any medium, provided the original work is properly cited.
Peer-review history: