Volume 3, Number 2, December 2008
Post-Implementation Management in
Large-Scale Management Information Systems:
Changes, Incident Reports, Help Desk Calls,
and Business Process
H. Keith Edwards Department of Computer Science
University of Hawaii-Hilo
200 W. Kawili Street, Hilo, HI 96720, U.S.A. [email protected]
ABSTRACT
Proper management of the post-implementation phase of the software development life cycle is necessary in order to achieve proper strategic alignment between the technical operation of the system and organizational strategy. For this reason, it is important to understand the relationship between technical changes to the system, business process changes, process support, and the actual use of the system. This study examines the relationships among these aspects of system maintenance and process support for a key information system at a large, industrial Fortune 500 company. In this case study, we see strong relationships between system use, business process, and the technical maintenance of the system, with the business process acting as the driving force for many of these system-support activities. This case study provides empirical validation for strategic alignment philosophies and models, such as Leavitt’s Model, during the maintenance phase of the software development life cycle.
Keywords: Management information systems, configuration management, implementation issues, maintenance
1. INTRODUCTION
International Journal of Business and Information
This research investigates system metrics, process support activities, and business process changes for the post-implementation phase of an inventory requisitioning system at a Fortune 500 company. In particular, this research explores the relationships among change requests, help desk reports, system incident fixes, system utilization, and the business process in order to begin to understand the interaction between these factors in the operation and maintenance of large scale information systems.
The rest of this paper is organized as follows. Section 2 examines research related to the areas of implemented systems, configuration management strategies and support. Section 2 also discusses information related to existing studies, many of which examine the role of problem reports and incident fixes for open-source, off-the-shelf software systems such as Mozilla and Eclipse. Section 3 provides background on the system itself, the change control process used by the company, and the various data sets comprising the artifacts from the maintenance phase of the software development life cycle. Section 4 provides details on the analysis of the data sets and discussion on the analysis methods, and Section 5 provides conclusions and presents possibilities for future work.
2. RELATED WORK: SOFTWARE MAINTENANCE, CONFIGURATION MANAGEMENT AND CHANGE
Implementation and program maintenance are the final stage of the software development life cycle [21, 39]. Sommerville [39] defines the implementation stage of the software development life cycle as ―the process of converting a system specification into an executable system.‖ The word process in this definition shows that this is not merely a destination, but an on-going process that involves the continual modification of the system to meet the requirements of its operating environment.
The need for applying changes to implemented software has been evident since the development of the first systems. Early research in software engineering shows the need for a disciplined and rigorous process to control changes that are incorporated into the final product [1, 2]. Later work, such as Joeris [16], looks at how to provide basic management function for both change management and configuration management within the implementation phase of the software development life cycle. Other work, such as Davis [7], takes a broader view by examining the role that the overall development life cycle plays in the software configuration management process in the post-waterfall model era.
Volume 3, Number 2, December 2008
model hypothesizes that changes to any one aspect of the model will cause changes in the other areas of the model so that the organization can maintain its overall strategic alignment. Since this research examines changes to the system resulting from changes to both the business process and the underlying technology, we can use Leavitt’s model as a tool for understanding the relationships among several of the aspects of the implemented system.
Structure
Tasks People
Technology
Figure 1. Leavitt’s Model
2.1. Change Control Process and Configuration Management Strategies
Several articles in the related literature point to the need for, and examine, the nature of change control and configuration management processes that form a critical part of the implementation phase of the software development life cycle [3, 43]. For example, Joeris [16] provides a summary of desirable characteristics for a change management process, such as managing the process of change, as well as managing the artifacts of the change process. Chillakanti [6] motivates the need for incorporating security into the change management process. Sato, et al. [33] discuss Hewlett Packard’s change management process and its impact on the customer experience, but focuses on off-the-shelf products as opposed to bespoke systems. Nguyen [27, 28, 29] examines the software configuration environment in object-oriented and Web-based systems, but treats the more general subject matter than a specific system. Other work such as [35] looks at configuration control for evolutionary systems, whereas Simmonds [36] examines the configuration management process on the PACT software engineering system.
International Journal of Business and Information
Although the need for a disciplined change management process cannot be understated, the purpose of this research is not to supplant any of these existing processes nor to examine the particular change control strategy in isolation from the rest of the system maintenance artifacts. Rather, this research focuses on the change control process as it relates to the business process and to the implementation of change.
2.2. Support for Configuration Management
Calabough [5] points to the need for change and configuration management support and develops a tool along with a process to these ends. There is a novel approach here in terms of developing a configuration management system for naval tactical systems and with its use of expert systems technology. Here, the focus is on the control of the configuration management process from managerial and technical standpoints. rather than on examining the results of the maintenance phase of the project.
Several articles [13, 23, 24, 34, 41] examine the configuration management process in order to manage component versions in the build. For example, Thomas [41] looks at a tool for control of the object management process, whereas Mei, et al. [24] look at a model for improving component-based software development through software configuration management. Schuster, et al. [34] look at support for configuration management in large-scale work-flow systems.
Again, these treat the post-implementation phase of the software development life cycle from a developer-oriented point of view. Although the correct version of individual components is an important consideration in deploying an effective version of the system, it is also exceedingly important to view the process from end-user and organizational standpoints.
Feiler [13] examines how process support can assist in the implementation of configuration management tools, particularly through separation of mechanisms and policy. A general treatment of support for configuration management can be found in Estublier [10, 11, 12] and in German, et al. [15], who provide a framework for describing tools for the mining of software repositories [16].
Volume 3, Number 2, December 2008
2.3. Configuration Management Case Studies
A final area of research is that of configuration management case studies. These are sparse, but will most likely differ from our research in the scale of the effort, the amount of data examined, the granularity of the examination, and the time over which the system was examined. There is also a focus on open-source systems development and meta-studies that examine numerous projects at a high level view. Our study extends for five years and examines approximately 600 separate change requests, more than 6,000 incident reports, and 8,513 help desk calls. It also looks at a single bespoke system in great detail.
Dietel [8] provides a look at the impact of instituting a change management process into the organization and how this impacts the employees in the organization. The paper evolves the process from ―ignorant anarchy‖ to a more rigorous and disciplined process. This case study examines the evolution of the change control process from a personnel standpoint and provides many insights into the work necessary to achieve a rigorous process that suits the organizational needs.
Sliwerski, et al. [37] provide a study of changes in open-source software such as Mozilla and Eclipse. Their research examined the impact of fix-inducing changes on the system and provided recommendations as to how to minimize later fixes due to these changes. Further work by this group [38] looks at how to relate the software version history to the bug database.
Likewise, Mockus, et al. [26] use data on Mozilla and Apache to understand source code change history, problem reports, and productivity in order to understand the open-source development process. Koponen [19] looks at the open-source maintenance process for these same two products. Later work by Koponen [18, 20] examines an evaluation framework for open-source software projects. This work examines five open-source projects in order to examine problem tracking. The paper looks at project scale, efficiency, and defect management. One of the important findings here is that changes to the software are not necessarily connected to defects, which fact the researcher attributes to a possible lack of management in such projects.
Kim and Whitehead [17] examine the time to fix for bugs in ArgoUML and PostgresSQL, two open-source, off-the-shelf systems. In this research, the researchers look at the number of days required to fix bugs in each of these products and at the average time and distribution of time required for all the bug fixes. The majority of bugs in these programs require between 100 and 300 days to fix, with the median bug fix time being approximately 200 days.
International Journal of Business and Information
changes are laudable goals. However, an understanding of this portion of the life cycle for bespoke systems helps to paint a more complete picture of the process, since proprietary bespoke systems play a large role in the global economy.
In addition to the open-source studies, there are studies that examine the artifacts from proprietary software projects. For example, Parnin, Gorg, and Rugaber [30] explore the concept of revision history for source code by looking at both the source code revision history and the interaction history for source code created by developers at defense contractors. The revision history explored in this article is similar to Sliwerski, et al. [37], with regard to when changes induce fixes. The authors use an additional data set in terms of the interaction history and look at how the programmers access various parts of the program within the integrated development environment.
A second paper examining bespoke systems [42] looks at the productivity of developers in industrial projects in Japan. In this article, the focus is on calculating developer productivity based on various factors such as outsourcing and the upstream process ratio. The researchers found that limiting the amount of outsourcing and higher upstream process ratios greatly contributed to programmer productivity.
Although these case studies examine multiple data sources and look at proprietary projects as a case study, they examine the software maintenance from a developer standpoint as opposed to the end-user and organizational perspectives.
Bhatt, et al. [4] examine the maintenance process for 127 projects in 27 different organizations. Here, the focus is on the relationship between the software characteristics, maintenance team capability, customer attributes, and organizational climate as they relate to the software maintenance effort. The data in this paper was collected through questionnaires. Though the paper examines numerous qualitative attributes such as leadership, the authors also note that the business criticality of the system has a direct impact on the time spent by the maintenance team. This work takes a more detailed look at this type of factor, but explores the relationships using data from the maintenance phase as opposed to questionnaires.
Volume 3, Number 2, December 2008
3. DESCRIPTION OF SYSTEM ENVIRONMENT, CHANGE CONTROL PROCESS, DATA SET, AND RESEARCH QUESTIONS
This section describes the various aspects of the case study. In particular, it describes the computer system itself, the change control process used to effect changes within the system and business environment, and the various artifacts from the post-implementation phase of the software development life cycle. This section also discusses the research questions that are to be analyzed in the analysis section.
3.1. System Environment
In this study, we examine the post-implementation history of an inventory and requisitioning system used by a large global manufacturer. The overall system itself is divided into four main modules that represent the core business processes of the company.
The first module is responsible for specification and scheduling of the individual products; i.e., the type of product that will be built, along with when and where it will be built.
The second module allows users to specify a bill of material for individual products; i.e., to indicate which individual parts are used in a particular product. However, many of the parts are based on the specification and are automatically populated, based on the current components given in the engineering database.
The third module supports the ordering of the parts from the bill of material. Here, it is possible for analysts to place orders for components from the bill of material, to apply controls over orders that are already in process, and to track the status of orders and suppliers. There are also facilities to request the order of individual items that support the product, but may not appear on the bill of material.
The fourth module supports warehousing and logistic operations such as receiving, storing, allocating, and shipping the individual parts. This module also includes controls for the site that ultimately builds the product, such as a function to indicate the completion of the product within the scheduling module. Finally, there is a module for administrative functions such as creating users and allowing access to the system.
The system was originally released in 1997 in the United States, United Kingdom, and Germany. It is now deployed in numerous locations within seven countries, and has thousands of individual users. It currently has 325 different screens that support queries, updates, and administrative functions.
International Journal of Business and Information 3.2. Change Control Process
Since this is a bespoke system that was designed to support the business process, it is not surprising that the system would need to change as the business process continued to evolve. In much the same way, the organization has created the change control and configuration management processes to support the business processes. Of course, there is a separate process designated to deal with fixes to the system that are the result of bugs in the software; this process focuses much more on the technology and system than on the business process.
The change control process begins with an individual user requesting a change to the system. Typically, such a change is proposed in order to augment the system’s ability to support the user’s job or to rectify a situation in which it is unable to do so. Hence, all changes are analyzed by a business process analyst, who determines whether the change is needed to support the core business process of the organization.
If the change is required to support the business process, then the analyst assigns a priority to the change. The business process analyst then meets with representatives from the systems staff. This group analyzes the request to see whether it is actually required (i.e., whether there are workarounds) to support the business process and whether it is technically feasible. As part of the request, the person proposing the change needs to document the savings associated with the change. This is compared with a work estimate from the systems group in order to determine a cost-benefit ratio [21].
If the proposed change meets all of the preceding conditions, the systems group negotiates a target date with the business process group and provides an estimated cost for the change.
The systems group then implements the change in the development system and reports completion of the change to the business process analysts. Typically, the systems group will cascade the change into the testing and training environments to allow for evaluation without impacting the production operations of the organization.
Once the change is available, the business process analysts and possibly the person who proposed the change will test the change. If the change works according to its specification and results in no errors, it is released into the production environment of the system as part of a batch of changes. The systems group releases batches of changes into the production system several times throughout the year to maintain a more stable production environment. At the same time as the release occurs, support functions such as training and the help desk will provide users with new information anpiy the change. Typically, this takes the form of a bulletin within the system. However, it is possible that new training courses may be developed if the extent of the change is large enough.
Volume 3, Number 2, December 2008
impact on the core business processes and the system itself. A second difference is the support for changes through cascading information through training and the help desk.
3.3. Description of the Data Sets
This section examines the four major artifacts from the post-implementation phase of the system. The particular documents under consideration are a summary of change control requests, screen utilization data, an archive of help desk calls, and a summary of bug fixes for the system.
This information provides data on not just the technical aspects of the system, but also on the business process that the system supports. All of these documents relate solely to the post-implementation phase of the project, which makes it markedly different from a traditional Software Configuration Management (SCM) archive such as those described in Pressman [31], which are more likely to include artifacts from the technical development of the system (e.g., design specifications, source code, data models, etc.).
3.3.1. Change Control Requests
The first document is a synopsis of the change control requests for the overall system. This synopsis provides detailed information about the 668 change controls that have been applied to the current version of the system, as well as a summary of the implementation status and the prioritization of the change requests.
For the individual change controls, the archive provides a detailed summary of each request. In particular, the information begins with a change request number and a module to which the change request belongs. As previously stated, the system comprises four major areas, and it is possible for the request to belong to more than one area. In such cases, the change is categorized according to the area of the system where it will have the greatest impact. Some changes are categorized as all. Furthermore, the archive provides a description of the change request, along with the date that the change was requested.
There is also a place for the status of the change request. Requests can have a status of new, evaluation, accepted, or implemented. Requests can also be placed on hold, rejected, or canceled, based on the business need(s) and the availability of system resources to support the change. Along with the status of the request, each request has a priority. There are four categories of priority that range from 1-ASAP (as soon as possible) to 4-Low, based on business need. It is exceedingly rare for a change request to receive a priority of 4, as it would indicate that it is not needed to support the core business.
International Journal of Business and Information
benefit that the change will bring to the company as part of a cost-benefit ratio analysis [21] and against the actual completion date in order to monitor systems productivity.
Finally, the archive provides check boxes for updating the business process documentation, training materials, and help screens in order to ensure that users of the system receive timely information regarding operational changes to the system
.
3.3.2
.
Screen Utilization DataThe second document in the data set is the access information for the 325 individual screens in the system. This document breaks down the number of hits for each screen by year. It begins in 2000 and runs until 2005, since access information for individual information was not available prior to the year 2000.
This document indicates the screen number, screen name, module, and the number of ―hits‖ for that screen for each of the years that the screen was active. For most of the screens, this is the entire range of six years. However, some new screens were introduced during this period and several low-use screens were phased out during this time and contained data for only 1-2 years.
3.3.3. Help Desk Data
In addition to the change control data and the information on screen utilization, the data gathered from the help desk serves as another artifact from the post-implementation phase of the system. Although not as rich in detail as the change control request archive, the help desk data provides the following information:
Incident ID – A unique ID assigned to the help desk call
Problem Detail – A category indicating the area of the particular problem, generally corresponding to the business area where the problem was encountered, although there are also categories for access and log-in issues
Specific Issue – More detailed information concerning the nature of the call and often a screen number or details on the nature of the problem
Date/Time – The date and time of the call to the help desk
3.3.4. System Incidents Reports
The system incidents report archive is akin to a traditional bug report archive. For the system in this research, there is more than four years’ worth of data ranging from January 18, 2002, to September 29, 2006, comprising 6,329 separate reports.
Volume 3, Number 2, December 2008
(1) Date / Time Reported (2) Defect Type
(3) Causal Factor Level 1 (4) Causal Factor Level 2 (5) Causal Factor Level 3 (6) Other Cause
(7) Date / Time Completed (8) Solution Hours
The choice of these fields allows examination of the system problem report as it relates to the business process changes and system utilization.
3.4. Research Questions
Based on the available artifacts from the implementation phase, it is possible to examine the system from the standpoint of business drivers, technical drivers, and process support. These correspond to the technology and tasks section, whereas the help desk data provide some insight into the people aspect of the model. The results presented in the following section discuss these individual drivers, as well as the relationships between them.
In particular, this study examines the relationship between screen utilization and change requests in order to understand the business process (i.e., tasks) within the model. In particular, it focuses on how well the system utilization corresponds with the business process changes introduced to the system.
Next, we examine the corrective maintenance aspects of the system as garnered from the system problem reports to explore the technical aspects of the system and relate these to the business process, such as examining the relationship between incident fixes and system utilization.
Finally, we examine the process support (i.e., people) aspect of the system through the help desk reports and their relationship to the technical and business process aspects of the system.
4.
RESULTSThis section presents the results of our analysis. It is organized according to the business drivers, the technical drivers, and the process support activities. As might be expected, certain aspects of the system have more data than others.
International Journal of Business and Information
Table 1
Number of Data Points for System Artifacts
System Aspect Count
Screen Accesses 17,332,792
Help Desk Calls 8,513
System Incident Reports 6,329
Change Control Requests 668
4.1. Business Drivers – Change Controls and Screen Utilization
This section examines the business drivers for the system, particularly the change control data in relation to the screen utilization data. To more easily analyze the data, we calculated the average of screen use patterns for the entire six-year period.
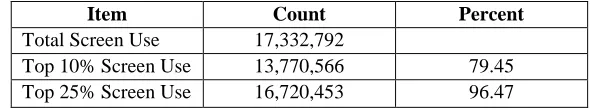
We placed the screens in order of their average number of accesses per year and examined the use of the top 10% and top quartile (25%) of the screens to determine the percentage of the overall traffic that they receive. The results, shown in Table 2, suggest an empirical validation of the ―80-20‖ rule.
Table 2
Hits for the Most-Used Screens
Item Count Percent
Total Screen Use 17,332,792
Top 10% Screen Use 13,770,566 79.45
Top 25% Screen Use 16,720,453 96.47
Here, we can see that the top quartile of the screens receives about 96% of the traffic, whereas the top 10% of the screens receives about 80% of the traffic for the entire system. Since the screens in the top 10% and the top quartile were designed to support the core business process, this is an anticipated finding. Furthermore, the screens in the lower quartiles were devoted to exception handling and administrative functions.
Volume 3, Number 2, December 2008
Table 3
Correlations Between Change Requests and Use
The results in Table 3 show a positive association (0.53 Pearson Product Moment) between the changes to a screen and the number of hits that it receives as part of the overall set of screens. This is somewhat lower than expected as the screens from module 4, which comprise the majority of the system, underwent the fewest screen specific changes overall, whereas screens from modules 2 and 3 underwent more changes for less of the system traffic (see Table 4).
Table 4
Screen Changes by Module
Description Number of Screens Percent
Module 1 Screens 50 15.38
Module 2 Screens 37 11.38
Module 3 Screens 100 30.77
Module 4 Screens 138 42.46
TOTAL 325
When broken down by module, three of the four exhibit a high correlation between change requests and screen use. Two of the Pearson Product Moment correlations are at 0.69, while the other is at 0.60, which suggests a moderate relationship between the two factors.
International Journal of Business and Information
for the screen. Hence, the number of hits and change requests can be shown to be predictors of one another. However, there was no relationship between the number of changes requested and the screen type; i.e., update screens were no more likely to receive change requests than query screens.
Table 5 shows the total screen changes and the number of changes for screens in the top 10%, top quartile, and the other three quartiles, along with their percentage as part of the overall individual screen changes.
Table 5
Screen Changes by Access Amount
Table 5 shows further evidence supporting the relationship between the average number of hits per screen and the number of changes the screen underwent. In particular, screens that were in the top 10% in terms of access received about 51% of the changes, and the top quartile received about 79% of the changes. The other three quartiles received only 21% of the changes. This result suggests that more widely used screens experience more changes. This phenomenon can be attributed to the fact that the most accessed screens form the core of the business process; this serves as a strong indicator of their continued transformation of the system to match the evolution of the business process.
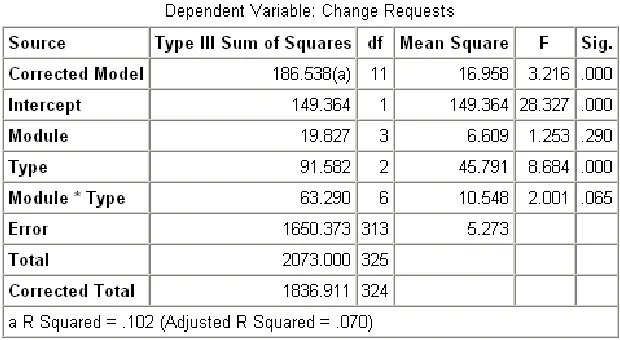
We also looked at the relationship between screen type, module, and the number of change requests. In particular, we conducted an analysis of variance on the number of change requests based on the module and the screen type as factors. This analysis is shown in Table 6, on the following page.
Table 6 shows that the screen type had a highly statistically significant impact on the number of change requests and presents further evidence that screens assist the core business process are more likely to undergo changes.
Description Number Percent
Total Screen Changes 277
Top 10% Screen Changes 141 50.90
Top 25% Screen Changes 218 78.70
Volume 3, Number 2, December 2008
Table 6
ANOVA for Module and Type
As Factors for the Number of Change Requests
4.2.
Technical Drivers -- Corrective Maintenance and Incident Reports
In section 4.1, we examined artifacts from the screen utilization data and the change control requests. These data relate to the perfective maintenance and business aspects of the system. In addition to the business process, there are also technical aspects to any organization, as indicated in Leavitt’s model (see Figure 1 earlier ). These technical aspects of the maintenance process are most aptly characterized by the systems metrics repository report, a.k.a. the incident report. This section examines the incident reports as well as their relationship to the business process.
The Metrics Repository System Reports contain 6,329 separate reports on technical incidents with the system covering a period from January 2002 until September 2006. Table 7 shows some of the common elements mentioned in incident reports.
Table 7 shows that only 710 of the 6,329 (about 11.2%) incident reports mention specific screens. The most frequent concerns were parts and orders, particularly when these did not populate within the anticipated table. To a lesser extent, shippers for parts created incidents.
International Journal of Business and Information
organization, so it is not surprising that they constitute a smaller number of the issues; there were dedicated business units to support these aspects of the system.
Table 7
Common Elements in Incident Reports
Issue Number of Incidents
Parts 1,387
Order 914
Printer 778
Reports 727
Screens 710
Access 251
Data 227
Shipper 198
Installation 130
How To 108
Interface 30
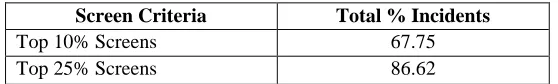
In examining the relationship between screen use and system incident reports, there is a similar pattern to the screen use and change requests (see Table 5). Table 8 shows that the top 10% of the screens in terms of access were responsible for about 68% of the incident reports involving screen. Likewise, the top 25% of screens in terms of access received 86% of the incidents. This is an even stronger relationship than the one of screen usage and change requests.
Table 8
Percentage of Total Incidents by Screen Access
Screen Criteria Total % Incidents
Top 10% Screens 67.75
Top 25% Screens 86.62
Volume 3, Number 2, December 2008
This section also examined the amount of time spent on corrective maintenance (incidents) activities, compared with adaptive maintenance (change control). The results here are not as positive as the previous results.
Table 9 shows the average time spent on corrective maintenance as opposed to adaptive maintenance. Here, we can see that there is a statistically significant difference between the time required to fix a technical problem with the system as opposed to the time required to adapt the system to a new business need at the 99% level of confidence.
Table 9
Time Spent on Corrective and Adaptive Maintenance Per Incident
Time on Maintenance Incidents Change Requests
Min -0.43 4.00
Max 8,354.68 2,160.00
Average 250.06 128.23
Std. Dev 625.95 254.74
99% Alpha 20.27 35.33
Low Conf 229.79 92.90
High Conf 270.33 163.55
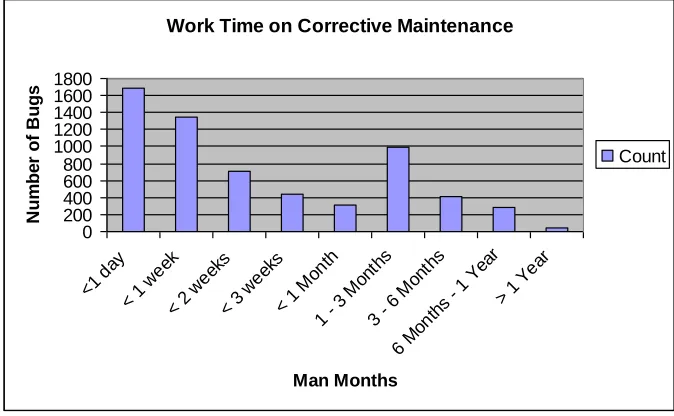
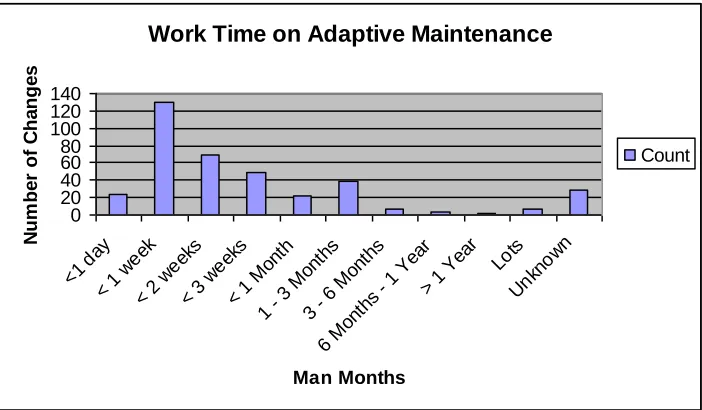
The distribution of time for these two separate types of maintenance is slightly different, as shown in figures 2 and 3.
Work Time on Corrective Maintenance
0 200 400 600 800 1000 1200 1400 1600 1800
<1 d ay
< 1 wee
k
< 2 wee
ks
< 3 wee
ks
< 1 Mon
th
1 - 3 Mon
ths
3 - 6 Mon
ths
6 M onth
s - 1 Ye
ar
> 1 Year Man Months N u m b e r o f B u g s Count
International Journal of Business and Information
In Figure 2, we can see that the vast majority of corrective maintenance takes place in under two weeks, although there is a heavy tail in this distribution with some tasks (i.e., outliers) taking longer than a year. Another trend in the corrective maintenance is shown in Figure 3.
Figure 3. Scatter Plot of Incident Fix Times by Date
Figure 3 shows the amount of time required for the rectification of individual incidents as a function of the system time line. This scatter plot shows that there are a larger number of outliers occurring as the system matures. This may be due to the fact that incidents have remained open for longer or may point to structural decay within the system; further investigation is required in order to extrapolate further.
Volume 3, Number 2, December 2008
Work Time on Adaptive Maintenance
0 20 40 60 80 100 120 140
<1 d ay
< 1 wee
k
< 2 wee
ks
< 3 wee
ks
< 1 Mon
th
1 - 3 Mon
ths
3 - 6 Mon
ths
6 M onth
s - 1 Yea
r
> 1 Yea r Lots Unk now n Man Months N um be r of C ha ng e s Count
Figure 4. Distribution of Time Required for Adaptive Maintenance
There are several possible reasons for the differences between the time spent on corrective maintenance compared with the time spent on adaptive maintenance. First is the fact that there is a controlled process for change requests that allows for negotiation between systems and the business process group. This controlled process also allows time for preliminary analysis and design as to how to implement the change as well as requiring a cost-benefit analysis before proceeding with the change. There is also no formal prioritization process for the changes. Finally, the calculation for these hours may be derived using a different methodology than the one used for change control. As a minimal recommendation, there should be increased discussion on incident reports as they relate to the business process in order to establish a more controlled process that is properly aligned with the core objectives of the organization.
4.3. Process Support – Help Desk Data
International Journal of Business and Information
This figure excludes data points that had a difference of more than 8 hours to avoid incorporating non-working time into the equation.
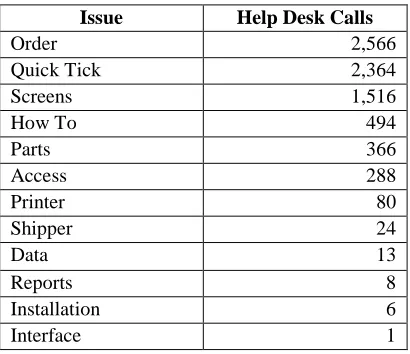
As with the incident reports, very few of the calls (1,516/8,513, or about 17.8%) involved individual screens within the system. Table 10 shows that the most frequent concerns were with orders and screens. There are also a large number of calls in the quick-tick category for which the help desk provided a quick answer. These quick ticks are often calls requesting information on access to the system, directions to appropriate screens for business tasks, or interface issues.
Table 10
Common Elements in Help Desk Calls
Issue Help Desk Calls
Order 2,566
Quick Tick 2,364
Screens 1,516
How To 494
Parts 366
Access 288
Printer 80
Shipper 24
Data 13
Reports 8
Installation 6
Interface 1
Comparing Table 10 with Table 7 shows an overlap with regard to technical incidents and process support regarding orders and individual screens. This suggests that orders play a central role in accomplishing the business process for the system. Furthermore, the help desk seems to deal with a different range of issues from the systems group, suggesting that the two groups complement one another in their support duties. However, access issues are also important in both areas and their associated artifacts.
Volume 3, Number 2, December 2008
Table 11
Percentage of Total Help Desk Calls by Screen Access
Screen Criteria Total % Help Desk Calls
Top 10% Screens 68.01
Top 25% Screens 90.57
We also conducted a Pearson Product Moment correlation between the help desk calls and system use. The results were similar to the correlation between change controls and screen access. In particular, there was a correlation value of 0.539, which suggests a small positive association.
As indicated by the common elements in Table 7 and Table 10, there is not a strong relationship between the incidents handled by the systems group and the help desk. Here, the Pearson Product Moment value was 0.39, which does not indicate a strong relationship between the screens the two groups serviced.
5. CONCLUSIONS AND RECOMMENDATIONS
In this study, we have examined several different artifacts from the post- implementation phase of the software development life cycle in order to understand the interrelationships among the business process for the system, process support, and technical aspects of the system. The analysis of this data shows particularly strong relationships between user access patterns, the change requests, and the business process as characterized by the change requests. These relationships are also present between the technical maintenance of the system and process support activities. In each case, the top quartile of screens (those that make up the core business process) resulted in approximately 90% of the help desk calls, 87% of the system incident reports, and 78% of the change requests. These data suggest a strong alignment between the technical, business, and support aspects of the system with the core business process of the organization as posited by Leavitt’s model.
International Journal of Business and Information 6. FUTURE WORK
Although this work makes several important contributions to the understanding of the post-implementation phase of the software development life cycle and the relationship of its various components to the strategic alignment of the organization, there are further areas of research that can yield additional insights into this relationship for bespoke systems in industrial environments.
First, additional data sets from large-scale systems that are used in industrial settings would be helpful to understand whether it is possible to generalize the findings in this paper, based on additional data from other systems.
Second, an examination of the data in greater granularity may yield further insight into the nature of the maintenance process. In particular, examination of other fields in the system incident report may yield further insights into the nature of the incidents in the system.
Additionally, a qualitative analysis of the incident descriptions, help desk calls, and change control requests may provide further reinforcement or refinement of the ideas posited in the analysis section.
Finally, an examination of the data from a temporal standpoint may help to yield insights into the stability of the system over a period of time as shown with the distribution of incident fixes. Using a time based analysis would also allow a deeper examination of change controls as they relate to screen accesses.
7. ACKNOWLEDGMENTS
The author gratefully acknowledges the help and support of Dennis O. Holiday, Raymond Lauth, and David Rogers, who were instrumental in explaining the workings of the system and in providing the data for this paper. Further thanks are due to Jim Lawson, who generously provided system use data and to Dr. Errol Yudkos, who provided access to the statistical analysis software.
REFERENCES
[
1] Bersoff, E.H.; Henderson, V.D.; and Siegel, S.G. 1978. Software configuration management. In Proceedings of the Software Quality Assurance Workshop on Functional and Performance Issues, S. Jackson and J. A. Lockett, eds., 9-17.[2] Brooks, F.P., Jr. 1995. The Mythical Man-Month: Essays on Software Engineering, Addison Wesley.
[3] Bosch, J. 2004. Software variability management. In Proceedings of the 26th international Conference on Software Engineering (May 23-28, 2004). International Conference on Software Engineering. IEEE Computer Society, Washington, DC, 720-721.
Volume 3, Number 2, December 2008
[5] Calabough, J. 1987. Software configuration—An NP-complete problem. In Proceedings of the Conference on the 1987 ACM SIGBDP-SIGCPR Conference (Coral Gables, Florida, March 5-6, 1987). E. M. Awad, Ed. SIGCPR '87. ACM Press, New York, NY, 182-194.
[6] Chillakanti, P. 2004. Role-based information security: change management issues. In Proceedings of the 2004 International Symposium on information and Communication Technologies (Las Vegas, Nevada, June 16-18, 2004). ACM International Conference Proceeding Series, Vol. 90. Trinity College, Dublin, 134-139.
[7] Davis, A.M.; and Bersoff, E.H. 1991. Impacts of life cycle models on software configuration management, Commun. ACM 34(8), 104-118.
[8] Dietel, K. 2004. Mastering IT change management step two: Moving from ignorant anarchy to informed anarchy. In Proceedings of the 32nd Annual ACM SIGUCCS Conference on User Services (Baltimore, Maryland, October 10-13, 2004). SIGUCCS '04. ACM Press, New York, NY, 188-190.
[9] Edwards, H. Keith. 2006. System utilization and changes in implemented information systems: A case study, Proceedings of the International Multiconference of Engineers and Computer Scientists (Hong Kong, SAR PRC, June 20-22, 2006). IMECS 2006. Newswood Limited International Association of Engineers. ISBN 988-98671-3-3, pp. 833-839.
[10] Estublier, J.; Leblang, D.; Clemm, G.; Conradi, R.; van der Hoek, A.; Tichy, W.; and Wiborg-Weber, D. 2002. Impact of the research community for the field of software configuration management. In Proceedings of the 24th International Conference on Software Engineering (Orlando, Florida, May 19-25, 2002). ICSE '02. ACM Press, New York, NY, 643-644.
[11] Estublier, J.; Leblang, D.,;Clemm, G.; Conradi, R.; Tichy, W.; van der Hoek, A.; and Wiborg-Weber, D. 2002. Impact of the research community on the field of software configuration management: summary of an impact project report, SIGSOFT Softw. Eng. Notes 27(5), 31-39.
[12] Estublier, J. 2000. Software configuration management: A roadmap. In Proceedings of the Conference on the Future of Software Engineering (Limerick, Ireland, June 4-11, 2000). ICSE '00. ACM Press, New York, NY, 279-289.
[13] Feiler, R.P.P. 1990. Software process support through software configuration management. In Proceedings of the 5th International Software Process Workshop on Experience with Software Process Models (Kennebunkport, Maine, October 10-13, 1989). International Software Process Workshop. IEEE Computer Society Press, Los Alamitos, California, 58-60.
[14] Gentleman, W.M.; MacKay, A.; and Stewart, D.A. 1989. Commercial realtime software needs different configuation management. In Proceedings of the 2nd International Workshop on Software Configuration Management (Princeton, New Jersey, October 24-27, 1989), R.N. Taylor, ed., ACM Press, New York, NY, 152-161.
International Journal of Business and Information International Workshop on Mining Software Repositories (St. Louis, Missouri, May 17, 2005). MSR '05. ACM Press, New York, NY, 1-5.
[16] Joeris, G. 1997. Change management needs integrated process and configuration management. In Proceedings of the 6th European Conference Held Jointly with the 5th ACM SIGSOFT International Symposium on Foundations of Software Engineering
(Zurich, Switzerland, September 22-25, 1997). M. Jazayeri and H. Schauer, eds., Foundations of Software Engineering. Springer-Verlag New York, New York, NY, 125-141.
[17] Kim, S.;and Whitehead, E.J. 2006. How long did it take to fix bugs?. In Proceedings of the 2006 International Workshop on Mining Software Repositories (Shanghai, China, May 22- 23, 2006), MSR '06. ACM Press, New York, NY, 173-174.
[18] Koponen, Timo; and Lintula, Heli. 2006. Are the changes induced by the defect reports in the open-source software maintenance? Software Engineering Research and Practice 2006: 429-435
[19] Koponen, T. 2006. Evaluation framework for open-source software maintenance. In Proceedings of the International Conference on Software Engineering Advances (ICSEA’06). (October 29 - November 3, 2006, Tahiti, French Polynesia), IEEE Computer Society Press, p. 52.
[20] Koponen, T.; and Hotti, V. 2005. Open-source software maintenance process framework. In Proceedings of the Fifth Workshop on Open-Source Software Engineering (St. Louis, Missouri, May 17, 2005), 5-WOSSE. ACM Press, New York, NY, 1-5.
[21] Laudon, J.; and Laudon, K. 1998. Management Information Systems: New Approaches to Organizationand Technology. Prentice Hall Publishing..
[22] Leavitt, H. 1965. Applied organizational change in industry, In: March, J. (ed.), Handbook of Organizations, Chicago: Rand McNally, 1144-1170.
[23] Lutfiyya, H.L.; Marshall, A.D.; Bauer, M.A.; Martin, P., and Powley, W. 1997. Configuration maintenance for distributed applications management. In Proceedings of the 1997 Conference of the Centre for Advanced Studies on Collaborative Research (Toronto, Ontario, Canada, November 10-13, 1997), J.H. Johnson, ed., IBM Centre for Advanced Studies Conference. IBM Press, 16.
[24] Mei, H.; Zhang, L.; and Yang, F. 2001. A software configuration management model for supporting component-based software development, SIGSOFT Softw. Eng. Notes 26(2), 53-58.
[25] Minsky, N.H.; and Rozenshtein, D. 1990. Configuration management by consensus: an application of law-governed systems. In Proceedings of the Fourth ACM SIGSOFT Symposium on Software Development Environments (Irvine, California, December 3-5, 1990), R.N. Taylor, ed., SDE 4. ACM Press, New York, NY, 44-55.
Volume 3, Number 2, December 2008
[27] Nguyen, T.N.; Munson, E.V.; and Thao, C. 2004. Fine-grained, structured configuration management for Web projects. In Proceedings of the 13th International Conference on World Wide Web (New York, New York, May 17-20, 2004). WWW '04. ACM Press, New York, NY, 433-442.
[28] Nguyen, T.N.; Munson, E.V.; Boyland, J.T.; and Thao, C. 2005. An infrastructure for development of object-oriented, multi-level configuration management services. In Proceedings of the 27th international Conference on Software Engineering (St. Louis, Missouri, May 15-21, 2005), ICSE '05. ACM Press, New York, NY, 215-224.
[29] Nguyen, T.N.; Munson, E.V.; and Boyland, J.T. 2004. Object-oriented, structural software configuration management. In Companion to the 19th Annual ACM SIGPLAN Conference on Object-Oriented Programming Systems, Languages, and Applications (Vancouver, Britich Columbia, Canada, October 24-28, 2004), OOPSLA '04. ACM Press, New York, NY, 35-36.
[30] Parnin, C.; Görg, C.; and Rugaber, S. 2006. Enriching revision history with interactions. In Proceedings of the 2006 international Workshop on Mining Software Repositories (Shanghai, China, May 22-23, 2006), MSR '06. ACM Press, New York, NY, 155-158.
[31] Pressman, R. 2005. Software Engineering: A Practioner’s Approach, 6th Edition. McGraw Hill Publishing.
[32] Robles, G.; Gonzalez-Barahona, J.M.; Michlmayr, M; and Amor, J.J. 2006. Mining large software compilations over time: Another perspective of software evolution. In Proceedings of the 2006 International Workshop on Mining Software Repositories (Shanghai, China, May 22-23, 2006), MSR '06. ACM Press, New York, NY, 3-9.
[33] Sato, S.; and Panton, A. 2003. Using a change-management approach to promote customer-centered design. In Proceedings of the 2003 Conference on Designing for User Experiences (San Francisco, California, June 6-7, 2003), DUX '03. ACM Press, New York, NY, 1-11.
[34] Schuster, H.; Neeb, J.; and Schamburger, R. 1999. A configuration management approach for large workflow management systems. In Proceedings of the International Joint Conference on Work Activities Coordination and Collaboration (San Francisco, California, February 22-25, 1999). D. Georgakopoulos, W. Prinz, and A.L. Wolf, eds.
WACC '99. ACM Press, New York, NY, 177-186. DOI=
http://doi.acm.org/10.1145/295665.295686
[35] Shigo, O.; Wada, Y.; Terashima, Y.; Iwamoto, K.; and Nishimura, T. 1982. Configuration control for evolutional software products. In Proceedings of the 6th International Conference on Software Engineering (Tokyo, Japan, September 13-16, 1982). International Conference on Software Engineering. IEEE Computer Society Press, Los Alamitos, CA, 68-75.
International Journal of Business and Information [37] Śliwerski, J.; Zimmermann, T.; and Zeller, A. 2005. When do changes induce fixes? In Proceedings of the 2005 International Workshop on Mining Software Repositories (St. Louis, Missouri, May 17, 2005), MSR '05. ACM Press, New York, NY, 1-5.
[38] Śliwerski, J.; Zimmermann, T.; and Zeller, A. 2005. HATARI: Raising risk awareness. In Proceedings of the 10th European Software Engineering Conference Held Jointly with 13th ACM SIGSOFT International Symposium on Foundations of Software Engineering (Lisbon, Portugal, September 5-9, 2005), ESEC/FSE-13, ACM Press, New York, NY, 107-110.
[39] Sommerville, I. 1996. Sixth international workshop on software configuration management, SIGSOFT Softw. Eng. Notes 21(4), 54-57.
[40] Sommerville, I. 2007. Software Engineering, 8th Edition. Addison-Wesley Publishing.
[41] Thomas, I. 1989. Version and configuration management on a software engineering database. In Proceedings of the 2nd International Workshop on Software Configuration Management (Princeton, New Jersey, October 24-27, 1989), R.N. Taylor, ed., ACM Press, New York, NY, 23-25.
[42] Tsunoda, M.; Monden, A.; Yadohisa, H.; Kikuchi, N.; and Matsumoto, K. 2006. Productivity analysis of Japanese enterprise software development projects. In Proceedings of the 2006 International Workshop on Mining Software Repositories (Shanghai, China, May 22-23, 2006), MSR '06. ACM Press, New York, NY, 14-17.
[43] Xizhe, J. 2001. Evaluation techniques of software configuration management (poster session). In Proceedings of the 6th Annual Conference on innovation and Technology in Computer Science Education (Canterbury, United Kingdom), ITiCSE '01. ACM Press, New York, NY, 186. DOI= http://doi.acm.org/10.1145/377435.377707
[44] Zimmermann, T. 2006. Taking lessons from history. In Proceeding of the 28th international Conference on Software Engineering (Shanghai, China, May 20-28, 2006), ICSE '06. ACM Press, New York, NY, 1001-1005.
ABOUT THE AUTHOR