https://doi.org/10.5194/amt-11-5767-2018 © Author(s) 2018. This work is distributed under the Creative Commons Attribution 4.0 License.
Development and field testing of an online instrument for
measuring the real-time oxidative potential of ambient
particulate matter based on dithiothreitol assay
Joseph V. Puthussery, Chen Zhang, and Vishal Verma
Department of Civil and Environmental Engineering, University of Illinois at Urbana-Champaign, Urbana, 61801, USA Correspondence:Vishal Verma ([email protected])
Received: 26 April 2018 – Discussion started: 28 May 2018
Revised: 26 September 2018 – Accepted: 27 September 2018 – Published: 19 October 2018
Abstract. We developed an online instrument for measur-ing the oxidative potential (OP) of ambient particulate mat-ter (PM) using the dithiothreitol (DTT) assay. The instrument uses a mist chamber (MC) to continuously collect the ambi-ent PM2.5in water, and then determines its DTT activity
us-ing an automated syrus-inge pump system. The instrument was deployed at an urban site in the University of Illinois cam-pus, and its field performance was evaluated by comparing the results with the offline DTT activity measurements of simultaneously collected PM-laden filters. The online DTT activity measurements correlated well with the offline mea-surements but were higher than both methanol (slope=1.08,
R2=0.93) and Milli-Q water (slope=1.86,R2=0.86) ex-tracts of the PM filters, indicating a better efficiency of the MC for collecting the water-insoluble fraction of PM. The hourly measurements of ambient PM2.5 OP were obtained
by running the online instrument intermittently for 50 days with minimal manual assistance. The daytime DTT activ-ity levels were generally higher than at night. However, a 4-fold increase in the hourly averaged activity was observed on the night of 4 July (Independence Day fireworks display). The diurnal profile of the hourly averaged OP during week-days showed a bimodal trend, with a sharp peak in the morn-ing (around 07:00 LT), followed by a broader afternoon peak which plateaus around 14:00 LT and starts subsiding at night (around 19:00 LT).
To investigate the association of the diurnal profile of DTT activity with the emission sources at the site, we collected time-segregated composite PM filter samples in four differ-ent time periods of the day (morning, 07:00–10:00 LT; after-noon, 10:00–15:00 LT; evening, 15:00–19:00 LT; and night, 19:00–07:00 LT) and determined the diurnal variations in the
redox active components (i.e., water-soluble Cu, Fe, Mn, or-ganic carbon, elemental carbon, and water-soluble oror-ganic carbon). Based on this comparison, we attributed the day-time OP of ambient PM2.5to the vehicular (both exhaust and
non-exhaust) emissions and resuspended dust, whereas sec-ondary photochemical transformation of primary emissions appear to enhance the OP of PM during the afternoon and evening period.
1 Introduction
Several recent studies have used the oxidative potential (OP) of ambient particulate matter (PM) as an indicator of the aerosol toxicity (Li et al., 2003; Knaapen et al., 2004; Steen-hof et al., 2011; Bates et al., 2015; Tuet et al., 2016; Yang et al., 2016). The underlying hypothesis in these studies is that ambient particles upon inhalation can catalyze the generation of reactive oxygen species (ROS), creating a biochemical im-balance between oxidants and antioxidants which leads to a state of the cellular oxidative stress (Knaapen et al., 2004). This inherent property of the ambient PM to induce oxidative stress is supposed to be more closely associated with the PM-related adverse health effects (such as congestive heart fail-ure, myocardial infarction, asthma etc.) than conventionally used PM mass concentrations (Bates et al., 2015; Maikawa et al., 2016; Weichenthal et al., 2016; Yang et al., 2016; Abrams et al., 2017).
probes (such as 20,70-dichlorodihydrofluorescein diacetate, DCFH-DA) for measuring the PM-induced intracellular ROS in alveolar macrophages or other cell lines (Landreman et al., 2008; Saffari et al., 2014; Tuet et al., 2016). These as-says are laborious, complex, and require long analysis times (Dungchai et al., 2013). Cell-free assays, on the other hand, are easier to perform and provide a faster estimation of OP (Fang et al., 2015). The dithiothreitol (DTT) assay is one of the most widely used cell-free assays to measure the ambient particles’ OP, which has shown good correlation with sev-eral biological markers of PM-induced adverse health effects (Steenhof et al., 2011; Delfino et al., 2013; Bates et al., 2015; Tuet et al., 2016; Yang et al., 2016; Abrams et al., 2017). In the DTT assay, PM catalyzes the transfer of electrons from DTT to oxygen, generating superoxide radicals. The con-sumption of DTT over time, which is reported as the DTT activity or OP of the ambient PM, is assumed to be propor-tional to the concentration of redox active compounds in the PM sample (Kumagai et al., 2002; Cho et al., 2005).
Previous studies have suggested that OP of the ambient particles is affected by various factors such as PM composi-tion, size, and source (Li et al., 2003; Steenhof et al., 2011; Janssen et al., 2014; Tuet et al., 2016; Fang et al., 2017a). Moreover, few studies have also indicated that the ambient particles’ OP changes during the course of the day due to the influence of atmospheric processing and aging (Verma et al., 2009; Saffari et al., 2014). The conventional approach for measuring the DTT activity of ambient PM involves long-duration sampling (typically 24–72 h) using filters and ex-tracting them in a suitable medium (e.g., water or methanol) (Verma et al., 2012; Fang et al., 2015). The laborious and time-consuming protocol of these methods limit their appli-cations to only few samples, and thus make it almost impos-sible to fully capture the diurnal variations in the ambient particles’ OP. Another issue in measuring OP of the ambient particles collected over filters is related with the chemical sta-bility of the PM samples. Generally, PM collected over filters might undergo chemical alteration during sampling, storage, and extraction procedures, such as loss of semivolatile or-ganic (Daher et al., 2011) and inoror-ganic (Yao et al., 2001; Pathak et al., 2004) compounds and change in the oxida-tion state of metals, e.g., Mn (Majestic et al., 2007). Some of these components are known to directly contribute to OP (e.g., semivolatile organic compounds, Verma et al., 2009; Mn, Charrier and Anastasio, 2012), while others (e.g., inor-ganic ions) can affect it indirectly by altering the solubility of redox-active metals (Fang et al., 2017b). Therefore, OP measured on the archived filters might not be truly represen-tative of the real potential of ambient particles to generate ROS in a biological system after inhalation. For reducing some of these artifacts, certain researchers (e.g., Cho et al., 2005; Daher et al., 2011) used a liquid impinger (Biosampler, SKC-West Inc.) to collect the concentrated slurry of ambient aerosols and measured its OP using the DTT assay. The di-rect collection of particles into liquid helps to minimize the
PM loss during sampling and extraction processes. However, this method is not fully automated; i.e., frequent manual ob-servation is needed to maintain the optimum conditions for an upstream aerosol concentrator (Kim et al., 2001). More-over, it requires a relatively long sampling duration, i.e., at least 6 h, to collect enough volume of the concentrated slurry, making this approach unsuitable for obtaining highly time-resolved OP data for the ambient particles.
Over the past decade, various online instruments have also been developed for measuring the ROS associated with am-bient PM (Venkatachari and Hopke, 2008; Wang et al., 2011; Sameenoi et al., 2012; King and Weber, 2013; Wragg et al., 2016; Eiguren-Fernandez et al., 2017; Zhou et al., 2018). These instruments couple a direct aerosol into a water col-lection device, e.g., particle-into-liquid sampler (PILS), liq-uid spot sampler (LSS), or mist chamber (MC) to an ana-lytical system. However, most of these instruments measure the particle-bound ROS, which represents only a small part of the particles’ OP. To the best of our knowledge, only two online systems have been developed until now which mea-sure the OP based on DTT assay: Sameenoi et al. (2012) and Eiguren-Fernandez et al. (2017). Sameenoi et al. (2012) used a PILS coupled directly to a microfluidic electrochem-ical sensor for measuring the DTT activity of ambient parti-cles. The online system performance was tested in the lab us-ing standard reference dust and fly ash aerosolized samples. The measured DTT activity was reported to have a linear cor-relation with the aerosol concentration. Eiguren-Fernandez et al. (2017) used an LSS for particle collection, followed by its DTT activity determination in a traditional protocol (i.e., light absorbance spectroscopy). However, a major short-coming in these two studies was the lack or limited days of field measurements. The online system based on microfluidic electrochemical sensor (Sameenoi et al., 2012) was charac-terized only in the lab using simulated aerosol samples and has never been tested in the ambient environment (at least not reported in any publication). Meanwhile, the system de-veloped by Eiguren-Fernandez et al. (2017) was tested in the field for only 3 days (with 3 h time resolution), and the long-term stability of the system is yet to be evaluated.
Here, we discuss the development of an automated online instrument to measure the hourly averaged OP of ambient PM2.5using DTT assay and its evaluation in the field
condi-tions for over 50 days. A custom-built glass MC was used for collecting the ambient PM suspension, which is then trans-ferred to an automated analytical system for DTT activity determination. Our study reports, for the first time, the com-plete diurnal profile of the DTT activity of ambient PM2.5
at an hourly resolution, obtained from 50 days of field de-ployment of the instrument. The diurnal variations in DTT activity were further compared with the diurnal variations in PM2.5 chemical composition. The results presented in our
sources and their relative importance in assessing the risk from PM2.5exposure over the course of the day.
2 Materials and methods 2.1 Instrument set-up
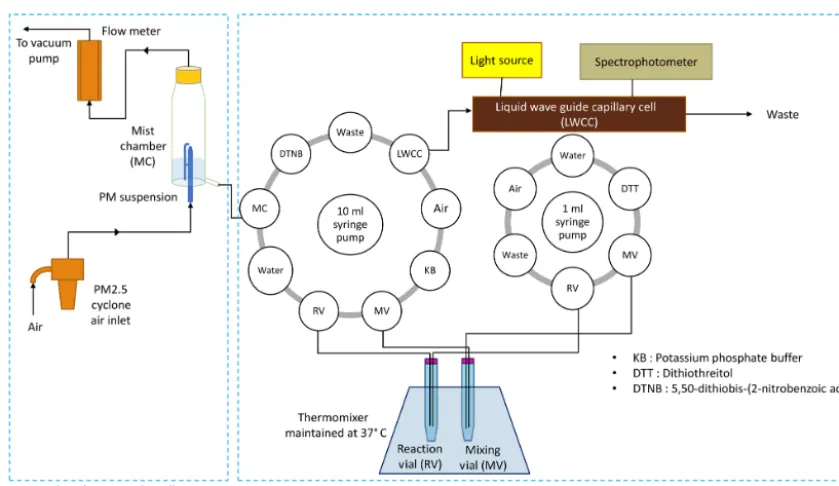
The basic layout of the instrument setup for measuring the PM2.5 OP is shown in Fig. 1. The entire system is housed
in a 1.83 m×1.22 m×0.61 m insulated aluminum chamber built by the Civil and Environmental Engineering Machine Shop of the University of Illinois at Urbana-Champaign (UIUC). The temperature inside the chamber is maintained at 18◦C using a portable air conditioner (Black and Decker BPACT14HWT). An MC was used for collecting the ambi-ent PM2.5suspension in water. MCs were originally designed
for collecting the water-soluble gases with Henry’s constant (KH) >103M atm−1 (Cofer et al., 1985; Spaulding et al.,
2002; Hennigan et al., 2009); however, few studies (Ander-son et al., 2008; King and Weber, 2013) have also used these devices for collecting the water-soluble fraction of the ambi-ent particles. Hennigan et al. (2009) estimated the collection efficiency of the MC as∼95 % using nitric acid aerosols at a flow rate of 21 L min−1. King and Weber (2013) also cal-culated the collection efficiency of the MC by operating it simultaneously with a PILS and measuring the sulfate col-lected by both systems. The collection efficiency in the MC was close to 100 % at flow rates greater than 25 L min−1. The MC used in this study was custom built in the glassblowing shop at UIUC and operated at a flow rate of 42 L min−1. Ex-act dimensions of the MC are given in Fig. S1 (Supplement). A 0.5 in. (OD) copper tube was used to connect the inlet port of the MC to a PM2.5 cyclone (University Research
Glass-ware (URG), Carrboro, NC, USA). The working principle for particle collection in MC is explained in previous studies (Anderson et al., 2008; King and Weber, 2013). In brief, a predetermined volume of Milli-Q water is added, such that the water level remains above the bottom tip of the capillary tube inside the MC. As air flows through the tapered inlet, air pressure drops at the capillary nozzle tip, which causes the water in the bottom reservoir to rise through the capillary tube and create a fine mist inside the chamber. This mist im-pinges on a 47 mm TefSep polytetrafluoroethylene (PTFE) membrane hydrophobic filter (1 µm pore size) (GVS Life Sciences, ME, USA) loaded in a filter pack (URG, Carrboro, NC, USA), attached at the top of the MC. The mist continu-ously washes the particles as they are collected onto the fil-ter, with some additional direct scrubbing from the airstream. The airflow exiting the hydrophobic filter was continuously measured by an inline flow meter (10–100 SLPM; Dwyer In-struments, MI, USA). The airflow rate eventually starts de-creasing with an inde-creasing PM loading on the filter, i.e., gradual accumulation of some water-insoluble PM, which is not recovered in the MC suspension. Typically, the flow rate
was found to decrease by approximately 10 % after 16 h of continuous operation of the MC in our case. Therefore, the filter was changed twice in a day (at 07:00 and 19:00 LT) to ensure a near-constant flow rate of 42 L min−1(±2.5 %). The online system couples the MC to an automated DTT activity determination system, consisting of two automated syringe pumps and a continuously shaken thermomixer (Fang et al., 2015; discussed in Sect. 2.2) as shown in Fig. 1.
2.2 Instrument operation and procedures
Figure 1.Layout of the online instrument for measuring the DTT activity of ambient PM2.5.
to the quantity of DTT left in the RV, the slope of the ab-sorbance versus time (five time points) gives the DTT con-sumption rate of the sample. This DTT concon-sumption rate was normalized by the volume of sampled air and reported in the units of nmol min−1m−3, referred hereafter as extrinsic DTT activity or OPex. The analytical part of the instrument along
with the MC was cleaned twice in a month by first replacing all the chemicals with methanol, followed by Milli-Q water, and then running the automated system script for a routine DTT assay protocol (five times with each solvent).
2.3 Field deployment of the instrument
The online instrument was deployed on the roof (height from the ground level ∼25 m) of a parking deck (north campus parking) located adjacent to a four-lane street (University Av-enue) in the university campus and operated intermittently for approximately 50 days (between 31 May and 16 Au-gust 2017). While the analytical part of the instrument mea-sured the DTT activity of a given PM suspension, the MC si-multaneously collected a new PM suspension. Thus, hourly measurements of ambient PM2.5 OPex were obtained with
minimal manual assistance, i.e., only for replacing the filters (twice in a day), resetting the computer program script (once in a day), and refilling the DTT solution (once in a day) and other reagents as needed (typically after 4–5 days).
2.4 Instrument blanks
Two different types of instrument blanks were analyzed in this study: system blanks and method blanks. The system blank was determined by filling Milli-Q water in the MC but without collecting any air sample; i.e., the vacuum pump re-mained switched off. The water rere-mained in MC for a few (2–3) minutes after which its DTT activity was measured by the analytical system. The method blank (particle free) was determined by connecting a high efficiency particulate air (HEPA) filter upstream of the MC and running it for 1 h. Thus, measured DTT activity in the method blank would be due to a possible contribution from water-soluble gases. System blanks were collected everyday (i.e., one blank per day), while method blanks were collected four times in a week during field deployment of the instrument (discussed in Sect. 3.2). Thus, a total of 50 system blanks and 28 method blanks were collected throughout the sampling period. 2.5 Instrument performance
2.6 Online versus offline system comparison
The DTT activity measurements from the online system were compared with a conventional filter sampling and extraction method followed by offline DTT activity analysis of the ex-tracts. Ambient filters (N=36), each for a duration corre-sponding to the MC sampling (i.e., 60 min), were collected for offline analysis from the same site (the roof of north cam-pus parking) on different days (see Table S1 in the Supple-ment), while the online instrument was also running continu-ously. The 47 mm TefSep hydrophobic filters (same as those used in the filter pack of the MC) were used for collecting PM2.5, at a flow rate of 42 L min−1. After each sampling
run, the filters were brought back to the lab and immediately stored in a freezer (−20◦C). All the filters were extracted
and analyzed within 12 h of sampling. Limited mass loadings on these filters did not allow us to extract each filter in both water and methanol. Therefore, 20 filters were extracted in Milli-Q water (1.75 mL volume per filter), while the remain-ing 16 filters were extracted in methanol by sonication (Cole-Parmer Ultrasonic Cleaner 8891, IL, USA) for 30 min. The methanol extracts were evaporated (to < 100 µL) by blowing high-purity nitrogen into the vial. The concentrated extracts were then reconstituted by adding Milli-Q water (final vol-ume: 1.75 mL). The samples were immediately analyzed for DTT activity by a semiautomated system developed in our lab (Xiong et al., 2017). Field blank filters (N=6) were similarly collected, processed (i.e., three filters extracted in Milli-Q water and three in methanol), and analyzed for the DTT activity.
2.7 Time-segregated composite sampling and chemical analysis
To infer the associations between the diurnal trend in the ambient PM2.5 DTT activity and PM2.5 chemical
compo-sition, time-segregated composite PM2.5samples were
col-lected for 10 weekdays in August 2017 (the exact dates are provided in the Supplement; Table S1). The composite sam-ples were collected onto both prebaked 8 in.×10 in. quartz filters (Tissuquartz 2500QAT-UP, Pall Life Sciences, Port Washington, NY; referred as QS thereafter) and 8 in.×10 in. Teflon filters (Zefluor PTFE membrane filters, Pall Labora-tory, NY; referred as TS thereafter) using two high volume samplers (HiVol, Tisch Environmental; nominal flow rate: 1.13 m3min−1, PM2.5impactor) at the same site. These
com-posite samples were collected in four different time periods of the day: morning (07:00–10:00 LT), afternoon (10:00 – 15:00 LT), evening (15:00–19:00 LT), and night (19:00 – 07:00 LT); i.e., the filters were changed four times in a day, but the same set of filters were used for all 10 days. Thus, a total of eight samples were collected: QS1 and TS1 (morn-ing; total hours of sampling: 30 h), QS2 and TS2 (afternoon; total hours of sampling: 50 h), QS3 and TS3 (evening; tal hours of sampling: 40 h), and QS4 and TS4 (night;
to-tal hours of sampling: 120 h). All samples were stored in a freezer at−20◦C between sampling intervals. The total
PM2.5mass loading on the filters was determined by
weigh-ing (both pre- and post-samplweigh-ing) the filters usweigh-ing a lab scale digital balance (±0.2 mg readability; A120S, Sartorius, Göt-tingen, Germany). Prior to weighing, the filters were equili-brated for 24 h at 20◦C and 50 % relative humidity (RH).
The concentrations of elemental carbon (EC) and organic carbon (OC) were measured on a small section (1 cm2)of the quartz filters as per National Institute for Occupational Safety and Health (NIOSH) protocol, using a thermal–optical trans-mittance (TOT) analyzer (Sunset Laboratory) (Birch and Cary, 1996). For the rest of the chemical analysis, Teflon filter punches (25 mm diameter) were extracted into Milli-Q water by sonication (30 min). The water-soluble organic carbon (WSOC) concentration in these extracts was mea-sured using a total organic carbon analyzer (TOC-VCPH, Shimadzu Co., Japan) (Wang et al., 2018). The concentra-tions of water-soluble Cu, Fe, and Mn in the extracts were determined by inductively coupled plasma mass spectrome-try (ICP-MS) (Perkin Elmer, Waltham, MA) (Yu et al., 2018).
3 Results and discussion
3.1 Calibration of the analytical system for DTT activity measurement
Before field deployment, the analytical measurement part of the online DTT instrument was calibrated by measuring DTT activity of 9,10-phenanthraquinone (PQN, Sigma-Aldrich, St. Louis, MO, USA; > 99 % purity). Here, the sampling part of the instrument, i.e., MC, was replaced with a 14-port multiposition valve (VICI®Valco Instrument Co. Inc., USA) to consecutively select different PQN standard solu-tions of known concentrasolu-tions for analysis. The linear plot of the DTT consumption rate (nmol min−1) versus PQN con-centration had a slope of 7.55±0.54, with a coefficient of de-termination (R2)of 0.98 (Fig. S2). The slope of calibration is very close to the slope obtained earlier by Fang et al. (2015) using a similar automated DTT system. During the field op-eration, the analytical part of the instrument was calibrated at least once in 15 days by following the same procedure, i.e., replacing the MC with the multiposition valve.
3.2 Effect of evaporation in MC on DTT activity of ambient PM
of the evaporative loss in MC on RH as seen in our study was not observed in previous studies (Hennigan et al., 2009, 2018; King and Weber, 2013). This is probably due to the significantly higher flow rate (42 L min−1) and longer sam-pling duration (60 min) adopted in our study as compared to previous studies (flow rate: 21–28 L min−1; sampling dura-tion ∼5 min). Therefore, the evaporative losses were mini-mal in those studies (Hennigan et al., 2009, 2018; King and Weber, 2013) but cannot be ignored in our case. To address this concern, the Kloehn control program script was modified to adjust the amount of water added to the MC at the begin-ning of each sampling run based on the forecasted hourly RH at the site (AccuWeather, 2018). Typically, the RH was highest (78±6 %) during night and early morning, and low-est (50±8 %) in the afternoon period. Table S2 shows the volume of water added to the MC for various ranges of RH observed at the sampling location. Adjusting this amount of water ensured at least 55 min of wet sampling (i.e., sampling PM with simultaneous mist formation) for each collected PM suspension, with the rest as the dry sampling. Note that a fraction of the particles collected during dry sampling is ex-tracted in the next run of wet sampling, which could lead to a small bias in the PM mass carried over to RV from the actual PM mass corresponding to a sampling run. However, this bias is not expected to be significant given a very low duration of dry sampling (< 5 min) out of the total 60 min of sampling.
The second concern associated with the evaporation of wa-ter is the variable volume of the PM suspensions collected after different sampling runs depending on the ambient RH, i.e., larger volume at high RH, while smaller volume at low RH. Note that evaporation can still continue (although sub-stantially slower than during mist formation) after the water level drops below the capillary level. Based on the design of the MC used in this study, final volume of the PM suspen-sion remaining inside the reservoir after the water level drops just below the capillary should be 1.75 mL. However, the vol-ume of PM suspensions obtained from MC during the field sampling was found to vary from 1.5 to 2 mL (i.e., within
±15 % of the theoretically designed volume of 1.75 mL; as observed from numerous trials in extreme RH conditions). We suspected that a variation in the sample volume could po-tentially affect the DTT activity measurements in the RV. To quantify this effect, we conducted a laboratory study where we measured the DTT activity of a PM extract in different re-action volumes, but which all contained the same amount of PM mass. Six circular punches (4.9 cm2each) from a PM2.5
-laden HiVol quartz filter (24 h sample collected from the same site) were extracted in 35 mL of Milli-Q water by soni-cation for 30 min. The extract was filtered by passing through a 0.45 µm PTFE syringe filter (Fisherbrand™, Fisher Scien-tific, PA, USA). A total of 0.875 mL aliquot of this filtered extract was added in 12 different sample vials, which ensured the same PM2.5mass in each vial. To the reference sample
vial, 0.875 mL Milli-Q water was added to make the total
sample volume 1.75 mL (equivalent to the theoretically de-signed volume of the PM suspension obtained from MC af-ter 1 h of sampling). To the remaining sample vials, different amounts of Milli-Q water (0, 0.175, 0.35, 0.525, 0.7, 1.05, 1.225, 1.4, 1.575, and 1.75 mL) were added to obtain vari-able sample volumes (0.875, 1.05, 1.225, 1.4, 1.575, 1.925, 2.1, 2.275, 2.45, and 2.625 mL). This experiment simulated the changes in the volume of PM suspensions obtained from MC due to evaporation. The DTT activities of all these sam-ples were then measured (in triplicates) using the semiauto-mated system in our lab. The same experiment was repeated for three more PM2.5filters, and all the results are compiled
in Fig. S3. As expected, there is an overall inverse trend in the DTT activity versus sample volume; samples contain-ing larger volumes showed lower DTT activity than those containing smaller volumes. However, maximum bias in the activity for a 20 % variation in the sample volume was less than 6 % (average 3±3 %); therefore, this small bias was ne-glected for the purpose of this study. Note that a larger varia-tion in the sample volume could significantly affect the mea-surement of DTT activity (e.g., bias > 12 % for a 50 % vari-ation in the sample volume, as shown in Fig. S3). Therefore, an appropriate control, e.g., a Nafion or a diffusion dryer, should be used upstream of MC at locations where the ambi-ent RH can vary substantially and more abruptly to minimize its impact on the variations in sample volume and subsequent bias in the DTT activity measurement.
3.3 Blanks and limit of detection (LOD)
The average (±1σ )system and method blanks obtained by the instrument were 0.32±0.06 and 0.33±0.08 nmol min−1,
res-idence time (72 ms) in our MC, leading to their insignificant concentration in the MC suspension.
3.4 Online instrument results versus filter measurements
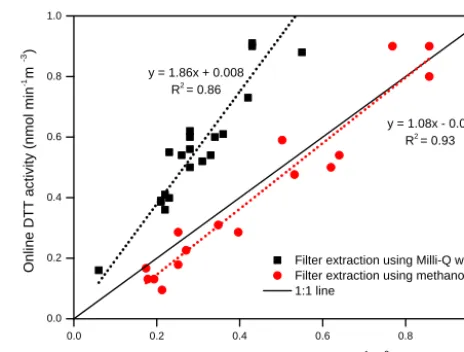
Figure 2 shows a comparison of the results obtained by the online instrument with the DTT activity measured on the water and methanol extracts of the filters (47 mm), which were simultaneously collected while running the instrument. The online measurements from the instrument have a high coefficient of determination (R2> 0.80) with the results ob-tained by offline filter extraction method, both using Milli-Q water and methanol. The slope for the water extraction versus online measurement was 1.86 (R2=0.86;p< 0.001;
N =20), while methanol extracts of the PM filters showed a much better agreement with the online system (slope=1.08;
R2=0.93;p< 0.001;N=16). This is probably due to a sig-nificant contribution from some water-insoluble PM compo-nents in MC, which otherwise remain embedded in the filter fibers and are poorly extracted in water by sonication. Re-cently, Gao et al. (2017) also reported a ratio of the DTT activity measured on the water-soluble extracts of the ambi-ent PM filters collected from Atlanta, USA, to the total OPex
(i.e., DTT oxidation performed directly on the filter) as 1.54– 1.72. Additionally, the ratio of the DTT activity measured on methanol-soluble extracts of the filters to the total OPexwas
1.06–1.1. The higher OPex measured directly on the filters
was attributed to the contribution from the water-insoluble PM fraction that remained on the filters, which is not fully extracted even by methanol. The lower DTT activity mea-sured by offline filter extraction method in our study could also be due to the loss of redox-active semivolatile species and other chemical alterations in the collected PM during storage (Yao et al., 2001; Pathak et al., 2004; Daher et al., 2011) and extraction of the filters by sonication (Roper et al., 2015). Collectively, our results, which are very similar to Gao et al. (2017), demonstrate a much better efficiency of the MC for OP measurements as compared to conventional filter sampling and extraction protocols.
3.5 Time series of the ambient PM2.5DTT activity
Figure 3 shows the time series of the hourly ambient PM2.5
DTT activity (blank corrected) measured by the online strument between 31 May and 16 August 2017. The in-strument was almost continuously operated for collecting the ambient data (except a few days for method or de-nuder blanks and calibration of the analytical part) between 31 May and 11 July 2017, followed by a break of 22 days (12 July–3 August 2017) before running it again for 13 days in the month of August 2017. The average (±1σ )DTT ac-tivity obtained during the entire sampling period was 0.33±
0.19 nmol min−1m−3, which is in typical range of the total OPexas observed in Atlanta (0.2–0.4 nmol of DTT min m−3;
0.0 0.2 0.4 0.6 0.8 1.0
0.0 0.2 0.4 0.6 0.8 1.0
y = 1.08x - 0.07 R2 = 0.93
y = 1.86x + 0.008 R2 = 0.86
Filter extraction using Milli-Q water Filter extraction using methanol 1:1 line
O
nl
in
e
D
T
T
a
ct
iv
ity
(
nm
ol
m
in
m
-3
)
Offline DTT activity (nmol min m ) -3
-1
-1
Figure 2.Comparison of the DTT activity obtained from the on-line instrument with the traditional filter collection and extraction methodology (i.e., offline DTT activity analysis of the PM extracts).
Gao et al., 2017) and is higher than the water-soluble OPex
measured at the same site (0.04–0.18 nmol of DTT min m−3)
in our previous studies (Xiong et al., 2017; Wang et al., 2018; Yu et al., 2018). Around 65 % of the hourly measurements of DTT activity were above the instrument LOD. However, measurements during the weekends were mostly below the LOD. The low activity over the weekends is possibly due to less vehicular traffic, resulting in lower PM2.5emissions.
Ad-ditionally, very low DTT activity (or below LOD) was mea-sured on days with exceptionally high RH (> 90 %) and dur-ing rain events, probably due to reduced PM2.5
concentra-tions (Lou et al., 2017). A significant diurnal variation in the DTT activity can also be inferred from the time-series plot, with nighttime measurements generally lower than the day-time levels (except a few peaks, e.g., on 4 and 5 July 2017). A more detailed analysis of the diurnal trend of DTT activity is provided in Sect. 3.6.
The fireworks display during the Independence Day (4 July 2017) celebration in Champaign County had a pro-nounced effect on the ambient PM2.5 OPex. The DTT
ac-tivity measured on the night of 4 July and the follow-ing 2 days, showed a significantly elevated value (peak value 1.4 nmol min−1m−3), which was approximately 4 times the average DTT activity obtained during the entire sampling period. This is probably due to an overall increase in the ambient PM2.5concentration emitted from
firecrack-ers. The PM2.5concentration measured at a nearby
Environ-mental Protection Agency (EPA) monitoring site (Bondville, located∼8 miles from the study area) reported an increase of 124 %, 42 %, and 49 % in the average PM2.5concentration
Figure 3.Time-series plot of the DTT activity from 31 May to 16 August 2017. The shaded portions in the graph are weekend DTT activity measurements. The instrument was not operated between 12 July and 3 August 2017 (shown as a break in thexaxis).
ambient Cu and Mn concentration in the local background PM2.5 after a firework pollution episode in Bhilai, India.
Note that Cu and Mn are among the most important metals in PM, which have been reported to be associated with the DTT activity (Charrier and Anastasio, 2012).
3.6 Diurnal profile of the ambient PM2.5OPexand
chemical components
One of the primary motivations for developing the online instrument was to discern the diurnal variations in ambi-ent PM2.5 OPex so that it could be better linked with the
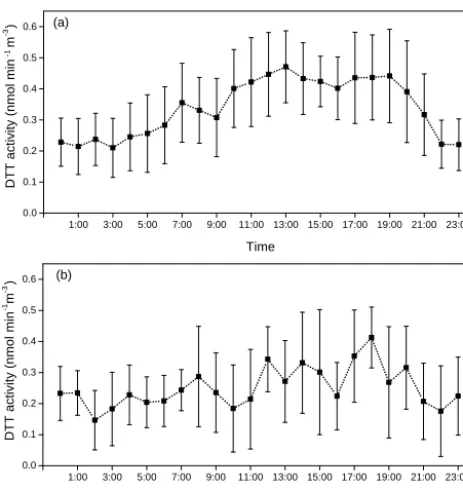
chemical components and their emission sources. Therefore, hourly data obtained by running the instrument for 28 days (between 31 May and 2 July 2017) was composited to ob-tain a diurnal profile of the DTT activity as shown in Fig. 4. The diurnal profiles were separately plotted for the weekdays and weekends in Fig. 4a and b, respectively. The diurnal pro-file of OPex in weekdays appears to have a trimodal trend
with peaks at 07:00–08:00 LT, 12:00–13:00 LT, and 18:00– 19:00 LT. The highest peak was observed around 13:00 LT, and the night time nadir was around 03:00 LT. In contrast, the weekend diurnal profile appears to be flat with no clear trend. To test if the identified peaks in the diurnal profile of DTT activity are statistically significant (given the large vari-ation in day-to-day activity), we first performed a single fac-tor ANOVA test (SPSS, V24.0.0.0) on all points of the di-urnal plot (N=24). The diurnal profile for the weekends did not yield any statistically significant peak (F =1.51,
Fcritical=1.59, p=0.07) for the entire data. However, F
value obtained for the weekday diurnal profile data was
higher than the critical F value (F =6.38,Fcritical=1.56,
p< 0.01) indicating significant differences in certain hourly measurements during weekdays. To further test the statistical significance of the three identified peaks in the diurnal profile for weekdays, we conducted a Student’sttest between differ-ent pairs of the hourly data. For example, all 07:00 LT mea-surements were compared with 05:00 and 09:00 LT measure-ments, 13:00 LT measurements were compared with 09:00 and 16:00 LT measurements, and the 19:00 LT peak was compared with 13:00, 16:00, and 21:00 LT data, individu-ally. The measurements at 07:00 LT were found to be statisti-cally different from 05:00 and 09:00 LT (p< 0.05). Similarly, the measurements at 09:00 and 13:00 LT were also statis-tically different (p< 0.01). Although, the difference among the 13:00, 16:00, and 19:00 LT data was not statistically dif-ferent (p=0.16 fort test between 13:00 and 16:00 LT, 0.45 between 16:00 and 19:00 LT, and 0.58 between 13:00 and 19:00 LT), the 19:00 and 21:00 LT measurements were sta-tistically different (p< 0.05). Thus, it was inferred based on these tests that the diurnal OPex trend is actually bimodal
with the first peak during the morning period, followed by an afternoon peak which flattens out (i.e., extends from 13:00 to 19:00 LT, but with a slight dip at 16:00 LT), before subsiding at night (around 21:00 LT).
To further investigate the diurnal profile of the DTT ac-tivity and its association with various emission sources at the site, we analyzed the chemical composition of the PM2.5
1:00 3:00 5:00 7:00 9:00 11:00 13:00 15:00 17:00 19:00 21:00 23:00 0.0
0.1 0.2 0.3 0.4 0.5 0.6
1:00 3:00 5:00 7:00 9:00 11:00 13:00 15:00 17:00 19:00 21:00 23:00 0.0
0.1 0.2 0.3 0.4 0.5 0.6
(a)
D
T
T
a
ct
iv
ity
(
nm
ol
m
in
m
-3
)
Time
(b)
D
T
T
a
ct
iv
ity
(
nm
ol
m
in
m
-3
)
Time
-1
-1
Figure 4.Diurnal profile of the ambient PM2.5DTT activity
mea-sured at the sampling site over (a)weekdays (n=18 days) and (b)weekends (n=10 days). The data from 31 May to 2 July 2017 were used for plotting this profile. Error bars are the standard devi-ation (1σ )of the average DTT activity in that hour.
the diurnal profile in DTT activity obtained by the instrument during the time-segregated sampling (Fig. S4) had a similar trend as obtained in the month of June (Fig. 4). We measured the concentration of key chemical species, i.e., WSOC, OC, EC, and transition metals (Cu, Mn, and Fe), which have all been shown to be associated with the DTT activity (Charrier and Anastasio, 2012; Saffari et al., 2014; Verma et al., 2014; Yang et al., 2014) in our time-segregated samples, along with the PM mass, to infer their diurnal variations and compare it with that in the DTT activity. The average PM2.5
concen-tration during the time-segregated sampling was 7.8±0.16, 8.5±0.36, 8.1±0.16, and 7.6±0.29 µg m−3(not shown) for the morning, afternoon, evening, and night samples, respec-tively. Given that there are no substantial variations in PM2.5
mass concentrations, the diurnal variations in the DTT ac-tivity are hypothesized to be mainly attributed to the vary-ing chemical composition of PM2.5resulting from different
emission sources at the site.
3.6.1 Carbonaceous aerosol
Figure 5 shows PM2.5carbonaceous content, in terms of the
ambient concentrations of EC, OC, and WSOC during time-segregated sampling. EC can be assumed as a marker of the exhaust emissions from diesel vehicles (Shah et al., 2004; Shirmohammadi et al., 2016). EC showed a peak in the morn-ing and also at night. The mornmorn-ing peak coincided with the
rush hour traffic and can be attributed to the vehicular emis-sions. It then subsides in the afternoon and remains constant till evening, before increasing again at night. Based on our personal observation, vehicular traffic is almost negligible after 22:00 LT at this location. Therefore, the EC peak ob-served at night is probably a result of the decrease in atmo-spheric mixing height at the site (Liu and Liang, 2010). The lower temperature and higher relative humidity (average val-ues 19◦C and 78 % at night (19:00–07:00 LT) compared to 27◦C and 48 % in daytime during the time-segregated sam-pling) might have resulted in limited atmospheric mixing at night. Furthermore, EC has been reported to be distributed uniformly in the vertical direction and is thus greatly influ-enced by the atmospheric mixing height (Lin et al., 2009; Mues et al., 2017). A similar pattern in EC (i.e., peaks in morning and late evening) has been reported in a few other studies (Mues et al., 2017; Sharma et al., 2017; Singh et al., 2018), where the lower concentrations in daytime were at-tributed to a higher mixing height and stronger turbulence than at nighttime. Note that our nighttime composite filter was sampled from 19:00 to 07:00 LT, thus probably including part of the EC from evening rush hour traffic which is trapped in the lowered mixing height at night. Overall, the diurnal trend in EC does not follow the trend in DTT activity, which indicates a negligible role of EC in determining the DTT ac-tivity at this location. These results contrast with earlier stud-ies showing a high correlation between EC and DTT activity (Verma et al., 2012; Gao et al., 2017). However, it should be noted that EC concentrations measured in this study (0.15– 0.24 µg m−3)were much lower than the values reported by other studies conducted at similar urban locations. For in-stance, Verma et al. (2014) reported a monthly averaged sum-mer EC concentration of 0.75±0.25 µg m−3in Atlanta, while
the concentrations in the range of 0.4–0.52 µg m−3were re-ported for the samples collected in Los Angeles during sum-mer 2012 (Shirmohammadi et al., 2016). Therefore, the EC concentration at our sampling location is probably too low to make a significant contribution in the DTT activity. Ad-ditionally, fresh EC is less active and needs to be oxidized to participate in the DTT assay as indicated by Antiñolo et al. (2015), which reported an almost exponential increase in the DTT activity of soot particles after exposure to high lev-els (> 1012molecule cm−3h) of ozone. Given the PM2.5
col-lected at the site, which is adjacent to a roadway, contain mostly fresh and unoxidized EC, it probably leads to a poor association between the diurnal trends in EC and DTT activ-ity in our study.
The secondary organic aerosols (SOAs) formed by photo-chemical reactions have been reported as one of the major contributor to the ambient PM2.5 OP (Snyder et al., 2009;
0.00 0.05 0.10 0.15 0.20 0.25 0.30 Night Evening Afternoon E C ( µ g m -3) Morning
EC (µg m -3) OC (µg m -3
) WSOC (µg m -3) OC/EC WSOC/EC
0.0 0.5 1.0 1.5 2.0 2.5 3.0 3.5 O C a n d W S O C ( µ g m -3) 0 2 4 6 8 10 12 14 16 18 20 22 24 (O C /E C ) a n d ( W S O C /E C )
Figure 5.Diurnal trend in the ambient concentrations of carbona-ceous aerosols, i.e., EC, OC, and WSOC, and the ratio of OC/EC and WSOC/EC, as measured from the time-segregated integrated filters. Error bars denote standard deviation (1σ )of the triplicate measurements.
(Cabada et al., 2004). As depicted in Fig. 5, neither OC nor WSOC show any diurnal pattern. Figure 5 also shows the OC/EC ratio which peaked in the afternoon. Considering a higher mixing height and relatively lower traffic in the after-noon than morning, an elevated OC/EC ratio indicates an additional OC contribution, which compensates its decrease from reduced vehicular emissions and enhanced atmospheric mixing. We attribute this additional OC to the secondary particle formation via photochemical reactions, which keeps the OC concentration almost constant throughout the day. Figure S5 shows a diurnal profile of ozone measured at Bondville (EPA site). The ozone concentration peaked from 11:00 to 18:00 LT, indicating secondary formation of par-ticles in the afternoon period. To further confirm the con-tribution from SOA to OC, the WSOC/EC ratio was also plotted (Fig. 5), which ranged from 6.6 (morning) to 11.3 (evening) and followed a similar diurnal profile as ozone or the OC/EC ratio. Thus, the broad peak in DTT activity dur-ing afternoon and evendur-ing periods could partly be caused by the redox-active SOA components.
3.6.2 Trace metals
Vehicular sources, which include both direct exhausts and non-tailpipe emissions (e.g., brake and tire wear, abrasion of the road surface, and resuspension of road dust) contribute majorly to the concentration of trace metals in the atmo-sphere (Thorpe and Harrison, 2008). Hulskotte et al. (2007) identified brake wear as one of the main sources of airborne Cu emission. In addition, resuspended road dust is a mix-ture of various elements including the redox-active transition metals (e.g., Cu, Mn, and Fe) (Wang et al., 2005; Thorpe and Harrison, 2008; Chen et al., 2012). Figure 6 shows the ambi-ent concambi-entrations of three metals, i.e., Cu, Mn, and Fe
mea-Morning Afternoon Evening Night
0 5 10 15 20 25 30 C o n ce n tr a tio n ( n g m -3) Cu Fe Mn
Figure 6.Diurnal trend in the ambient concentrations of metals, i.e., Cu, Fe, and Mn, as measured from the time-segregated integrated filters. Error bars denote standard deviation (1σ )of the triplicate measurements.
sured at the sampling site. The concentrations of Cu varied between 4 and 22 ng m−3, and was comparable to the con-centrations reported in other studies conducted in urban ar-eas (Verma et al., 2009, 2014). However, the concentration of Fe (3.7–6.9 ng m−3)was significantly lower than reported in other studies. Fe concentrations typically found in urban atmospheres are in the range of 90–280 ng m−3 (Verma et
al., 2009, 2014; Xia and Gao, 2011). The concentration of Mn at this site was very low (≤1.1 ng m−3)during the entire sampling period.
Both Cu and Fe followed a very similar diurnal trend as the DTT activity (Fig. 4), with highest concentration in the after-noon and lowest at night. The difference in the diurnal trends of metals and EC concentrations (i.e., EC peaks in the morn-ing, while metals peak in the afternoon) indicates a lesser influence of direct vehicular exhausts on the metal concentra-tions than the resuspended dust, which is generally driven by higher vehicular speeds (due to relatively lower traffic) and drier conditions in the afternoon (Pant and Harrison, 2013). Figure S6 shows the diurnal pattern of ambient RH at the sampling site. The very high RH (> 75 %) substantially sup-presses the dust resuspension and the resultant metal concen-trations during nighttime. A close similarity of the diurnal profile of the water-soluble metals with DTT activity sug-gests a significant contribution of both vehicular emissions (the morning peak) and resuspended dust (in the afternoon) to PM2.5OPexat the sampling site.
4 Conclusions
We developed and field-tested an online instrument for the near real-time measurement of ambient PM2.5OPexwith an
an MC designed to collect PM2.5suspension in water. The
MC, equipped with a hydrophobic filter collects PM2.5
sus-pension by generating a fine mist of water, which scrubs the particles, both directly from air and from those collected onto the filter. The PM suspension collected in MC is then fed to an automated analytical system for the measurement of DTT activity.
The OPex data collected using the online instrument
showed a strong correlation (R2> 0.8;p< 0.001) with the measurements obtained by the conventional filter sampling and extraction (in water and methanol) methodology. How-ever, the online instrument yielded higher DTT activity than both water-extracted filters (slope=1.86,N=20) and methanol-extracted filters (slope=1.08, N=16). We at-tribute this higher DTT activity to the contribution from water-insoluble components, which are more effectively col-lected in MC than the conventional filter sampling and ex-traction protocol. The instrument was tested in the field for 50 days in summer 2017 with minimal manual assistance. The instrument’s LOD as tested under field conditions is 0.24 nmol min−1, and around 65 % of the hourly DTT ac-tivity measurements during field sampling were above the LOD. Substantially lower DTT activity levels (i.e., either be-low or very close to LOD) were observed on the days with very high RH (> 90 %) or rain events. Interestingly, the DTT activity showed a 4-fold increase on the night of 4 July (Inde-pendence Day), caused by the fireworks display, as compared to the average OPexmeasured during the entire sampling
pe-riod.
The hourly data collected during field sampling allowed us to plot the first-ever recorded diurnal profile of the DTT activity of ambient PM2.5. The diurnal profile for weekdays
showed a bimodal trend with the first peak in the morning (around 07:00 LT), followed by a broad peak (extending from 13:00 to 19:00 LT, but with a slight dip at 16:00 LT) during afternoon and early evening periods. We further investigated this bimodal profile of ambient PM2.5DTT activity in
rela-tion to the diurnal variarela-tion in PM2.5chemical composition
by collecting time-segregated composite filters for 10 con-secutive weekdays. By comparison of the DTT activity with various chemical components, i.e., OC, EC, WSOC, Cu, Fe, and Mn, the morning peak in DTT activity profile was at-tributed to the vehicular sources (exhausts and non-exhausts), whereas both secondary formation (i.e., SOA) and resus-pended dust seem to contribute to the afternoon peak. Over-all, the extensive field testing of the instrument in our study demonstrates its stability and consistency to yield the long-term measurements of ambient PM2.5OPex. Further studies
in this direction should be aimed to integrate the highly time-resolved data obtained by online instruments for measuring the PM2.5 OP and chemical composition and thus infer the
diurnal contribution of various emission sources in the risk associated with PM2.5exposure.
Data availability. Data used in this paper can be provided upon
re-quest by email to Vishal Verma ([email protected]).
Supplement. The supplement related to this article is available
online at: https://doi.org/10.5194/amt-11-5767-2018-supplement.
Author contributions. JVP designed the instrument, led the the
sampling campaign, performed the experiments, and wrote the manuscript. CZ helped in the filter collection and in conducting the DTT activity experiments. VV conceived the idea, organized the manuscript, and supervised the project.
Competing interests. The authors declare that they have no conflict
of interest.
Acknowledgements. This work was supported from Vishal Verma’s
start-up fund by the Department of Civil and Environmental Engineering at University of Illinois Urbana-Champaign. We thank Michelle Wahl (parking director) for providing us the site for measurement.
Edited by: Mingjin Tang
Reviewed by: four anonymous referees
References
Abrams, J. Y., Weber, R. J., Klein, M., Samat, S. E., Chang, H. H., Strickland, M. J., Verma, V., Fang, T., Bates, J. T., Mulholland, J. A., Russell, A. G., and Tolbert, P. E.: Associations between ambient fine particulate oxidative potential and cardiorespira-tory emergency department visits, Environ. Health Persp., 125, 107008, https://doi.org/10.1289/EHP1545, 2017.
AccuWeather: AccuWeather Forecast, available at: https://www. accuweather.com/en/us/urbana-il/61801/weather-forecast/ 328764 last access: 10 April 2018.
Anderson, C. H., Dibb, J. E., Griffin, R. J., Hagler, G. S. W., and Bergin, M. H.: Atmospheric water-soluble organic carbon mea-surements at Summit, Greenland, Atmos. Environ., 42, 5612– 5621, https://doi.org/10.1016/j.atmosenv.2008.03.006, 2008. Antiñolo, M., Willis, M. D., Zhou, S., and Abbatt, J. P. D.:
Con-necting the oxidation of soot to its redox cycling abilities, Nat. Commun., 6, 6812, https://doi.org/10.1038/ncomms7812, 2015. Bates, J. T., Weber, R. J., Abrams, J., Verma, V., Fang, T., Klein, M., Strickland, M. J., Sarnat, S. E., Chang, H. H., Mulholland, J. A., Tolbert, P. E., and Russell, A. G.: Reactive Oxygen Species Generation Linked to Sources of Atmospheric Particulate Mat-ter and Cardiorespiratory Effects, Environ. Sci. Technol., 49, 13605–13612, https://doi.org/10.1021/acs.est.5b02967, 2015. Birch, M. E. and Cary, R. A.: Elemental Carbon-Based
Cabada, J. C., Pandis, S. N., Subramanian, R., Robinson, A. L., Polidori, A., and Turpin, B.: Estimating the Sec-ondary Organic Aerosol Contribution to PM2.5 Using the EC Tracer Method Special Issue of Aerosol Science and Technology on Findings from the Fine Particulate Mat-ter Supersites Program, Aerosol Sci. Technol., 38, 140–155, https://doi.org/10.1080/02786820390229084, 2004.
Charrier, J. G. and Anastasio, C.: On dithiothreitol (DTT) as a mea-sure of oxidative potential for ambient particles: evidence for the importance of soluble transition metals, Atmos. Chem. Phys., 12, 9321–9333, https://doi.org/10.5194/acp-12-9321-2012, 2012. Chen, J., Wang, W., Liu, H., and Ren, L.:
Determina-tion of road dust loadings and chemical characteristics us-ing resuspension, Environ. Monit. Assess., 184, 1693–1709, https://doi.org/10.1007/s10661-011-2071-1, 2012.
Cheung, K., Shafer, M. M., Schauer, J. J., and Sioutas, C.: Di-urnal trends in oxidative potential of coarse particulate mat-ter in the Los Angeles basin and their relation to sources and chemical composition, Environ. Sci. Technol., 46, 3779–3787, https://doi.org/10.1021/es204211v, 2012.
Cho, A. K., Sioutas, C., Miguel, A. H., Kumagai, Y., Schmitz, D. A., Singh, M., Eiguren-Fernandez, A., and Froines, J. R.: Redox activity of airborne particulate matter at different sites in the Los Angeles Basin, Environ. Res., 99, 40–47, https://doi.org/10.1016/j.envres.2005.01.003, 2005.
Cofer, W. R., Collins, V. G., and Talbot, R. W.: Im-proved Aqueous Scrubber for Collection of Soluble Atmo-spheric Trace Gases, Environ. Sci. Technol., 19, 557–560, https://doi.org/10.1021/es00136a012, 1985.
Daher, N., Ning, Z., Cho, A. K., Shafer, M., Schauer, J. J., and Sioutas, C.: Comparison of the chemical and oxidative charac-teristics of particulate matter (PM) collected by different meth-ods: Filters, impactors, and BioSamplers, Aerosol Sci. Technol., 45, 1294–1304, https://doi.org/10.1080/02786826.2011.590554, 2011.
Delfino, R. J., Staimer, N., Tjoa, T., Gillen, D. L., Schauer, J. J., and Shafer, M. M.: Airway inflammation and oxidative potential of air pollutant particles in a pediatric asthma panel, J. Expo. Sci. Env. Epid., 23, 466–473, https://doi.org/10.1038/jes.2013.25, 2013.
Dungchai, W., Sameenoi, Y., Chailapakul, O., Volckens, J., and Henry, C. S.: Determination of aerosol oxidative activity us-ing silver nanoparticle aggregation on paper-based analytical de-vices, Analyst, 138, 6766, https://doi.org/10.1039/c3an01235b, 2013.
Eiguren-Fernandez, A., Kreisberg, N., and Hering, S.: An online monitor of the oxidative capacity of aerosols (o-MOCA), Atmos. Meas. Tech., 10, 633–644, https://doi.org/10.5194/amt-10-633-2017, 2017.
Fang, T., Verma, V., Guo, H., King, L. E., Edgerton, E. S., and Weber, R. J.: A semi-automated system for quantifying the ox-idative potential of ambient particles in aqueous extracts us-ing the dithiothreitol (DTT) assay: results from the Southeast-ern Center for Air Pollution and Epidemiology (SCAPE), At-mos. Meas. Tech., 8, 471–482, https://doi.org/10.5194/amt-8-471-2015, 2015.
Fang, T., Zeng, L., Gao, D., Verma, V., Stefaniak, A. B., and We-ber, R. J.: Ambient Size Distributions and Lung Deposition of Aerosol Dithiothreitol-Measured Oxidative Potential: Contrast
between Soluble and Insoluble Particles, Environ. Sci. Technol., 51, 6802–6811, https://doi.org/10.1021/acs.est.7b01536, 2017a. Fang, T., Guo, H., Zeng, L., Verma, V., Nenes, A., and
We-ber, R. J.: Highly Acidic Ambient Particles, Soluble Met-als, and Oxidative Potential: A Link between Sulfate and Aerosol Toxicity, Environ. Sci. Technol., 51, 2611–2620, https://doi.org/10.1021/acs.est.6b06151, 2017b.
Gao, D., Fang, T., Verma, V., Zeng, L., and Weber, R. J.: A method for measuring total aerosol oxidative potential (OP) with the dithiothreitol (DTT) assay and comparisons between an urban and roadside site of water-soluble and total OP, At-mos. Meas. Tech., 10, 2821–2835, https://doi.org/10.5194/amt-10-2821-2017, 2017.
Hennigan, C. J., Bergin, M. H., Russell, A. G., Nenes, A., and Weber, R. J.: Gas/particle partitioning of water-soluble or-ganic aerosol in Atlanta, Atmos. Chem. Phys., 9, 3613–3628, https://doi.org/10.5194/acp-9-3613-2009, 2009.
Hennigan, C. J., El-Sayed, M. M. H., and Hodzic, A.: De-tailed characterization of a mist chamber for the collection of water-soluble organic gases, Atmos. Environ., 188, 12–17, https://doi.org/10.1016/J.ATMOSENV.2018.06.019, 2018. Hulskotte, J. H. J., van der Gon, H. A. C. D., Visschedijk, A. J.
H., and Schaap, M.: Brake wear from vehicles as an important source of diffuse copper pollution, Water Sci. Technol., 56, 223– 231, 2007.
Janssen, N. A. H., Yang, A., Strak, M., Steenhof, M., Hellack, B., Gerlofs-Nijland, M. E., Kuhlbusch, T., Kelly, F., Harri-son, R., Brunekreef, B., Hoek, G., and Cassee, F.: Oxidative potential of particulate matter collected at sites with differ-ent source characteristics, Sci. Total Environ., 472, 572–581, https://doi.org/10.1016/j.scitotenv.2013.11.099, 2014.
Kim, S., Jaques, P. A., Chang, M., Froines, J. R., and Sioutas, C.: Versatile aerosol concentration enrichment system (VACES) for simultaneous in vivo and in vitro evaluation of toxic effects of ultrafine, fine and coarse ambient particles Part I: Development and laboratory characterization, J. Aerosol Sci., 32, 1281–1297, https://doi.org/10.1016/S0021-8502(01)00057-X, 2001. King, L. E. and Weber, R. J.: Development and testing
of an online method to measure ambient fine particu-late reactive oxygen species (ROS) based on the 20,70 -dichlorofluorescin (DCFH) assay, Atmos. Meas. Tech., 6, 1647– 1658, https://doi.org/10.5194/amt-6-1647-2013, 2013.
Knaapen, A. M., Borm, P. J. A., Albrecht, C., and Schins, R. P. F.: Inhaled particles and lung cancer. Part A: Mechanisms, Int. J. Cancer, 109, 799–809, https://doi.org/10.1002/ijc.11708, 2004. Kumagai, Y., Koide, S., Taguchi, K., Endo, A., Nakai, Y.,
Yoshikawa, T., and Shimojo, N.: Oxidation of proximal protein sulfhydryls by phenanthraquinone, a component of diesel exhaust particles, Chem. Res. Toxicol., 15, 483–489, https://doi.org/10.1021/tx0100993, 2002.
Landreman, A. P., Shafer, M. M., Hemming, J. C., Hannigan, M. P., and Schauer, J. J.: A macrophage-based method for the as-sessment of the reactive oxygen species (ROS) activity of atmo-spheric particulate matter (PM) and application to routine (daily-24 h) aerosol monitoring studies, Aerosol Sci. Technol., 42, 946– 957, https://doi.org/10.1080/02786820802363819, 2008. Li, N., Sioutas, C., Cho, A., Schmitz, D., Misra, C., Sempf,
mi-tochondrial damage, Environ. Health Persp., 111, 455–460, https://doi.org/10.1289/ehp.6000, 2003.
Lin, P., Hu, M., Deng, Z., Slanina, J., Han, S., Kondo, Y., Takegawa, N., Miyazaki, Y., Zhao, Y., and Sugimoto, N.: Seasonal and di-urnal variations of organic carbon in PM2.5 in Beijing and the estimation of secondary organic carbon, J. Geophys. Res., 114, D00G11, https://doi.org/10.1029/2008JD010902, 2009. Liu, S. and Liang, X. Z.: Observed diurnal cycle climatology of
planetary boundary layer height, J. Climate, 23, 5790–5809, https://doi.org/10.1175/2010JCLI3552.1, 2010.
Lou, C., Liu, H., Li, Y., Peng, Y., Wang, J., and Dai, L.: Re-lationships of relative humidity with PM2.5 and PM10 in the Yangtze River Delta, China, Environ. Monit. Assess., 189, 582, https://doi.org/10.1007/s10661-017-6281-z, 2017.
Maikawa, C. L., Weichenthal, S., Wheeler, A. J., Dobbin, N. A., Smargiassi, A., Evans, G., Liu, L., Goldberg, M. S., and Go-dri Pollitt, K. J.: Particulate oxidative burden as a predictor of exhaled nitric oxide in children with Asthma, Environ. Health Persp., 124, 1616–1622, https://doi.org/10.1289/EHP175, 2016. Majestic, B. J., Schauer, J. J., and Shafer, M. M.: Development of
a manganese speciation method for atmospheric aerosols in bio-logically and environmentally relevant fluids, Aerosol Sci. Tech-nol., 41, 925–933, https://doi.org/10.1080/02786820701564657, 2007.
Mues, A., Rupakheti, M., Münkel, C., Lauer, A., Bozem, H., Hoor, P., Butler, T., and Lawrence, M. G.: Investigation of the mix-ing layer height derived from ceilometer measurements in the Kathmandu Valley and implications for local air quality, At-mos. Chem. Phys., 17, 8157–8176, https://doi.org/10.5194/acp-17-8157-2017, 2017.
Pant, P. and Harrison, R. M.: Estimation of the contribution of road traffic emissions to particulate matter concentrations from field measurements: A review, Atmos. Environ., 77, 78–97, https://doi.org/10.1016/j.atmosenv.2013.04.028 Review, 2013. Pathak, R. K., Yao, X., and Chan, C. K.: Sampling Artifacts of
Acid-ity and Ionic Species in PM2.5, Environ. Sci. Technol., 38, 254–
259, https://doi.org/10.1021/es0342244, 2004.
Pervez, S., Chakrabarty, R. K., Dewangan, S., Watson, J. G., Chow, J. C., and Matawle, J. L.: Chemical specia-tion of aerosols and air quality degradaspecia-tion during the fes-tival of lights (Diwali), Atmos. Pollut. Res., 7, 92–99, https://doi.org/10.1016/J.APR.2015.09.002, 2016.
Roper, C., Chubb, L. G., Cambal, L., Tunno, B., Clougherty, J. E., and Mischler, S. E.: Characterization of ambi-ent and extracted PM2.5 collected on filters for
tox-icology applications, Inhal. Toxicol., 27, 673–681, https://doi.org/10.3109/08958378.2015.1092185, 2015. Saffari, A., Daher, N., Shafer, M. M., Schauer, J. J., and Sioutas,
C.: Seasonal and spatial variation in dithiothreitol (DTT) activ-ity of quasi-ultrafine particles in the Los Angeles Basin and its association with chemical species, J. Environ. Sci. Heal. A, 49, 441–451, https://doi.org/10.1080/10934529.2014.854677, 2014. Saffari, A., Hasheminassab, S., Wang, D., Shafer, M. M., Schauer, J. J., and Sioutas, C.: Impact of primary and sec-ondary organic sources on the oxidative potential of quasi-ultrafine particles (PM0.25) at three contrasting locations in the Los Angeles Basin, Atmos. Environ., 120, 286–296, https://doi.org/10.1016/j.atmosenv.2015.09.022, 2015.
Sameenoi, Y., Koehler, K., Shapiro, J., Boonsong, K., Sun, Y., Collett, J., Volckens, J., and Henry, C. S.: Microflu-idic electrochemical sensor for on-line monitoring of aerosol oxidative activity, J. Am. Chem. Soc., 134, 10562–10568, https://doi.org/10.1021/ja3031104, 2012.
Sander, R.: Compilation of Henry’s law constants (version 4.0) for water as solvent, Atmos. Chem. Phys., 15, 4399–4981, https://doi.org/10.5194/acp-15-4399-2015, 2015.
Shah, S. D., Cocker, D. R., Miller, J. W., and Norbeck, J. M.: Emission Rates of Particulate Mailer and Elemental and Organic Carbon from In-Use Diesel Engines, Environ. Sci. Technol., 38, 2544–2550, https://doi.org/10.1021/es0350583, 2004.
Sharma, M. C., Pandey, V. K., Kumar, R., Latief, S. U., Chakrawarthy, E., and Acharya, P.: Seasonal characteristics of black carbon aerosol mass concentrations and influence of meteorology, New Delhi (India), Urban Clim., 24, 968–981, https://doi.org/10.1016/j.uclim.2017.12.002, 2017.
Shirmohammadi, F., Hasheminassab, S., Wang, D., Schauer, J. J., Shafer, M. M., Delfino, R. J., and Sioutas, C.: The relative im-portance of tailpipe and non-tailpipe emissions on the oxidative potential of ambient particles in Los Angeles, CA, Faraday Dis-cuss., 189, 361–380, https://doi.org/10.1039/c5fd00166h, 2016. Singh, V., Ravindra, K., Sahu, L., and Sokhi, R.:
Trends of atmospheric black carbon concentration over United Kingdom, Atmos. Environ., 178, 148–157, https://doi.org/10.1016/J.ATMOSENV.2018.01.030, 2018. Snyder, D. C., Rutter, A. P., Collins, R., Worley, C., and Schauer,
J. J.: Insights into the origin of water soluble organic carbon in atmospheric fine particulate matter, Aerosol Sci. Technol., 43, 1099–1107, https://doi.org/10.1080/02786820903188701, 2009. Spaulding, R. S., Talbot, R. W., and Charles, M. J.: Optimiza-tion of a mist chamber (cofer scrubber) for sampling water-soluble organics in air, Environ. Sci. Technol., 36, 1798–1808, https://doi.org/10.1021/es011189x, 2002.
Steenhof, M., Gosens, I., Strak, M., Godri, K. J., Hoek, G., Cassee, F. R., Mudway, I. S., Kelly, F. J., Harrison, R. M., Lebret, E., Brunekreef, B., Janssen, N. A. H., and Pieters, R. H. H.: In vitro toxicity of particulate matter (PM) collected at different sites in the Netherlands is associated with PM composition, size fraction and oxidative potential – the RAPTES project, Part. Fibre Toxi-col., 8, 26, https://doi.org/10.1186/1743-8977-8-26, 2011. Thorpe, A. and Harrison, R. M.: Sources and
proper-ties of non-exhaust particulate matter from road traf-fic: A review, Sci. Total Environ., 400, 270–282, https://doi.org/10.1016/j.scitotenv.2008.06.007, 2008.
Tuet, W. Y., Fok, S., Verma, V., Tagle Rodriguez, M. S., Grosberg, A., Champion, J. A., and Ng, N. L.: Dose-dependent intracellu-lar reactive oxygen and nitrogen species (ROS/RNS) production from particulate matter exposure: comparison to oxidative poten-tial and chemical composition, Atmos. Environ., 144, 335–344, https://doi.org/10.1016/j.atmosenv.2016.09.005, 2016.
Venkatachari, P. and Hopke, P. K.: Development and lab-oratory testing of an automated monitor for the mea-surement of atmospheric particle-bound reactive oxy-gen species (ROS), Aerosol Sci. Technol., 42, 629–635, https://doi.org/10.1080/02786820802227345, 2008.
from primary and secondary sources, Atmos. Environ., 43, 6360– 6368, https://doi.org/10.1016/j.atmosenv.2009.09.019, 2009. Verma, V., Rico-Martinez, R., Kotra, N., King, L., Liu, J., Snell,
T. W., and Weber, R. J.: Contribution of water-soluble and insoluble components and their hydrophobic/hydrophilic sub-fractions to the reactive oxygen species-generating potential of fine ambient aerosols, Environ. Sci. Technol., 46, 11384–11392, https://doi.org/10.1021/es302484r, 2012.
Verma, V., Fang, T., Guo, H., King, L., Bates, J. T., Peltier, R. E., Edgerton, E., Russell, A. G., and Weber, R. J.: Re-active oxygen species associated with water-soluble PM2.5
in the southeastern United States: spatiotemporal trends and source apportionment, Atmos. Chem. Phys., 14, 12915–12930, https://doi.org/10.5194/acp-14-12915-2014, 2014.
Wang, C.-F., Chang, C.-Y., Tsai, S.-F., and Chiang, H.-L.: Char-acteristics of road dust from different sampling sites in north-ern Taiwan, J. Air Waste Manage. Assoc., 55, 1236–44, https://doi.org/10.1080/10473289.2005.10464717, 2005. Wang, Y., Hopke, P. K., Sun, L., Chalupa, D. C., and
Utell, M. J.: Laboratory and field testing of an au-tomated atmospheric particle-bound reactive oxygen species sampling-analysis system, J. Toxicol., 2011, 1–9, https://doi.org/10.1155/2011/419476, 2011.
Wang, Y., Plewa, M. J., Mukherjee, U. K., and Verma, V.: Assessing the cytotoxicity of ambient particulate matter (PM) using Chi-nese hamster ovary (CHO) cells and its relationship with the PM chemical composition and oxidative potential, Atmos. Environ., 179, 132–141, https://doi.org/10.1016/j.atmosenv.2018.02.025, 2018.
Weichenthal, S., Crouse, D. L., Pinault, L., Godri-Pollitt, K., Lav-igne, E., Evans, G., van Donkelaar, A., Martin, R. V., and Bur-nett, R. T.: Oxidative burden of fine particulate air pollution and risk of cause-specific mortality in the Canadian Census Health and Environment Cohort (CanCHEC), Environ. Res., 146, 92– 99, https://doi.org/10.1016/j.envres.2015.12.013, 2016. Wragg, F. P. H., Fuller, S. J., Freshwater, R., Green, D. C., Kelly,
F. J., and Kalberer, M.: An automated online instrument to quan-tify aerosol-bound reactive oxygen species (ROS) for ambient measurement and health-relevant aerosol studies, Atmos. Meas. Tech., 9, 4891–4900, https://doi.org/10.5194/amt-9-4891-2016, 2016.
Xia, L. and Gao, Y.: Characterization of trace elements in PM2.5
aerosols in the vicinity of highways in northeast New Jer-sey in the U.S. east coast, Atmos. Pollut. Res., 2, 34–44, https://doi.org/10.5094/APR.2011.005, 2011.
Xiong, Q., Yu, H., Wang, R., Wei, J., and Verma, V.: Rethink-ing Dithiothreitol-Based Particulate Matter Oxidative Potential: Measuring Dithiothreitol Consumption versus Reactive Oxy-gen Species Generation, Environ. Sci. Technol., 51, 6507–6514, https://doi.org/10.1021/acs.est.7b01272, 2017.
Yang, A., Jedynska, A., Hellack, B., Kooter, I., Hoek, G., Brunekreef, B., Kuhlbusch, T. A. J., Cassee, F. R., and Janssen, N. A. H.: Measurement of the oxidative poten-tial of PM2.5 and its constituents: The effect of
extrac-tion solvent and filter type, Atmos. Environ., 83, 35–42, https://doi.org/10.1016/j.atmosenv.2013.10.049, 2014.
Yang, A., Janssen, N. A. H., Brunekreef, B., Cassee, F. R., Hoek, G., and Gehring, U.: Children’s respiratory health and oxidative potential of PM2.5: The PIAMA birth cohort study, Occup.
En-viron. Med., 73, 154–160, https://doi.org/10.1136/oemed-2015-103175, 2016.
Yao, X., Fang, M., and Chan, C. K.: Experimental study of the sampling artifact of chloride depletion from col-lected sea salt aerosols, Environ. Sci. Technol., 35, 600–605, https://doi.org/10.1021/es000964q, 2001.
Yu, H., Wei, J., Cheng, Y., Subedi, K., and Verma, V.: Synergis-tic and AntagonisSynergis-tic Interactions among the ParSynergis-ticulate Matter Components in Generating Reactive Oxygen Species Based on the Dithiothreitol Assay, Environ. Sci. Technol., 52, 2261–2270, https://doi.org/10.1021/acs.est.7b04261, 2018.