Implementation of Image Processing based
application towards forecasting of Natural
Disaster
Prof. Samir Kumar Bandyopadhyay
Dept. of Computer Sc. & Engg, University of Calcutta 92 A.P.C. Road, Kolkata – 700009, India
Email:[email protected]
Mr. Pritimoy Sanyal
West Bengal University of Technology, Kolkata, West Bengal, India Email: [email protected]
Abstract
Around the world, practical Action is working in different ways to tackle both the causes and effects of climate change but disaster reduction is both possible and feasible if the sciences and technologies related to natural hazards are properly applied. Our proposed weather station will be installed in each block and each of them is capable to store data locally and they are also able to send these data periodically to the main server. The communication between weather station and server is in duplex mode.
Key Words Hazards, Aila, SWSN and EFS
I. Introduction
Natural disasters such as storms, earthquakes, droughts and landslides can have devastating effects on human populations and economies. Studies show that these hazards are on the rise, likely due to climate change in many cases. With growing population and infrastructures the world’s exposure to natural hazards is inevitably increasing. These trends, coupled with recent high-profile mega-disasters like earthquake in several areas of West Bengal, aila, are raising global awareness of the need to build the capacity of national governments, civil society organizations to prevent, respond to and recover from natural disasters. Around the world, practical Action is working in different ways to tackle both the causes and effects of climate change but disaster reduction is both possible and feasible if the sciences and technologies related to natural hazards are properly applied. Coping with hazards - whether natural or attributable to human activity - is one of the greatest challenges of the applications of science and technology in the 21st Century[1-3]. In developing countries like India, there is no good arrangement to predict the unforeseen ruins. India, the second world most populist country, is remain evidence of how the developing countries are facing wicked problems to use most advanced available science and technology to minimize the loss of natural wrecks. Every year, the coastal areas of India is witnessing deaths of hundreds of mass and loss of crores of rupees of wealth, livestock, and crops due to cyclones and severe floods. While we cannot prevent an earthquake or a cyclone from occurring, or a flood from inundating, we can apply the scientific knowledge and technical know-how that we already have to increase the earthquake- and wind resistance of houses and bridges, to issue early warnings on earthquakes, floods and cyclones and organize proper community response to such warnings.
II. Limitation of existing technologies
Working with communities to reduce their vulnerability to the disasters made worse and more numerous by climate change
Working with other organizations to share our learning of what works well and what can be done to make programs of work with poor communities even more effective.
Working with national and international bodies around the world to create and strengthen policies which reduce emissions and encourage funding and focus on adaptation to climate change.
Working with schools and teachers to encourage the delivery of effective, exciting climate change lessons which engage today's young people in the issues of climate change, creating a generation of global citizens who understand the impact of their actions on the environment and people around the world.
Launching and supporting campaigns designed to raise awareness of the impacts of climate change on vulnerable communities, and enabling them to take tangible action to support strong and urgent change at the local, national and international level.
Developing a forecasting system on natural disasters which can reduces the wide range of effects successfully.
Building a knowledge database for area specific study
Our approach to disaster risk reduction is based on research and operational experience which mainly consists of Satellite Weather Station Network and Earthquake Forecasting System.
III. Satellite Weather Station Network (SWSN)
Weather satellite plays vital role for daily monitoring of weather throughout the world. Till now, the United States, Japan, France, India, Russia, and the European Space Agency are using a total of about a dozen weather satellites for daily monitoring. There are two main types of weather satellites: geostationary and polar-orbiting. A geostationary satellite is positioned at a height of 35,900 kilometers (22,300 miles) above the equator, an altitude at which it completes one orbit in the same amount of time that the Earth rotates once on its axis—24 hours. The satellite thus seems to remain above the same spot on the equator. Because of its high altitude, a geostationary satellite can monitor the weather over about one-third of the globe. On the other hand, the great height at which a geostationary satellite orbits limits the amount of detail it can provide about weather features. On the other hand, a polar-orbiting satellite circles the globe at a much lower altitude, 800 kilometers (500 miles), making a complete circuit over the poles about every 100 minutes. Because the Earth rotates beneath a polar-orbiting satellite, the satellite crosses a different part of the planet with each pass, allowing it to cover the entire globe about 14 times each day. Cameras aboard weather satellites take photographs of the parts of the Earth that are in sunlight. These pictures capture cloud patterns, some of which are related to storms. Many satellites also carry instruments that can monitor infrared radiation (energy from just beyond the red end of the visible-light spectrum) emitted by clouds and water vapor. Infrared radiation can be detected 24 hours day, so infrared images make it possible to track storms even when they are shrouded by night. In our research work we mainly concentrate on images which are captured by various polar orbiting weather satellites as the necessary infrastructure is cost effective. The live images can be processed by which natural calamities can be predicted early.
IV. Utilities
Radiation measurements from the earth's surface and atmosphere give information on amounts of heat and energy being released from the Earth and the Earth's atmosphere.
People who fish for a living can find out valuable information about the temperature of the sea from measurements that satellites make.
Satellites monitor the amount of snow in winter
After processing the live data, natural calamities can be predicted before it’s going to occur
Infrared sensors on satellites examine crop conditions, areas of deforestation and regions of drought. Some satellites have a water vapor sensor that can measure and describe how much water vapor is in
different parts of the atmosphere.
Satellites can detect volcanic eruptions and the motion of ash clouds.
During the winter, satellites monitor freezing air, allowing weather forecasters to warn growers of upcoming low temperatures.
Satellites receive environmental information from remote data collection platforms on the surface of the Earth.
V. Algorithm 1. Receive the radio signal from satellite
2. Reconstruct the image with application software
3. Extract the features from “Region of Interest” (ROI) from this image 4. Store the information into database with timestamp value
5. Repeat step 1 to 4 for rest of received radio signals for a predefined period 6. Analyze the content of each input with other parameters for “threat” analysis 7. If there is a possibility of “threat”
Create alarm along with details of disaster Else
Continue
VI. Earthquake Forecasting System (EFS)
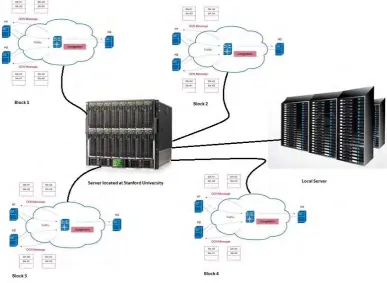
Earthquake prediction "is usually defined as the specification of the time, location, and magnitude of a future earthquake within stated limits", and particularly of "the next strong earthquake to occur in a region”. This can be distinguished from earthquake forecasting, which is the probabilistic assessment of general earthquake hazard, including the frequency and magnitude of damaging earthquakes, in a given area over periods of years or decades.This can be further distinguished from real-time earthquake warning systems, which, upon detection of a severe earthquake, can provide neighbouring regions a few seconds warning of potentially significant shaking. To be useful, an earthquake prediction must be precise enough to warrant the cost of increased precautions; including disruption of ordinary activities and commerce, and timely enough that preparation can be made. Right now, an accurate prediction of the location of the next major earthquake is not possible. However, regions of high probability for the next large earthquake can be identified and mapped. The Quake-Catcher Network of Stanford University Geo Physics Department is a collaborative initiative for developing the world’s largest, low-cost strong-motion seismic network by utilizing sensors in and attached to internet-connected computers. With the help of low cost device, the Quake-Catcher Network or QCN can provide better understanding of earthquakes; give early warning to schools, emergency response systems, and others. The Quake-Catcher Network also provides educational software designed to help teach about earthquakes and earthquake hazards.
Figure 2a The QCN device attached with computer 2b The Software interface
The low cost QCN device is attached with the computer at each block and each of this unit are interconnected with the server located at different geographical area. Besides this server connectivity, each of QCN devices is directly accessed by QCN server located at Stanford University, USA.
VII. Algorithm
1. Read the data which is captured by vibrational sensor of QCN device 2. Calculate the significance value of each motion
3. Compare it with predefined threshold value
4. If the calculated value is higher than threshold value
Then a trigger will be created which can forecast the possible occurrence of earthquake Else
continue
VIII. Conclusion
Governments, international organizations and research institutions worldwide have set to work to improve disaster management in all its phases: mitigation, preparedness, relief and response, and recovery and reconstruction. Many governments in the world have put the formation of a hazard-resistant and disaster coping society on their political agenda as an important factor of sustainable economic development and better quality of civil life. Being highly vulnerable to natural disaster, 25 states out of a total of 35 states/UTs in India are considered disaster prone. 68% of Indian land is draught prone, 12% to flood and 8% to cyclone. Some of the natural disasters occurring in India are floods, droughts, cyclone, earthquake, landslides and avalanches etc. Disaster results not only in the loss of life & shelter but also creates lack of food, increase in diseases, and disturb socio-economic activities. Therefore it is one if the major areas of concern for developing countries like India. In this respect, the awareness of new geospatial technologies and their successful utilization in disaster management is becoming crucial.
IX References
[1] Ambrosia, V.G. and Hinkley, E. 2008: NASA science serving society: improving capabilities for fire characterization to effect reduction in disaster losses. IEEE International Geoscience and Remote Sensing Symposium, Boston, MA, 4, IV-628-631. [2] Begg, J.G. and Mouslpoulou, V. 2007: RangitaikiPlains: another veil is lifted. New LiDAR data from Bay of Plenty, New Zealand.
Geological Society of New Zealand Miscellaneous Publication 123A, 9.
[3] Belliss, S.E., Pairman, D. and McNeill, S.J. 1998:Use of Radarsat data to map Landslide erosion in steep landforms. Application Development and Research Opportunity (ADRO) Final Symposium, 13–15 October, Montreal, Quebec, Canada, Electronic Proceedings.
[4] Berardino, P., Fornaro, G., Lanari, R. and Sansoti,E. 2002: A new algorithm for surface deformation monitoring based on small baseline differential SAR interferometry. IEEE Transactions on Geoscience and Remote Sensing 41, 2375–83.
[5] Bonn, F. and Dixon, R. 2005: Monitoring flood extent and forecasting excess runoff risk with Radarsat-1data. Natural Hazards 35, 377–93. Bourgeau-Chavez, L. and Kasischke, E. 2002: Mapping fire scars in global boreal forest using imaging radar data. International Journal of Remote Sensing 23, 4211–34.