GROUND WATER QUALITY ANALYSIS
AND MAPPING USING GIS
TECHNIQUES
SURESH KONKEY1, Dr. U.B.CHITRANSHI2, Dr. RAHUL DEV GARG3
1
Assistant Executive Engineer, Roads&Buildings Dept.,Peddapuram,India 2
Assistant Professor, Dept. of Civil Engineering, IIT Roorkee, India 3
Assistant Professor, Dept. of Civil Engineering, IIR Roorkee, India
Abstract:
Groundwater quality in Lucknow district has special significance and needs great attention of all concerned since it is the major alternate source of domestic, industrial, drinking and irrigation. Water Quality Index has been calculated and thematic maps of the same were also developed. The results of the water quality analysis work were presented in the form of maps which can be used for better understanding of the present water quality scenario of the study area. The overall view of the water quality index of the present study area revealed that most of the study area with <50 standard rating of water quality index exhibited excellent. The WQI ranges from 50-100 in the study area like Khujauli, Arya nagar, Lucknow and some part of Bakshi Ka Talab was good for drinking as well as irrigation purpose. Ground water quality is poor in Kathwara in Bakshi Ka Talab mandal. Weighted overlay maps are created from the spatial distribution layers of ten water quality parameters. Quality analysis of drinking water from Water quality index, spatial distribution maps of individual water quality parameters and overlay map were found for the stress zones in Lucknow district. By using Wilcox, salinity diagrams and overlay map, the ground water in Lucknow district area was divided into suitable and unsuitable categories for irrigation purpose.
Keywords: Ground water, Water Quality Index (WQI), Spatial Distribution, weighted overlay, Geographic
Information System
1. Introduction
Ground water is an essential and vital component of our life support system. The ground water resources are being utilized for drinking, irrigation and industrial purposes. However, due to rapid growth of population, urbanization, industrialization and agriculture activities, ground water resources are under stress. The definition of water quality is very much depending on the desired use of water. Therefore different uses require different criteria of water quality as well as standard methods for reporting and comparing results of water analysis [1].
Major chemical elements including Na+, K+, Ca2+, Mg2+, Cl- and SO42- play a significant role in classifying and
assessing groundwater quality. Geographical Information System (GIS) has emerged as efficient and powerful tool in different fields of science over the last two decades. The GIS has the ability to store, arrange, retrieve, classify, manipulate, analyze and present huge spatial data and information in a simple manner [6].
It therefore becomes imperative to regularly monitor the quality of groundwater and to device ways and means to protect it. Water quality index is one of the most effective tools to communicate information on overall quality status of water to the concerned user community and policy makers [2, 3]. Thus, it becomes an important parameter for the assessment and management of groundwater.
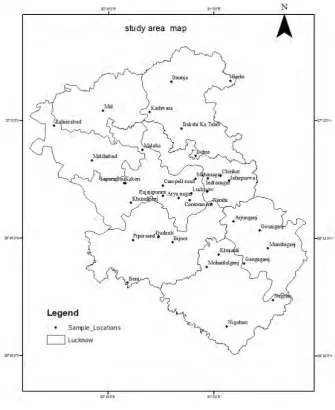
2. Study Area
Figure 2.1 District map of Lucknow
3. Materials & Methods
The ground water samples are collected manually from the bore wells which were approximately equally distributed all over 36 locations from Lucknow district. The Parameters, which are analyzed during water analysis, are pH, conductivity, chlorides, total alkalinity, fluoride, nitrate, sulphate, total hardness, calcium hardness and magnesium hardness.
3.1 Water Quality Index (WQI): [3, 6]
For computing WQI, three steps are followed
Step-1 Each of the parameters has been assigned a weight (wi) according to its relative importance in the overall quality of water for drinking purposes (table 4.4) the maximum weight of 5 has been assigned to the parameter nitrate due to its major importance in water quality assessment. Magnesium which is given the minimum weight of 2 as magnesium by itself may not be harmful.
Step-2 The relative weight (Wi) is computed from the following equation:
∑ 3.1 Where,
Wi is the relative weight,
wi is the weight of each parameter and n is the number of parameters.
Step-3 A quality rating scale (qi) for each parameter is assigned by dividing its concentration in each water sample by its respective standard according to the guidelines laid down in the BIS and the result multiplied by 100:
Where,
qi is the quality rating
Ci is the concentration of each chemical parameter in each water sample in mg/L Si is the Indian drinking water standard for each chemical
Parameter in mg/l according to the guidelines of the BIS 10500: 1991. For computing the WQI, the SI is first determined for each chemical parameter, which is then used to determine the WQI as per the following equation
. 3.3 ∑ 3.4 WQI = ∑ SIi
Where,
SIi is the sub index of ith parameter; qi is the rating based on concentration of ith
parameter and n is the number of parameters. The computed WQI values are classified into five types, “excellent water” to “water, unsuitable for drinking”.
In the Present study Method-2 was used for calculating the Water quality Index.
Irrigation water classification [5]
2
3.5
Percent Sodium (% 3.6
Table 3.1 Relative weight of chemical parameters [3]
Parameter standards (as per
BIS)
wi (Weight) Wi (Relative weight)
pH 6.5-8.5 4 0.125
Chloride (mg/l) 250 3 0.094
Total Hardness (mg/l as CaCO3)
300 2 0.063
Na 150 3 0.094
Sulphate 200 4 0.125
Fluoride (mg/l) 1.5 4 0.125
Nitrate (mg/l) 45 5 0.156
Calcium (mg/l) 75 2 0.063
Magnesium (mg/l) 30 2 0.063
Electrical Conductivity
(μS/cm) 2000 3 0.094
Table 3.2 Water quality category[3]
WQI Value Water quality
<50 Excellent
50-100 Good water
100-200 Poor water
200-300 Very poor water
>300 Water unsuitable for drinking
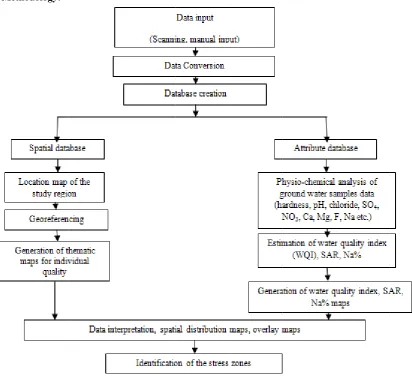
3.2 Database
The study is has been carried out with the help of two major components: spatial maps and field data. Field work was conducted and groundwater samples were collected from various parts of Lucknow district with the help of the map. These samples were tested using standard procedures in the laboratory and the results were tabulated in an excel worksheet.
3.2.1 Inverse Distance Weighted
Inverse Distance Weighting (IDW) is based on the assumption that the nearby values contribute more to the interpolated values than distant observations. In other words, for this method the influence of a known data point is inversely related to the distance from the unknown location that is being estimated. The advantage of IDW is that it is intuitive and efficient. This interpolation works best with evenly distributed points. Similar to the SPLINE functions, IDW is sensitive to outliers. Furthermore, unevenly distributed data clusters results in introduced errors [4].
3.2.2 Weighted overlay
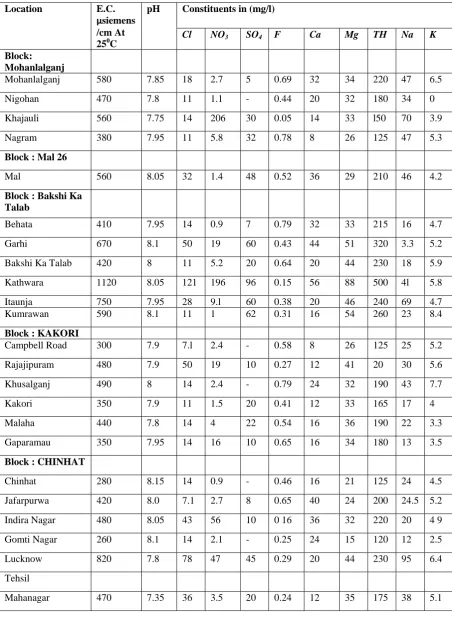
Table 3.3: Various Parameters of ground water particular location
Location E.C. µsiemens
/cm At 250C
pH Constituents in (mg/l)
Cl NO3 SO4 F Ca Mg TH Na K
Block: Mohanlalganj
Mohanlalganj 580 7.85 18 2.7 5 0.69 32 34 220 47 6.5
Nigohan 470 7.8 11 1.1 - 0.44 20 32 180 34 0
Khajauli 560 7.75 14 206 30 0.05 14 33 l50 70 3.9
Nagram 380 7.95 11 5.8 32 0.78 8 26 125 47 5.3
Block : Mal 26
Mal 560 8.05 32 1.4 48 0.52 36 29 210 46 4.2
Block : Bakshi Ka Talab
Behata 410 7.95 14 0.9 7 0.79 32 33 215 16 4.7
Garhi 670 8.1 50 19 60 0.43 44 51 320 3.3 5.2
Bakshi Ka Talab 420 8 11 5.2 20 0.64 20 44 230 18 5.9
Kathwara 1120 8.05 121 196 96 0.15 56 88 500 4l 5.8
Itaunja 750 7.95 28 9.l 60 0.38 20 46 240 69 4.7
Kumrawan 590 8.1 11 1 62 0.31 16 54 260 23 8.4
Block : KAKORI
Campbell Road 300 7.9 7.l 2.4 - 0.58 8 26 125 25 5.2
Rajajipuram 480 7.9 50 19 10 0.27 12 41 20 30 5.6
Khusalganj 490 8 14 2.4 - 0.79 24 32 190 43 7.7
Kakori 350 7.9 11 1.5 20 0.41 12 33 165 17 4
Malaha 440 7.8 14 4 22 0.54 16 36 190 22 3.3
Gaparamau 350 7.95 14 16 10 0.65 16 34 180 13 3.5
Block : CHINHAT
Chinhat 280 8.15 14 0.9 - 0.46 16 21 125 24 4.5
Jafarpurwa 420 8.0 7.1 2.7 8 0.65 40 24 200 24.5 5.2
Indira Nagar 480 8.05 43 56 10 0 16 36 32 220 20 4 9
Gomti Nagar 260 8.1 14 2.1 - 0.25 24 15 120 12 2.5
Lucknow 820 7.8 78 47 45 0.29 20 44 230 95 6.4
Tehsil
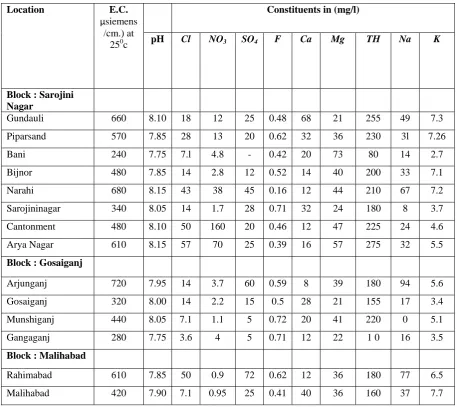
Location E.C.
µsiemens
/cm.) at 250c
Constituents in (mg/l)
pH Cl NO3 SO4 F Ca Mg TH Na K
Block : Sarojini Nagar
Gundauli 660 8.10 18 12 25 0.48 68 21 255 49 7.3
Piparsand 570 7.85 28 13 20 0.62 32 36 230 3l 7.26
Bani 240 7.75 7.l 4.8 - 0.42 20 73 80 14 2.7
Bijnor 480 7.85 14 2.8 12 0.52 14 40 200 33 7.1
Narahi 680 8.15 43 38 45 0.16 12 44 210 67 7.2
Sarojininagar 340 8.05 14 1.7 28 0.71 32 24 180 8 3.7
Cantonment 480 8.10 50 160 20 0.46 12 47 225 24 4.6
Arya Nagar 610 8.15 57 70 25 0.39 16 57 275 32 5.5
Block : Gosaiganj
Arjunganj 720 7.95 14 3.7 60 0.59 8 39 180 94 5.6
Gosaiganj 320 8.00 14 2.2 15 0.5 28 21 155 17 3.4
Munshiganj 440 8.05 7.1 1.1 5 0.72 20 41 220 0 5.1
Gangaganj 280 7.75 3.6 4 5 0.71 12 22 1 0 16 3.5
Block : Malihabad
Rahimabad 610 7.85 50 0.9 72 0.62 12 36 180 77 6.5
Malihabad 420 7.90 7.1 0.95 25 0.41 40 36 160 37 7.7
Table 3.4: Na%, EC, SAR, WQI of ground water particular location
Location E.C. microsiemens/cm. At
250C
Na % SAR WQI Drinking water
Classification According to
WQI Block :Mohanlalganj
Mohanlalganj 580 44.770 8.182 39.209 Excellent
Nigohan 470 39.535 6.668 32.406 Excellent
Khajauli 560 61.125 14.440 102.730 poor
Nagram 380 60.603 11.399 36.024 Excellent
Block : Mal
Mal 560 43.576 8.069 39.716 Excellent
Block : Bakshi Ka Talab
Behata 410 24.154 2.807 36.492 Excellent
Garhi 670 8.213 0.479 54.396 Good
Bakshi Ka Talab 420 27.190 3.182 39.285 Excellent
Itaunja 750 52.756 1.648 46.896 Excellent
Kumrawan 590 30.966 3.888 41.333 Excellent
Block : Kakori
Campbell Road 300 47.041 6.063 29.369 Excellent
Rajajipuram 480 40.181 5.828 37.048 Excellent
Khusalganj 490 47.516 8.126 37.378 Excellent
Kakori 350 31.818 3.584 31.233 Excellent
Malaha 440 32.730 4.315 23.484 Excellent
Gaparamau 350 24.812 2.600 38.433 Excellent
Block : Chinhat
Chinhat 280 43.511 5.580 27.781 Excellent
Jafarpurwa 420 79.631 48.310 48.666 Excellent
Indira Nagar 480 26.803 3.430 52.604 Good
Gomti Nagar 260 27.103 2.717 24.843 Excellent
Lucknow 820 61.306 16.794 61.350 Good
Mahanagar 470 47.836 7.839 33.140 Excellent
Block : Sarojini Nagar
Gundauli 660 38.747 7.345 25.562 Excellent
Piparsand 570 36.006 5.316 43.092 Excellent
Bani 240 37.955 3.789 37.372 Excellent
Bijnor 480 42.614 6.351 36.104 Excellent
Narahi 680 56.989 12.662 52.855 Good
Sarojininagar 340 17.282 1.512 34.131 Excellent
Cantonment 480 32.648 4.419 93.655 Good
Arya Nagar 610 33.937 5.297 67.038 Good
Block : Gosaiganj
Arjunganj 720 67.940 19.391 43.959 Excellent
Gosaiganj 320 9.395 3.435 30.658 Excellent
Munshiganj 440 29.152 3.621 35.653 Excellent
Gangaganj 280 36.449 3.881 27.254 Excellent
Block :Malihabad
Rahimabad 610 63.498 15.718 43.320 Excellent
3.2.3 Me 4. Result 4.1 Grou i.Ele Fig. 4.1 excellent Lucknow ii.Tot From fig limit i.e. impart pa ethodology:
ts and Discus undwater Qu ctrical Condu
shows, Excep t and good. A w areas ground
tal Hardness
g. 4.2, Kathwa 300 mg/l as C alatability to w
ssions ality Variatio uctivity (EC)
pt Kathwara a Above 750 µ d water quality
spatial distri
ara, Bhani in CaCO3. The re water.
Figure 3.1 Flow
on
)spatial distr
and surroundi µ Siemens/cm y is doubtful.
ibution map
Bakshi Ka T emaining area
w chart showing t
ribution map
ing area, rem m water qualit
Talab mandal a of Lucknow
the process flow
maining area o ty is doubtfu
ground water w district withi
of Lucknow d ul. From the
r total hardne in the limits. S
district water above map K
ess above the Softening is re
quality is Kathwara,
Figure 4.1 Electrical conductivity spatial Figure 4.2 Total Hardness spatial distribution map distribution map
Figure 4.3 Calcium spatial distribution map Figure 4.4 Magnesium spatial distribution map
iii. Calcium (Ca) spatial distribution map
iv. Magnesium (Mg) spatial distribution map
From fig.4.4, most of the area in Lucknow district, magnesium concentration in ground water having above the permissible limit i.e. >30 mg/l. The concentration of magnesium was found to be within the permissible limits in Nagram, Gosaiganj, Gudauli, Chinhat, Mal etc.
v. Chlorides (Cl) spatial distribution map
In potable water, the salt taste is produced by chloride concentrations. At concentrations above 250 mg/l, water acquires salty taste which is objectionable to many people. Bureau of Indian Standards prescribes 250 mg/l as permissible limit and 1000 mg/l as desirable limit in the absence of alternate source. From fig. 4.5, the concentration of chloride was found to be within permissible limit in Lucknow district.
vi. Sulphates (SO4) spatial distribution map
From fig. 4.6, the ground water sulphate in the Lucknow district was within the desirable limits. As per Indian standard of permissible limit is 250 mg/l.
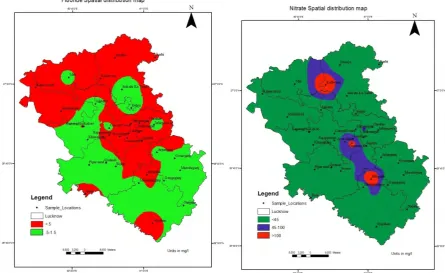
vii. Fluorides (F) spatial distribution map
From the spatial distribution map fig. 4.7, the deficiency of fluoride concentration in the ground water is observed in Nagram, Lucknow, Bakshi Ka Talab mandal and Malihabad mandal etc(<.5mg/l), Mohanlalganj, Gosaiganj and in some parts of Sarojini Nagar mandal having within the permissible limit.
viii. Nitrate spatial distribution map
From fig. 4.8, the Nitrate concentration in the present study area of the ground water within the permissible limit (<45mg/l). The Nitrate concentration was in between 45-100 mg/l in the areas like Lucknow, Aryanagar etc. Higher Nitrate concentration of more than 100 mg/lit were found in Areas like Contonment, Kathwara, Khujauli etc.
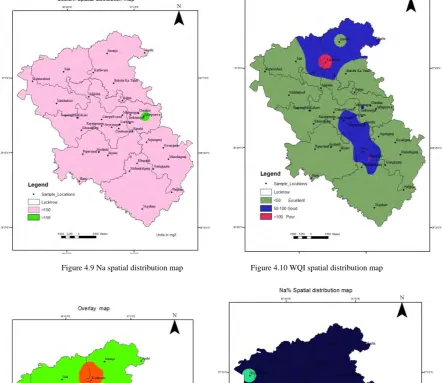
ix. Na spatial distribution map
From fig. 4.9, In Lucknow district the ground water quality with respect to Na concentration within the permissible limit except Jafarpurwa area.
x. WQI spatial distribution map
Figure 4.5 Chloride spatial distribution map Figure 4.6 sulphate spatial distribution map
Figure 4.7 Fluoride spatial distribution map Figure 4.8 Nitrate spatial distribution map
xi. Overlay map (pH, Cl, TH, Na, SO4, NO3, F, Mg, Ca, EC)
From the WQI spatial distribution map it gives only upper limit or permissible limit of fluoride but from (fig. 4.11) overlay map gives lower, upper limits of all 10 water quality parameters with relative weight as percent of influence, shows the Lucknow district divided into categories are suitable, unsuitable.
xii. Na % spatial distribution map
From fig. 4.12, high sodium percent (above 60%) and are not suitable for irrigation purposes like
Rahimabad, Nagram, Jafarpurwa, Khujauli etc. High percentage of Na+ with respect to
(Ca2++Mg2++Na+) in irrigation water, causes deflocculating and impairing of soil permeability.
xii. SAR (Sodium absorption ratio) spatial distribution map
From fig. 4.13, sodium absorption ratio (SAR) in most of the areas of Lucknow district is excellent i.e. SAR value is below 10. Khujauli, Nagram, Narahi and Lucknow are having good quality of water. Arjunganj in Gosaiganj mandal ground water is doubtful for irrigation purpose.
4.2 Water quality analysis for irrigation purpose
I. Salinity diagram
From the graph (Fig 4.14), salinity diagram for classification of irrigation water, the plot of data on the US salinity diagram shows that the water samples were found mostly confined in four classes of water type: i.e., C2-S1, C2-S1 and C2-S2 and C4-S4. Due to low sodium and medium salinity water of C2-S1 class can be used for irrigation on almost all soils with little danger of sodium problem. G1 (Arjunganj), C5 (Lucknow) Sample locations are having C2-S3, C3-S3 category which is high salinity.
II. Wilcox diagram
According to Wilcox diagram the Lucknow district water samples fall almost in all classes even some water samples fall beyond the limits of the diagram. Most of the water samples are in category of excellent to good and good to permissible quality and may be used for irrigation purposes. C2 (jafarpurwa), G1 (Arjunganj), L (Lucknow) water samples having the category of permissible to doubtful (From fig. 4.15).
III. Overlay map of Na%, SAR, EC
Figure 4.9 Na spatial distribution map Figure 4.10 WQI spatial distribution map
Figur
F
e 4.13 SAR spati
Figure 4.15 Wilco
ial distribution ma
ox diagram
ap
Figur
Figure 4.16
re 4.14 Salinity di
6 Overlay map of iagram
CONCLUSIONS
The study has demonstrated the utility of GIS technology combined with analysis in evaluation and mapping of groundwater quality in Lucknow district. According to the findings of this study, the groundwater in
the entire study area is fit for direct drinking with respect to, pH, SO42-, Cl within the desirable limits. Na in the
ground water is within the desirable limit except Jafarpurva. Fluoride level in the Lucknow district is below the 0.5mg/l. It creates dental cavities, so fluoridation should be required in areas like Malihabad, Rahimabad, Bakshi Ka Talab, Chinhat etc. Most of the area study comes under excellent and good class. Kathwara, Khujauli areas have poor water quality category revealed by the WQI studies. The final output has been given in the thematic representation of ground water quality. The analysis suggests that the groundwater of the stress zones needs some degree of treatment before consumption. The study helps us to understand the quality of the water as well as to develop suitable management practices to protect the ground water resources.
Wilcox and Salinity diagrams reveal that except the Jafarpurwa, Arjunganj, Lucknow parts of study area, most of the groundwater samples are suitable for irrigation purposes under normal condition. The salinity hazard for water wells is classified as medium, high while some places show very high salinity. Alkali hazard also is classified from low hazard to very high. For the salinity, Wilcox diagram overlay map of ground water in the Lucknow district lies mostly under the category excellent and good but Jafarpurwa, Arjunganj and Lucknow locations are having water quality, which is doubtful for irrigation purposes.
Future Scope: Bacteriological examination of water would reveal the potability conditions of the water as per BIS standards. Ground water quality can be correlated with the land cover & land use practices in the study area.
REFERENCES
[1] Babiker, I. S., Mohamed, M. A. A., T. Hiyama, Assessing groundwater quality using GIS. Water Resource Manage, 2007, 21: 699– 715.
[2] Abassi, S. A.: Water Quality Indices, State-of-the art.J.IPHE. 1999, No.1.
[3] Sundara kumar, K., Sundara kumar, P., Ratnakanth babu, M.J. & Hanumantha rao, CH., Assessment and mapping of ground water quality using geographical information systems, International Journal of Engineering Science and Technology Vol. 2(11), 2010, 6035-6046.
[4] Asadi, S. S., Padmaja Vuppala and Anji Reddy, M., Remote Sensing and GIS Techniques for Evaluation of Groundwater Quality in Municipal Corporation of Hyderabad (Zone-V), India, Int. J. Environ. Res. Public Health, 2007, 4(1), 45-52.
[5] Taghizadeh Mehrjardi.R., Zareian Jahromi, M., Mahmodi, Sh and Heidari, A., spatial distribution of groundwater quality with geostatistics (Case Study: Yazd-Ardakan Plain), World Applied Sciences Journal, 2008, 4 (1): 09-17.
![Table 3.1 Relative weight of chemical parameters [3]](https://thumb-us.123doks.com/thumbv2/123dok_us/9668069.1494697/3.595.77.511.346.636/table-relative-weight-chemical-parameters.webp)