DESIGN, SYNTHESIS AND BIOLOGICAL EVALUATION OF
SCHIFF BASES AND THEIR Co(II), Cu(II), Ni(II) CHELATES
FROM DERIVATIVE CONTAINING INDOLE MOIETY
BEARING-TRIAZOLE RING
Rehab K. Al-Shemary
[a]*Keywords: Design, synthesis, biological evaluation triazole, indol.
Indole and its various derivatives show diverse biological effects. In the present study, some novel indole derivatives like methyl-2-(1H-indole-3-yl)-ethanoate derivatives (D1-D5) have been synthesized. Three Schiff bases (D6-D8) have been synthesized by the reaction of (D5) with substituted benzaldehydes. Co(II), Cu(II) and Ni(II) complexes of the Schiff bases have been prepared. All the compounds have been characterized by elemental analysis, molar conductivity, magnetic moment effect and spectroscopic techniques. The compounds exhibited moderate to significant anti-bacterial and anti-fungal activities against E. coli, S. aurous, B. subtitles, P. aeruginosin, A. niger, A. flavours, R. stolonifera and C. Albicans
.
* Corresponding Authors
E-Mail: [email protected]
[a] Department of Chemistry, College of Education for Pure Sciences, Ibn -Al-Haitham, University of Baghdad, Iraq.
Introduction
The heterocyclic compounds which have thiazole, indole and tetrazole groups display great scope of biological efficiencies.1 One of the common but remarkable group of alkaloid compounds is indoles, which appears to have important role in many biochemical reactions. Indole ring constitutes one of the fundamental moiety in the strucutre of the drug such as Indoxole, Tenidap, Etodolac, hormones serotonin, Indomethacin, the psychotropic drug LSD, melatonin, and the antitumour agent vinblastine.2-4 The indole ring framework is found wide spread in nature. Indole compounds and their derivatives are used in numerous pharmacological activities like antioxidant, antifungal, antipsychotic, anti-inflammatory, cardiovascular activity, antidepressant, antimycobacterial, analgesic, antibacterial activities and anti-HBV. The present research work focuses on the efficient synthesis of novel indole derivatives and their biological evaluation.5-8
Schiff bases and their metal complexes have diversified implementations in analytical,9 biological, pharmacological clinical,10 and corrosion science areas.11 In addition they are used in specific chemical reactions as catalysts in hydrolysis,12 decomposition,13 oxygenation,14 electro-reduction,15 and enzymatic reactions.16 Metal complexes of ligands with groups like carbonyl or amino have been reported to show higher activity against many diseases17 as compared to the organic components.18,19 We report herein the synthesis and biological evaluation of methyl-2-(1H -indole-3-yl)-ethanoate derivatives (D1-D5), Schiff bases (D6-D8) and their Co(II), Cu(II), Ni(II) chelates.
Experimental
Materials
The starting compounds were obtained commercially and used without moreover refining. Indole-3-acetic acid (99 %, Tabtech Chemical), hydrazine hydrate (80 %, Aldrich), diethyl ether (99.5 %, Scharlau), ethanol(99.8 %, Riedel-de Haën), sulfuric acid (98 %, Merck), phenylisothiocyanate (97 %, BDH), sodium hydroxide (97 %, Aldrich), hydrochloric acid (37 %, Riedel-de Haën), 2-hydroxybenzaldehyde (99.8 %, Aldrich), glacial acetic acid (99.8 %, Riedel-de Haën), 2-methoxybenzaldehyde (99.8 %, Aldrich), 2-hydroxy-3-methoxybenzaldehyde (99.5 %, Aldrich), methanol (99.8 %, Riedel-de Haën) cobalt (II) chloride hexahydrate CoCl2.6H2O (99 %, Merck), acetone (99.8 %, Riedel-de Haën), nickel(II) chloride hexahydrate (98 %, B.D.H) and copper(II) chloride dihydrate CuCl2.2H2O (98%, B.D.H).
Techniques
FTIR spectra were recorded by using potassium bromide discs on a SHIMADZU (IR Affinity-1) FTIR spectroscopy at College of Education for Pure Science (Ibn-Al-Haitham), University of Baghdad. 1HNMR spectra were obtained by Ultra Shield 300 MHz, Bruker, at the University of Al-Bayt (in Jordan) while some spectra were recorded on Bruker model, ER-AV-400 MHz, at University of Science and Technology, in Jordan and are reported in ppm (δ).
Scheme 1. Synthesis of indol-bearing triazole hydrazines
Magnetic susceptibility measurements were obtained using Bruker BM6 at 298 K. Elemental microanalysis of some compounds performed on a C.H.N analyser Euro vector, model Euro EA 3000A (Italy). The TLC was performed on aluminum plate coated with a layer of silica gel, supplied by Merck. The compounds were detected by iodine vapour.
Preparation of hydrazine compounds
Step 1. A mixture of 1H-indole-3-acetic acid (0.123 mol), in absolute methanol (50 mL) and sulfuric acid (1.35 mL) was refluxed for 6 h. After cooling the mixture was washed with sodium bicarbonate solution, then washed with water several times, dried and recrystallized from ethanol to yield methyl- 2-(1H-indole-3-yl)-ethanoate (D1). Yield 94 %. Anal Calcd. for C11H11NO2: C, 69.83; H, 5.86; N, 7.40 Found: C, 6; H, 4.94; N, 20.58. IR cm-1, 3408 (NH), 3057 (CH), 2951(CH), 1732 (C=O)
Step 2. A mixture of ester compound (D1) (0.003 mol) and 80 % hydrazine hydrate (0.75 mL) in absolute ethanol (1.25 mL) was refluxed for 3 h. The mixture was cooled to room temperature, the solvent was evaporated and the solid formed was recrystallized from diethyl ether to yield 2-(1H -indol-3-yl)acetol hydrazide (D2). Yield 84 %. m.p = 144-146 ˚C. Anal Calcd. for C10H11N3O: C, 63.48; H, 5.86; N, 22.21; Found: 63.48; H, 5.86; N, 22.21. IR (cm-1) 3316, 3278, 3142 (NH, NH2), 3143, 3057 (CHaromatic), 1681 (C=O amide), 1639 (C=N), 1598, 1550, 1499 (C=C)
Step 3. A mixture of (D2) (0.001 mol) and phenyl isothiocyanate (0.135 g, 0.001 mol) in ethanol (5 mL) was refluxed for 4 h. The reaction mixture was cooled to room temperature and the solid obtained was filtered, dried and recrystallized from methanol to yield 5-((1H-indol-3-yl)methyl)-4-phenyl- 4H-1,2,4-triazole-3-thiol (D3). Yield 84 %. m.p = 144-146 ˚C. Anal. Calcd. for C17H16N6: C, 67.09; H, 5.30; N, 27.61; Found: C, 63.48; H, 5.86; N, 27.61. MS m/z: 304.14 (100. 0%), 305.15 (18.6 %), 305.14 (2.2 %), 306.15 (1.6 %) IR (cm-1) 3322, 3278, 3142, 1683. (Figure 3).1H NMR (DMSO-d
6) = 13.38 (s, 2H), 8.71 (s, 2H), 8.02 (d, 4H), 7.40 (d, 4H), 7.29 (dd, 4H), 6.90 (t, 2H), 2.35 (s, 6H).
Step 4. A mixture of (D3) (0.005mol) and 5 mL of 4% aqueous sodium hydroxide solution was refluxed for 4 h and then treated with 10 % HCl. The precipitate formed was filtered off, washed with water, and recrystallized from ethanol to afford 5-[(1H -indol-3-yl)methyl)-4-phenyl-1,2,4-triazole-3-thiol (D4). Yield 93 %. m.p = 258-260 ˚C. Anal. Calcd. for C17H14N4S: C, 66.64; H, 4.61; N, 18.29; S, 10.47. Found: C, 66.22; H, 4.31; N, 17.81; S, 10.17. MS (m/z): 306.0 (100%), 131 (18.5 %), 273, 246 (6.5 %), 229(6.5 %), 206 (6.7 %), 189 (1.3 %), 170(1.8 %), 155 (29.6 %), 130 (44. 7 %), 128 (10.9 %), 103 (11.4 %), 91 (4.8 %) 77 (31.9 %), 65 (7.8 %), 51 (12.5 %). IR (cm-1) 3404-3128 (NH, NH
2), 3047, 3012 (CH aromatic), 2974 (CH aliphatic), 1681 (C=O amide), 1548, 1460 (C=C aromatic), 1276(C=S).
Step-5. To a solution of (D4) (0.765 g, 0.0025 mol) in 5 mL of ethanol, 80 % hydrazine hydrate (0.5 mL, 0.01 mol) was added drop wise with stirring and the mixture was refluxed for 2 days, then the excess of solvent was evaporated and the solid recrystallized from chloroform to give the desired white product, of 3-[(5-hydrazinyl-4-phenyl-1, 2, 4-triazol-3-yl)-methyl]- 1H-indole (D5). The reactions are presented in Scheme 1. Yield 84 %. m.p = 144-146 ˚C, Anal. Calcd. for C17H16N6: C, 67.09; H, 5.30; N, 27.61; Found: C, 66.78; H, 5.11; N, 27.23. MS (m/z): 304.14 (100.0 %), 305.15 (18.6 %), 305.14 (2.2 %), 306.15 (1.6 %). IR (cm-1) 3362-3155 (NH, NH2), 3046 (CH aromatic), 2937 (CH aliphatic), 1681(C=O amide), 1515, 1490, 1468 (C=C aromatic) (Figure 5). 1H NMR (DMSO-d6,) = 2.50 (s, 6H, DMSO), 3.63 (b, 2H, CH2), 4.65 (s, 2H, NH2), 6.63-7.47 (m, 13H, CH=), 9.12 (s, 1H, NH), 10.0l (s,1H, NH indole ring)
Synthesis of new Schiff bases (D6-8)
Scheme 2. Synthesis of D6-D8.
2-((2-(5-((1H-indol-3-yl)methyl)-4-phenyl-4H-1,2,4-triazol-3-yl)hydrazono)methyl)-6-methoxyphenol (D6)
Yield 71 %. F. W. 408.46. Anal. Calcd. for C24H20N6O: C, 70.57; H, 4.94; N, 20.58; Found: C, 70.21; H, 4.63; N, 20.10. MS m/z 408.17 (100.0 %), 409.17 (28.2 %), 410.18 (3.3 %). IR: 3506 (OH), 3272 (NH), 3031 (CH aromatic), 2972 (CH aliphatic), 1642 (C=N), 152 (C=C aromatic) cm-1 (Figure 7). 1H NMR (DMSO-d
6, 500 MHz) = 2.52 (s, 6H, DMSO), 3.35 (s, 3H, OCH3), 6.93-7.54 (m, 13H, CH=), 8.06 (s, 1H, NH), 10.27 (s, 1H, NH), 10.53 (s, 1H, NH), 11.17 (s, 1H, OH). UV-VIS (DMSO):
max = 266, 353 nm;
37593,28328 M-1cm-1.
3-((5-(2-(2-Methoxybenzylidene)hydrazinyl)-4-phenyl-4H-1,2,4-triazol-3-yl)methyl)-1H-indole (D7)
Yield 71 %. F. W. 422.48. Anal. Calcd. for C25H22N6O: C, 71.07; H, 5.25; N, 19.89; Found: C, 71.05; H, 5.08; N, 19.23; MS m/z 422.19 (100.0 %), 423.19 (27.3 %), 424.19 (4.3 %), 423.18 (2.2 %); IR: 3267 (NH), 3042 (CH aromatic), 2968 (CH aliphatic), 1648 (C=N), 1578 (C=C aromatic), 1250 (OCH3) cm-1. 1H NMR (DMSO-d6, 500 MHz) = 2.50 (s, 6H, DMSO), 3.69 (s, 3H, OCH3) 3.94 (s, 2H, CH2), 6.40-7.57 (m, 13H, CH=), 9.32 (s,1H, CH=N), 10.32 (s, 1H, NH), 10.82 (s, 1H, NH). UV-VIS (DMSO):
max = 247, 382 nm;
40485, 28328 M-1cm-1.2-((2-(5-((1H-indol-3-yl)methyl)-4-phenyl-4H-1,2,4-triazol-3-yl)hydrazono)methyl)-6-methoxyphenol (D8)
Yield 71 %. F. W. 438.48 Anal Calcd. for C25H22N6O2: C, 68.48; H, 5.06; N, 19.17. Found: C, 68.22; H, 4.87; N, 18.84. MS m/z 438.18 (100.0 %), 439.18 (29.3 %), 440.19 (3.6 %), 440.18 (1.0 %). IR: 3522 (OH), 3257 (NH), 3082 (CH aromatic), 2973 (CH aliphatic), 1642 (C=N), 1582 (C=C aromatic), 1258 (OCH3) cm-1. 1H NMR (DMSO-d6 500 MHz) = 2.50 (s, 6H, DMSO), 3.69 (s, 3H, OCH3), 3.94 (s, 2H, CH2), 6.40-7.57 (m, 13H, CH=), 8.91 (s, 1H, CH=N), 9.12 (s,1H,NH), 9.89 (s, 1H, NH), 11.17 (s, 1H, OH). UV-VIS (DMSO): max 266, 353 nm;
= 37593, 28328 M-1 cm -1.Cu, Ni and Co complexes of ligands D6-D8
Ligand (D6-D8; 0.02 mmol) and metal salts (CuCl2.2H2O, CoCl2.6H2O, and NiCl2.6H2O; 0.01 mmol) were dissolved in ethanol (15 mL) and the mixture was refluxed for 1.5 h. The mixture was allowed to stand at room temperature for a few days. Then the precipitate formed was filtered and washed with ethanol (2 mL) and diethylether (5 mL) and dried at room temperature.
Co-complex of D6 (S1)
Yield 80 %. F. W. 873.83; Anal Calcd. for C48H38CoN12O2: C, 65.98; H, 4.38; Co, 6.74; N, 19.23. Found: C, 65.65; H, 4.11; Co, 6.53; N, 19.08. IR: 3281(NH), 3068 (CH aromatic), 2982 (CH aliphatic), 1632 (C=N), 1584 (C=C aromatic), 447 (M-O), 559 (M-N) cm-1. UV-VIS (DMSO)
max=274, 425, 873, 962 nm;
36496, 23529, 11454, 10395 M-1 cm-1.Ni-complex of D7 (S2)
Yield 77 %. F. W. 873.59. Anal Calcd. for C48H38N12NiO2: C, 65.99; H, 4.38; N, 19.24; Ni, 6.72; . Found: C, 65.43; H, 4.23; Ni, 18.84; Ni, 6.54. IR: 3278 (NH), 3071 (CH aromatic), 2968 (CH aliphatic), 1634 (C=N), 1580 (C=C aromatic), 450 (M-O), 558 (M-N) cm-1. UV-VIS (DMSO)
max=279, 364, 682, 981 nm;
35842, 27472, 14662, 10193 M-1cm-1.Cu-complex of D8 (S3)
Yield 64 %. F. W. 878.44. Anal. Calcd. for C48H38CuN12O2: C, 65.63; H, 4.36; Cu, 7.23; N, 19.13; Found: C, 65.23; H, 4.21; Cu, 7.09; N, 18.85. IR: 3283 (NH), 3075 (CH aromatic), 2973 (CH aliphatic), 1630 (C=N), 1576 (C=C aromatic), 441 (M-O), 558 (M-N) cm-1. UV-VIS (DMSO)
max=271, 758 nm;
36900, 13192 M-1cm-1.Co-complex of D6 (S4)
Yield 74 %. F. W. 973.81. Anal. Calcd. for C50H43CoN12Cl2O2: C, 61.67; H, 4.45; Co, 6.05; N, 17.26 Cl, 7.28; Found: C, 6l.20; H, 4.08; Co, 6.12; N, 17.02; Cl, 6.89. C, 65.23; H, 4.21; Cu, 7.09; N, 18.85. IR: 3261 (NH), 3071 (CH aromatic), 2992 (CH aliphatic), 1673 (C=N), 1574 (C=C aromatic), 1239 (OCH3) cm-1. UV-VIS (DMSO)
max =268, 345, 728, 758 nm;
37313, 28985, 14749, 13850 M-1cm-1.Ni-complex of D7 (S5)
Yield 62 %. F. W. 973.57. Anal Calcd. for C50H43Cl2N12NiO2: C, 61,69; H, 4.45; N, 17.26; Ni, 6.07 ; Cl, 7.26; Found: C, 61.08; H, 3.78; Ni, 16.96; Ni, 5.87; Cl, 6.77. IR: 3268 (NH), 3068 (CH aromatic), 3063 (CH aliphatic), 1634 (C=N), 1571 (C=C aromatic), 1242 (OCH3), 448 (M-O), 559 (M-N) cm-1. UV-VIS (DMSO)
max=262, 328, 682 nm;
38167, 30487, 14662 M-1cm-1.N H
N
N N
NHNH2 Ph
CHO
R1
R2 +
reflux 7 h
N H
N N
NHN Ph
R1 R2 (D5)
Cu-complex of D8 (S6)
Yield 69 %. F. W. 978.42. Anal Calcd. for C50H43Cl2CuN12O2: C, 61.38; H, 4.43; Cu, 6.49; N, 1718 Cl, 7.25; Found: C, 65.23; H, 4.21; Cu, 7.09; N, 18.85. IR: 3261 (NH), 3078 (CH aromatic), 2971 (CH aliphatic), 1636 (C=N), 1574 (C=C aromatic), 1240 (OCH3), 449 (M-O), 560 (M-N) cm-1. UV-VIS (DMSO)
max=266, 372, 478 nm;
37593, 26881, 20920 M-1 cm-1.Co-complex of D6 (S7)
Yield 61 %. F. W. 933.28. Anal Calcd. for C50H42CoN12O4: C, 64.31; H, 4.53; Co, 6.31; N, 18.00; Found: C, 64.11; H, 4.32; Co, 6.15; N, 17.87. IR: 3261 (NH),
3078 (CH aromatic), 2971 (CH aliphatic), 1636 (C=N), 1574 (C=C aromatic), 1240 (OCH3), 442 (M-O), 551 (M-N) cm-1. UV-VIS (DMSO)
max=249, ?, 522, 699, 786 nm;
40160, 28818, 19157, 14947, 12722 M-1 cm-1.Ni-complex of D7 (S8)
Yield 78 %. F. W. 933.64; Anal Calcd. for C50H42N12NiO4: C, 64.32; H, 4.53; Ni, 6.29; N, 18.00; Found: C, 64.22; H, 4.31; Ni, 6.09; N, 17.82. MS (m/z): 438.18 (100.0 %), 439.18 (29.3 %), 440.19 (3.6 %), 440.18 (1.0 %). IR: 3261 (NH), 3078 (CH aromatic), 2971 (CH aliphatic), 1636 (C=N), 1574 (C=C aromatic), 1240 (OCH3), 458 (M-O), 572 (M-N) cm-1. UV-VIS (DMSO)
max =243, 363, 522, 897 nm;
41152, 27548, 19157, 11148 M-1 cm-1Scheme 3. Formation of metal complexes of D6.
Scheme 4. Formation of metal complexes of D7.
Scheme 5. Formation of metal complexes of D8.
N H
N N
N NH
Ph
N
HO
MCl
2
NH N N
N H N
Ph
N
O
HN N N
N H N
Ph N
O
M 2
M= Cu(II), Ni(II) and Co(II) D6
N H
N N
N NH N H3CO
2
N H
N N
N HN N
OCH3
H N
N N N NH N H3CO
M
MCl
2M= Cu(II), Ni(II) and Co(II)
Cl
Cl
Ph
Ph Ph
D7
N H
N N
N NH
Ph
N
HO
MCl
2NH N N
N H N
Ph
N
O
HN N N
N NH
Ph
N O
M
2
H3CO OCH
3
H3CO
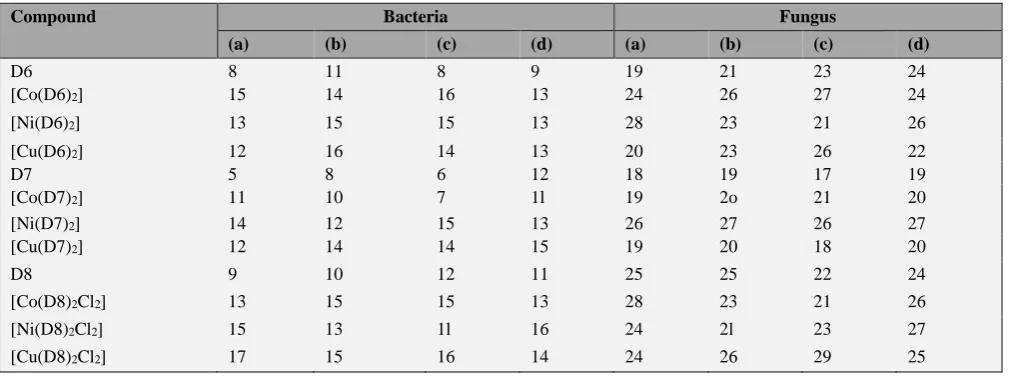
Table 1. Results of antibacterial bioassay (concentration used 100 μg mL-1 in DMSO). (a) E. coli, (b) S. aurous (c) B. subtilis (d) P. aeruginosa. Antifungal bioassay (concentration used 200 μg mL-1). (a) A. niger (b) A. flavus (c) R. stolonifer and (d) C. albicans .10 <: weak; > 10: moderate; > 16: significant.
Cu-complex of D8 (S9)
Yield 68 %. F. W. 938.49. Anal Calcd. for C50H42CuN12O4: C, 63.99; H, 4.51; Cu, 6.77; N, 17.91; Found: C, 63.71; H, 3.96; Cu, 6.12; N, 17.65. MS (m/z): 438.18 (100. 0%), 439.18 (29.3 %), 440.19 (3.6 %), 440.18 (1.0 %). IR: 3261 (NH), 3078 (CH aromatic), 2971 (CH aliphatic), 1636 (C=N), 1574 (C=C aromatic), 1249 (OCH3), 461 (M-O), 548 (M-N) cm-1. UV-VIS (DMSO)
max=247, 358, 486, 576 nm;
40485, 27932, 19157, 17361 M-1 cm-1.Results and Discussion
3-((5-Hydrazinyl-4-phenyl-4H-1,2,4-triazole-3-yl) methyl)-1H-indole (D5) was synthesized through a 5-step reaction route. Reaction of (D5) with three different substituted benzaldehydes viz., hydroxy-benzaldehyde, 2-methoxybenzaldehyde and 2-hydroxy-3-methoxy-benzaldehyde in ethanol afforded Schiff bases (D6-8). Yields were fair to moderate (55-70 %). The purity of the compounds was monitored by TLC. These ligands were treated with Cu(II), Co(II) and Ni(II) salts to yield the corresponding complexes.
All the newly synthesized the new ligands (D6-D8) and their metal complexes were screened in vivo to evaluate their antibacterial and antifungal efficiencies. These compounds were tested for their antibacterial and antifungal efficiencies are lies in table 1.
The IR spectrum of the (D6) exhibits a new squeaky band at 1642 cm–1, attributed to HC=N imine group, which is not present in its precursors, which indicate formation the ligand.1,2 In the IR spectra of the complexes, this band has shifted to lower side at about 1634 -1637 cm-1. The IR spectrum of ligand exhibited a band at 3506 cm-1 due to υ(OH), this band has disappeared in the spectra of complexes.3 This supports the prpoposition that the ligand coordinate to the metal ions through the nitrogen of υ(C=N) group and oxygen in all the complexes.4
The IR spectrum of the ligand (D7), showed a new band at 1648 cm–1, attributed to HC=N imine group, not present in its precursors, which indicate formation the ligand.5 While in IR spectra of the complexes this band has shifted to a lower frequency of about 1634 -1637 cm–1. In the IR spectrum of ligand exhibited band at 1250 cm-1 due to υ(C-O), while in complexes spectra this absorption band was shifted at lower in the range (1244-1248) cm–1, indicating that the nitrogen of the amino group and oxygen of OCH3 group participate in metal coordination.6 The IR spectrum of the ligand (D8), showed the new characteristic band at 1648 cm–1, attributed to HC=N imine group, not present in its precursors, which indicate formation the ligand.8
However, in IR spectra of the complexes this band has shifted to a lower vibration in the region of 1634 -1637 cm–1. The spectrum also displayed a band at 1258 cm-1 due to υ(C-O), while in complexes spectra this absorption band was shifted to a lower range of 1242-1252 cm–1, suggesting that the nitrogen of the amino group and oxygen of OCH3 group participate in the metal coordination. Finally, the IR spectra of all the complexes, exhibited new bands at the regions of 437-472 and 522-562 cm-1, which could be assigned to the ν(M-O) and ν(M-N) stretching vibration modes respectively.9
The UV spectrum of complex (S1) showed a peak at 274 nm which has been assigned to (π → π*) electronic transition. The peaks at 425 nm 873 nm and 962 nm can be assigned to spin-allowed (d-d) electronic transitions of type (4A
2→4T1(P)), (4A2→4T1(f)) and (4A2→4T2(f)) respectively. All (d-d) electronic transitions for complex Co(II) suggest a tetrahedral structure around the central metal ion.10
The UV spectrum of the complex (S2) showed a peak at 279 nm assigned to (π → π*) electronic transition. The peaks at 364 nm 682 nm and 981 nm which can be assigned to spin-allowed (d-d) electronic transition type (3T
1→ 3T1(P)), (3T
1→3A2) and (3T1→3T1(f)) respectively. All (d-d) electronic transitions for Ni(II) complex suggest a square planar structure around the central metal ion.11
Compound Bacteria Fungus
(a) (b) (c) (d) (a) (b) (c) (d)
D6 8 11 8 9 19 21 23 24
[Co(D6)2] 15 14 16 13 24 26 27 24
[Ni(D6)2] 13 15 15 13 28 23 21 26
[Cu(D6)2] 12 16 14 13 20 23 26 22
D7 5 8 6 12 18 19 17 19
[Co(D7)2] 11 10 7 1l 19 2o 21 20
[Ni(D7)2] 14 12 15 13 26 27 26 27
[Cu(D7)2] 12 14 14 15 19 20 18 20
D8 9 10 12 11 25 25 22 24
[Co(D8)2Cl2] 13 15 15 13 28 23 21 26
[Ni(D8)2Cl2] 15 13 1l 16 24 2l 23 27
The UV spectrum of the complex (S3) showed a peak at 271 nm assigned to (π → π*) electronic trnasition. The peak at 758 nm which can be assigned to spin-allowed (d-d) electronic transition type (2B
1g→ 2B2g(P)), transition. The (d-d) electronic transition for Cu(II) complex suggests a square planar structure around the central metal ion.12
The UV spectrum of complex (S4) showed peak at 268 nm assigned to (π → π*) electronic transition, while the spectrum showed an intense peak at 345 nm, which can be due to (n→ π*) electronic transition for intra-ligand. The peaks at 687 nm and 722 nm can be assigned to spin-allowed (d-d) electronic transition type (4T
1g(f)→4A2g(f)) and (4T
1g(f)→4T2g) transitions respectively. All (d-d) electronic transitions for complex Co(II) suggest an octahedral structure around the central metal ion.12
The UV spectrum of complex (S5) showed an intense peak at 262 nm, assigned to (π→π*) electronic transition for intra-ligand, while another intense peak at 328 nm may well be due to (n→π*) electronic transition for intra-ligand. The peaks at 682 nm may be assigned to spin-allowed (d-d) electronic transition type (3A
2g→3T1g(f)), suggesting an octahedral geometry around Ni(II).14
The UV spectrum of complex (S6) showed an intense peak at 266 nm, assigned to (π→π*) electronic transition for intra-ligand, while the intense peak at 372 nm can be due to (n→π*) electronic transition for intra-ligand. The peak at 478 nm may relate to spin-allowed (d-d) electronic transition type (2Eg→ 2T
2g) transitions, suggesting a distorted octahedral around Cu(II) metal.15
The UV spectrum of complex (S7) showed a peak at 249 nm, assigned to (π → π*) electronic transition, while the intense peak at 347 nm can be due to (n→ π*) electronic transition for intra-ligand. The peaks at 522 nm, 669 nm and 786 nm can be assigned to spin-allowed (d-d) electronic transition type (4T
1g→ 4T1g(P)), (4T1g→4A2g) and (4T
1g→4T2g) transitions respectively. All (d-d) electronic transitions for complex Co(II) suggest an octahedral structure around the central metal ion.16
The UV spectrum of complex (S8) showed an intense peak at 243 nm assignable to (π→π*) electronic transition for intra-ligand, while intense peak at 363 nm can be due to (n→π*) electronic transition for intra-ligand. The peaks at 522 nm and 897 nm may be assigned to spin-allowed (d-d) electronic transition type (3A
2g→3T1g(P)), (3A2g→3T1g) and (3A
2g→3T2g) transitions respectively suggesting an octahedral geometry around Ni(II).17
The UV spectrum of complex (S9) showed an intense peak at 247 nm assignable to (π→π*) electronic transition for intra-ligand, while the intense peak at 358 nm may be due to (n→π*) electronic transition for intra-ligand. The peaks at 486 nm and 576 nm refer to spin-allowed (d-d) electronic transition type (2B
1g→2Eg) and (2B1g→2A2g) transitions, suggesting a distorted octahedral around Cu(II) metal.18
Conductivity and magnetic moment measurements
The molar conductance of the complexes (S1- S9) was measured in ethanolic solutions. The conductances of all the
complexes were in the range 12.3-l9.2 S cm2 mole–1, indicating the non-electrolytic nature of the complexes.
The magnetic moment values are found to be 2.87and 1.87 BM, for (S2) and (S3) complexes, respectively, suggesting a square planar geometry, while 5.68 BM, for (S1), suggests a tetrahedral geometry. The values for (S4-S9) complexes are 5.36, 2.87, 1.84, 5.27, 2.91 and 1.83 BM, respectively, suggesting an octahedral geometry for these complexes.
1H NMR spectra
1H NMR spectrum of the Schiff base (D5) (Figure 8) showed a singlet at 2.50 ppm for 6 protons for DMSO, a singlet at 3.63 ppm for two protons of CH2 group and a board signal at 4.63 ppm for two protons of NH2 group. Also, signals in range 6.63-7.54 ppm that may be assigned to the 13 aromatic protons of phenyl rings. Finally, one proton of NH of indole ring gives a singlet at 9.12 ppm and a singlet signal at 10.01 ppm for one proton of NH group.19
1H NMR spectrum of Schiff base (D6) (Figure 9) showed a singlet at 2.52 ppm for 6 protons for DMSO, a singlet at 3.35 ppm for two protons of CH2 group, signals in the range of 6.93-7.54 ppm that might have resulted due to the thirteen aromatic protons of phenyl rings. Also, the spectrum shows a singlet at 8.06 ppm for one proton of the CH=N group. The one proton at NH of indole ring gives as a a singlet at 10.27 ppm and a singlet at 10.53 ppm for one proton of NH group. Finally, a singlet at 1l.17 ppm for one proton of OH group.20
1H NMR spectrum of Schiff base (D7), (Figure 10) presented singlet signal at 2.50 ppm for 6 protons for DMSO, a singlet at 3 69 ppm for three protons of OCH3 group, a singlet at 3.94 ppm for two protons of CH2 group, signals in region of 6.40-7.57 ppm that could be due to the thirteen aromatic protons of phenyl rings. Also, the spectrum shows singlet at 9.32 ppm for one proton of the CH=N group. And one proton at NH of indole ring appears as a singlet at δ 10.32 ppm. Finally, a singlet at 10.82 ppm for one proton of NH group.20
1H NMR spectrum of Schiff base (D8) (Figure 11) showed singlet at 2.50 ppm for 6 protons for DMSO, a singlet at 3.69 ppm for three protons of OCH3 group, a singlet at 3.94 ppm for two protons of CH2 group, signals in range of 6.40-7.57 ppm that may be assigned to the thirteen aromatic protons of phenyl rings. In addition, the spectrum shows a singlet at 9. 32 ppm for one proton of the CH=N group. The one proton of NH of indole ring appears as a singlet at 9.12 ppm and a singlet at of 9.89 ppm for one proton of NH group. Finally, a singlet at of 1l.17 ppm for one proton of OH group.21
Mass spectrum
The mass spectrum (Figure 12) of compound (D4),22 showed a molecular ion at m/z = 306, which is correspond to the molecular weight of the structure suggested for this compound. The spectrum exhibited various peaks assigned to part of indol (m/z = 103, 91) and triazole ring at (m/z = 247, 191 and 156). This spectrum also showed peaks at m/z
Antimicrobial screening
The antifungal and antibacterial efficacies of the compounds were studied against the pathogenic organisms by the disc diffusion method. The bacteria screened were as
E. coli, S. aurous, B. subtitles, P. aeruginosin, and fungi were as A. niger, A. flavours, R. stolonifera and C. Albicans.23
The synthesized compounds were used in the concentration of 100 μg mL-1 using DMSO as a solvent, ? was used as a standard against both organisms.
The test results, presented in the Table 1, suggest that all the complexes exhibit high activity against the tested bacteria, the rest of the compounds were found to be moderate.
References
1Ravinder S. B., Sakshi S., Suresh, P. K., Jagir S. S., Int. J. Med. Chem., 2013, 1-16, https://doi.org/10.1155/2013/793260
2Paulrasu K., Arul D., Thirunavukkarasu B., Pravin S. A., Kunal R., Int. J. Mol. Cell Med., 2015, 4, 128-137.
3Abdel-Aziz, M., Abuo-Rahma, G. E. A., Hassan, A. A., Eur. J. Med. Chem., 2009, 44, 3480.
https://doi.org/10.1016/j.ejmech.2009.01.032
4Rostom, S., Bioorg. Med. Chem., 2010, 18, 2767.
https://doi.org/10.1016/j.bmc.2010.02.006
5E. Musad, R. Mohamed, B.A. Saeed, B.S. Vishwanath, K.M.L. Rai, Bioorg. Med. Chem. Lett., 2011, 21, 3536. https://doi.org/10.1016/j.bmcl.2011.04.142
6Hazra, K., Nargund, L. V. G., Rashmi, P., Chandra, J. N. N. S., Nandha, B., Der Chemica Sinica, 2011, 2, 149.
7Kagthara, P., Teja, S., Rajeev, D., Parekh, H., Indian J. Heterocycl. Chem., 2000, 10, 9.
8Singh, G., Mmolotsi, B., Il Farmaco., 2005, 60, 727.
https://doi.org/10.1016/j.farmac.2005.06.008
9Patel, H., Patel, V., Oriental J. Chem., 2004, 17, 425.
10Sharma, P., Kumar, A., Sharma, V., Indian J. Chem., 2004, 43, 385.
11Kumar, P., Sharma, R., Mohan, P., Indian J. Chem., 2003, 42, 416.
12Srivastava,S., Dua, R., Srivastava, S., Proc. Nat. Acad. Sci. India., Sec. A: Phys. Sci. 2010, 80, 117.
13Trivedi, P., Undavia, N., A. Dave, A., Bhatt, K., Desai, N., Indian J. Chem., 1993, 32B (7), 760.
14Panwar, H., Verma, R. S., Srivastava, V. K., Kumar, A., Indian J. Chem., 2006, 45B, 2099.
15Siddiqui, N., Rana, A., Khan, S., Haque, S., Alam, M., Ahsan, W., Arshada, M., Acta Chim. Slov., 2009, 56, 462.
16Srivastava, S. K., Srivastava, S. L., Srivastava, S. D., Indian J. Chem,, 2000, 39B, 464.
17Anna, P., Nikaljea, P., Mudassir, S., Narutea, A., Ghodkea, S., Rajanib, D., Der Pharmacia Sinica., 2012, 3(2), 229-238. 18Gunwanti, M., Gothwal, P., Srivastava, Y., Der Chemica Sinica,
2011, 2 (3), 47-50.
19Sharma, M., Kohlia, D., Sharma, S., Sharma, A., Der Pharmacia Sinica, 2010, 1 (1), 82-94.
20Kumar, P., Subramaniyan, S., Yamini, K., Suthakaran, R., Rasayan J. Chem., 2011, 4(2), 400-404.
21Patila, B., Machakanura, S., Hunoora, R., Badigera, D., Der Pharma Chemica, 2011, 3(4), 377-388.
22Vogel, A. I., Textbook of Quantitative Organic Chemistry, 1974 , 3rd Ed Longman Group Ltd., London.
23Al-Rawi, M., Tomma, J., Abdullah, R., Ibn Al-Haitham J. Pure Appl. Sci., 2013, 26(1), 208-217.
24Khalid F., Ali Kadhim M., Jumbad, L., Tomma, H., Ibn Al-Haitham J. Pure Appl. Sci., 2014, 27 (3), 421-434