ISSN: 2347-7474 International Journal Advances in Social Science and Humanities
Available Online at: www.ijassh.com
REVIEW ARTICLE
Solar Energy Generation in Uttar Pradesh, India Using the United
States of America as a Model
Dr. Babita Srivastava*
Co-Researcher, William Paterson University, Wayne, NJ, United States
*Corresponding Author: Email: [email protected]
Abstract
Uttar Pradesh (UP) is located in the northern part of India and is home to 200 million people. It is the most populated state in the country as well as the most populated country subdivision of the world. UP experiences power crises because the demand for electricity frequently exceeds supply significantly. Over the last 20 years, power shortages have remained within the range of 10-15%, while shortages in periods of peak demand reaches at even higher levels. This results in poor unreliable power supply with rampant power cuts and prolonged periods of low voltage. Since the UP is in such a state, the government has attempted to fix he issue by creating the State Electricity Act, which require UP to purchase 5% of electricity from renewable sources, and a portion of that must be from solar energy. Looking to the United States as a model, this paper will enumerate points that will only help UP’s energy crisis.
Keywords:Renewable Energy, Solar energy, India, Uttar Pradesh, United States, Model, Energy crisis,
Electricity.
Uttar Pradesh (UP) experiences power crises because the demand for electricity frequently exceeds supply significantly. Over the last 20 years, power shortages have remained within the range of 10-15%, while shortages in periods of peak demand reaches at even higher levels. In 2013, even a gap of up to 43% opened up between the state's demand and supply of electricity. As per figures presented in the Power Ministry’s review meeting in March, the state's projected demand for summer 2013-14 is 15,839 MW showing a gap of 6,832 MW [1]. This results in poor and unreliable power supply with rampant power cuts and prolonged periods of low voltage. As a consequence, industrial investment in Uttar Pradesh has been constrained, with industries preferring to locate themselves elsewhere [2].
This situation also repeatedly forces the UP government to purchase power for high prices from other states in India. In 2011, for example, the UP government bought power at rates as high as Rs 17 per unit from the
central pool to ensure adequate supply in the state [3]. This practice regularly incurs significant financial losses to the State Electricity Board, which, in part, have to be borne by the UP state government, constraining the state’s expenditures in areas of social development, such as education and public health [4].
In 1999, the UP government tried to address the problems of growing power shortage and poor financial condition of the State Electricity Board (SEB) by reforming UP’s power sector.
Kanpur Electricity Supply Company (KESCO) was formed as a 100% subsidiary of UPPCL [5].
However, the UP Electricity Reform Act, formulated in 1999, had several shortcomings, which is a major reason for the problems of the UP power sector to persist until today. Besides not curtailing the enormous powers of the Uttar Pradesh Energy Regulatory Commission by making it accountable, and besides omitting the promotion of efficiency and energy conservation, the act did not address the main reasons for the financial problems of
the SEB: High cost of power purchase in relation to the lower tariffs for consumers, which are determined by the UP government (no tariff adjustment), and arbitrary depreciation methods [6].Additionally, the unbundling of the power sector was limited and did not lead to competition [7].
Energy Capacity
The installed energy capacity by energy type and by section in UP are provided in table 1 and table 2, respectively. Thermal by Coal is a primary source of energy capacity in UP, which is not different from the other states in the county.
Table 1: Installed generation capacity in March 2009 and 2010 in MW [8]
03.2009 03.2010
Hydro 530 520
Thermal 4120 4370
New & Renewable 400 590
Total 5050 5480
Table 2: Installed generation capacity by sector in March 2013 in MW [9]
Thermal Total
Thermal
Nuclear Hydro Renewable Energy
Grand Total
Coal Gas
State 4923 0 4923 0 524 25 5472
Private 3090 0 3090 0 0 799 3889
Central 2749 550 3300 336 1297 0 4933
Total 10763 550 11313 336 1821 824 14294
Energy Consumption
The overall energy consumption, and the consumption by section, is provided in Table 3 and Table 4, respectively. In 2009-10, the
average per capita energy consumption in UP amounted to 387 KW/h, while the country’s per capita energy consumption stands at 734 KWh in 2008.
Table 3: Total energy available for sale in million units (MU) [10]
Year Total Energy
Available
Transmission Losses Total Energy Available for Sale
% of Loss
2008-09 56374 16844 39530 30
2009-10 61040 19677 41363 32
2010-11 65599 20344 45255 31
Table 4: Electricity Consumption by Sector [11]
Year Industrial in MU (%) Agriculture in MU (%) Domestic in MU (%) Commercial in MU (%)
2008-09 10153 (25.67) 6841 (17.12) 15809 (40.02) 2925 (7.40) 2009-10 10739 (26.23) 7317 (17.87) 15894 (38.82) 3106 (7.58) 2010-11 10558 (24.50) 7891 (18.30) 16230 (37.60) 3072 (07.1) Energy Supply
The energy demand and supply, as well as the surplus, are provided in Table 5 and Table 6, respectively. In 2009-10, the average per capita energy consumption in UP amounted to 387 KW/h, while the country’s per capita energy consumption stands at 734 KWh in 2008. High
boosting the yearly deficits. In 2009, UP reported distribution losses of about 38%, which are higher than the national average T&D loss of 25.4%.15The Average Energy Tariff Structure is
shown in Table 7.
while it stands at Rs. 3.4 KW/h for domestic consumers.
Table 5: Demand and Supply in Million Units (MU), and gap between those figures in % [12-14]
Year Energy
Requirement (MU) Availability (MU) Surplus (+) / Deficit (-) (MU) Surplus (+) / Deficit (-) in %
2011-12 76,292 64,846 -11,446 -15.0
2012-13 83,938 70,058 -13,880 -16.5
Table 6: Peak Demand and Peak Supply
Year Peak Demand in MW Peak Supply in MW Surplus (+) / Deficit
(-) in MW Surplus (+) / Deficit (-) in %
2012-2013 13,940 12,048 -1,892 -13.6
Table 7: Average Energy Tariff Structure [16] Average Energy Charges (Rs./KWh) for Industrial
Consumer Average Energy Charges (Rs./KWh) for Domestic Consumer
3.2 2.4
Status of Solar Energy in Uttar
Pradesh
Under the State Electricity Act 2003, the various state-level electricity regulators have specified a renewable purchase obligation. Accordingly, a set percentage of power must come from renewable sources. In the case of UP, this target has been set at 5%, of which 0.5% has to be from solar energy. However, UP has failed to achieve this target by falling short of about 50% [17].
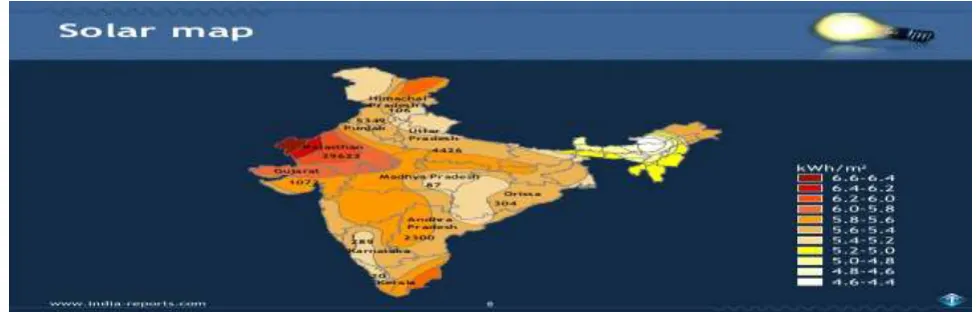
Uttar Pradesh also lags behind other states in the country in production of electricity through solar energy. While Gujarat produces 850 MW of electricity through solar energy, followed by Rajasthan at 201 MW, in Uttar Pradesh this figure is a meager.
The first megawatt-capacity solar power plant had become operational in Uttar Pradesh in January 2013 in Barabanki (a 2 MW project) [18].
Fig 1: Solar Map of India
Status of Solar Energy in United States of America
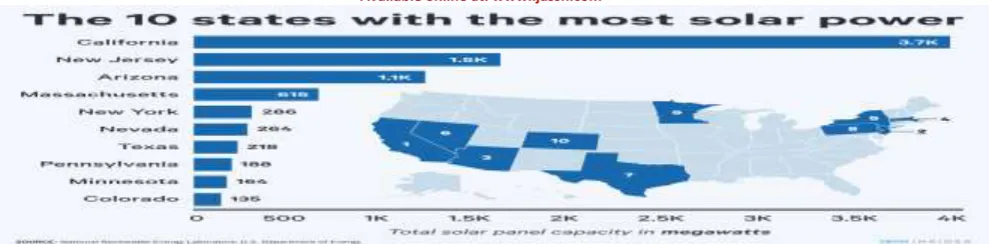
The amount of electricity generated by the U.S. utility-scale solar photovoltaic power plants is up more than 100 percent in 2014 over the same period in 2013, which is mostly thanks to big projects, many of them highly productive, that have been coming online.
Figure 2: Top 10 States with the most Solar Power
Through September, utility-scale solar had sent 12,303 gigawatt-hours of electricity to the U.S. grid (actually a collection of grids), compared to 6,048 GWh in the same period in 2013,according to the U.S. Energy Information Administration [19]. That was enough to meet the electricity needs of 1,513,703 average U.S. homes, and represented about 0.4 percent of the nation’s electricity. With continued growth and adding in commercial and residential PV as well as concentrating solar power, solar electricity could easily account for 1 percent of U.S. generation by the end of this year.
That might sound like a relatively small amount, but as recently as 2008. solar was at virtually zero-and the steep ramp-up makes solar advocates optimistic that big gains could be realized in the coming years.
In late November, a report [20] from the group Environment America made the case that the U.S. could, and should, set a goal of “obtaining at least 10 percent of its electricity from solar power by 2030.” The group said, to accomplish that, solar capacity would need to grow at an annual rate of 22 percent between 2013 and 2030-slower than what has been seen in recent years.“Given the growth of solar over the last few years, getting to 10 percent of U.S. electricity from solar should happen far sooner than 2030,” Sun Edison founder and clean energy entrepreneur Jigar Shah said in a statement released with the report.
Potential hurdles are out there. Under the current law, the federal tax credit, now valued at 30 percent of a project’s cost, falls to 10 percent for projects put in service after 2016. In a number of states, too, utilities have met or are close to meeting their
renewable energy requirements under renewable portfolio standard laws. In addition, solar advocates and utilities are increasingly at odds over how to value “customer-sited” solar; evolved business models for utilities could be necessary to make the 10 percent solar goal a reality. Some solar developers also say [21] duties on solar products from China and Taiwan could slow growth.
Perhaps the biggest point of uncertainty is the fate of the Obama administration’s proposed Clean Power Plan, which will force states to trim existing power plant carbon emissions. If implemented as planned, it would drive more solar-friendly policies. Still, on price alone, solar figures to be a growing part of the energy picture.
According to research by the Berkeley Lab [22], “The price of electricity sold to utilities under long term contracts from large-scale solar power projects has fallen by more than 70% since 2008, to just $50/MWh on average within a sample of contracts signed in 2013 or 2014 and concentrated among projects located in the southwestern United States”. The performance of the PV plants backed by the Obama administration should give investors confidence that production targets can be met.
Take the case of California Valley Solar Ranch, owned by NRG Energy and built using Sun Power technology. On the broad, sunny Carrizo Plain in inland San Luis Obispo County, the 250-MW plant was expected to produce 662,000 MWh of electricity annually, on average, for buyer Pacific Gas & Electric. In fact, in its first full year of operation - the 12-month period through September 2014-it generated 697,759 MWh, according to EIA data.
through the U.S. Department of Energy’s 2009 stimulus-enhanced guaranteed loan program. But that same plant today would certainly be less expensive, perhaps dramatically less expensive. For example, a nearly identical plant proposed to be built about 100 miles north of California Valley Solar Ranch – it would be 247 MW in size and produce 666,000 MWh annually, according to a power purchase agreement with Southern California Edison-will reportedly [23] cost $600 million.
Solar Energy Opportunities in Uttar Pradesh
The majority of power generated in Uttar Pradesh is reliant on coal, while the limited availability and high prices of coal have aggravated the precarious power situation in UP. Hence, there is an obvious need to develop alternate sources of energy.
Uttar Pradesh is blessed with a good solar irradiation to the tune of 1,800 KW/h per m² on an annual average basis, which is considered necessary for operating a solar photovoltaic power plant. Thus, there are immense possibilities in this sector [24] Growth of renewable energy would definitely help the state in meeting its energy requirements [25].
In January 2014, the Uttar Pradesh Cabinet approved the first-ever solar energy policy of the state. Under this policy, a target of producing 1000 MW of electricity through solar energy has been set by March 2017. For the purpose of promoting production of electricity by solar energy, a U.P. renewable energy fund has been created [26]. The UP government has zealously taken up the agenda of augmenting solar power generation and consumption, both on-grid and off-grid.
The government had announced a solar energy policy, which promises incentives to entrepreneurs setting up solar power plants. Besides, the state has been promoting rooftop solar plants for small companies and individuals. This would not only provide a green and renewable energy source, but also reduce the burden on the grid.
The 30% central subsidy provided on solar power installations has only added to the attractiveness of the proposition. After
subsidy, a typical solar power system costs about Rs 1.40 lakh per kw capacity; although, the final price largely depends upon the battery strength.
State government finalized agreements with seven private power players and a public sector undertaking to produce 230 MW of solar power [27]. At a function on Thursday, Chief Minister Akhilesh Yadav handed out Letter of Intents to Jakson Power Solutions, Moser Bayer Clean Energy Ltd, Sree Developers,DK Infracon, Refax En ergy, Azure Surya Ltd and Essel Infra.
These private sector firms would together be setting up solar power plants of a total 130 MW capacity.
These companies would be purchasing land directly from the farmers and are expected to be commissioned within six months after the land is in possession. The Joint MD, Jakson Power Solutions, Sundeep Gupta said that they would be investing Rs 80 crore within one year to establish a 10 MW solar plant. He said that they have identified some land parcels in the Bundelkhand region of the state and expect their project to be commissioned in 6 months time.
Jakson Power Solutions has already commissioned a 2×10 MW solar project in Rajasthan in February this year and is ambitious on growing their solar power portfolio. “We are scouting for several opportunities and would also be exploring the option of setting up one more solar plant in Uttar Pradesh” Gupta said.
The state government has also signed an MoU with public undertaking the National Hydro Power Corporation Ltd (NHPC) to set up a 100 MW solar plant in Jalaun district of Bundelkhand region. As fossil fuels are non-renewable sources, we cannot depend on them forever. Though nuclear energy is a clean and green energy, there are always some problems associated with it. Therefore, the only option we have is solar energy because it is a nonpolluting and silent source of electricity. Most solar energy systems do
funds into maintaining the machine will be a non-issue. Also, most systems have a lifespan of 30 to 40 years, creating long lasting energy.
Solar energy easily can be converted into electrical energy. Solar panels can convert the light energy into electrical energy. A solar panel is a group of solar cells, which works on the principle of photoelectric effect. Office buildings, schools, community roof areas can all be covered with solar panels.
In conclusion, to achieve the energy requirement in the state of UP and to\
maintain the economy growth, the following should be considered:
Government should take measures and see that solar lights are used as street lights in all the areas
Place solar panels in the barren lands instead of keeping it away uselessly and keep these solar panels in the deserts, where they can make use of this energy with the help of a rechargeable battery.
Efficiency of solar panels depends on the range of frequencies of light that strikes the surface. If we split the light into different frequency ranges and direct the beams onto the cells tuned to these frequencies, they can work at a higher efficiency.
References
1. The Times of India (Apr 2013). Power Crisis looms over UP,http://bit.ly/HIZTDM
2. Planning Commission, GoI (2004). Uttar
Pradesh Development
Report.http://planningcommission.nic.in/plan s/stateplan/upsdr/vol-2/Chap_b7.pdf.
3. The Economic Times (2011). Greenpeace called upon Uttra Pradesh government to demand a bigger share of decentralised renewable
energy. http://articles.economictimes.indiati
mes.com/2011-10- 21/news/30306656_1_renewable-energy-rggvy-arpana-udupa
4. Planning Commission, GoI (2004). Uttar
Pradesh Development
Report.http://planningcommission.nic.in/plan s/stateplan/upsdr/vol-2/Chap_b7.pdf
5. Review on Power Sector Reforms in Uttar Pradesh. http://bit.ly/1i0Xfr2
6. Gurtoo, A. and Pandey, R. (2001): Power Sector in Uttar Pradesh: Past Problems and Initial Phase of Reforms, Economic and Political Weekly 36 (31), pp. 2943-2953. 7. Planning Commission, GoI (2004). Uttar
Pradesh Development
Report.http://planningcommission.nic.in/plan s/stateplan/upsdr/vol-2/Chap_b7.pdf.
8. PHD Chamber of Commerce and Industry (2011). Comparative Study on Power Situation in the Northern and Central States of
India. http://www.phdcci.in/admin/admin_log ged/banner_images/1334554564.pdf.
9. Central Electricity Authority (CEA) (2013). Monthly Executive Report, March 2013.http://www.cea.nic.in/reports/monthly/e xecutive_rep/mar13/mar13.pdf
10. UPPCL (2010-11). Statistics at a Glance
2010-11.http://www.uppcl.org/uppcllink/documents /14022013030910Statistics_UPPCL_2010_11. pdf.
11. UPPCL (2010-11). Statistics at a Glance
2010-11.http://www.uppcl.org/uppcllink/documents /14022013030910Statistics_UPPCL_2010_11. pdf.
12. PHD Chamber of Commerce and Industry (2011). Comparative Study on Power Situation in the Northern and Central States of
India. http://www.phdcci.in/admin/admin_log ged/banner_images/1334554564.pdf.
13. PHD Chamber of Commerce and Industry (2011). Comparative Study on Power Situation in the Northern and Central States of
India. http://www.phdcci.in/admin/admin_log ged/banner_images/1334554564.pdf.
14. Central Electricity Authority (CEA) (2013). Monthly Executive Report, March 2013.http://www.cea.nic.in/reports/monthly/e xecutive_rep/mar13/mar13.pdf
15. PHD Chamber of Commerce and Industry (2011). Comparative Study on Power Situation in the Northern and Central States of
16. PHD Chamber of Commerce and Industry (2011). Comparative Study on Power Situation in the Northern and Central States of
India. http://www.phdcci.in/admin/admin_log ged/banner_images/1334554564.pdf.
17. One World South Asia (2013): Greenpeace for revision of renewable energy policy in India.http://southasia.oneworld.net/news/gre enpeace-calls-for-revision-of-renewable-energy-policy.
18. The Times of India (Feb 2013). Next big move
in UP, energy from the
sun:http://articles.timesofindia.indiatimes.co m/2013-02-13/lucknow/37078773_1_solar- energy-renewable-purchase-obligation-solar-power
19. http://www.eia.gov/electricity/monthly/ 20. http://www.environmentamerica.org/news/a
me/report-10-percent-solar-us-reach
21. http://breakingenergy.com/2014/08/11/solar- duties-on-china-and-taiwan-put-squeeze-on-big-u-s-projects/
22. http://newscenter.lbl.gov/2014/09/17/new- studies-find-significant-declines-in-price-of-rooftop-and-utility-scale-solar/
23. http://www.mercurynews.com/science/ci_2639 8651/huge-solar-farm-proposed-near-silicon-valley-wins
24. The Times of India (Feb 2013). Next big move
in UP, energy from the
sun:http://articles.timesofindia.indiatimes.co m/2013-02-13/lucknow/37078773_1_solar- energy-renewable-purchase-obligation-solar-power
25. UdhyogBandhu (2012). Renewable Energy in Uttar
Pradesh:http://udyogbandhu.wordpress.com/ 2012/04/17/renewable-energy-in-uttar-pradesh/
26. The Times of India (Feb 2013). Next big move
in UP, energy from the
sun:http://articles.timesofindia.indiatimes.co m/2013-02-13/lucknow/37078773_1_solar- energy-renewable-purchase-obligation-solar-power