LBNL-5933E
An Evaluation of Solar Valuation
Methods Used in Utility Planning and
Procurement Processes
Andrew Mills and Ryan Wiser
Environmental Energy
Technologies Division
December 2012
The work described in this report was funded by the U.S. Department of Energy (Office of Energy Efficiency and Renewable Energy and Office of Electricity Delivery and Energy Reliability) under Lawrence Berkeley National Laboratory Contract No. DE-AC02-05CH1123
E
RNEST
O
RLANDO
L
AWRENCE
Disclaimer
This document was prepared as an account of work sponsored by the United States Government. While this document is believed to contain correct information, neither the United States Government nor any agency thereof, nor The Regents of the University of California, nor any of their employees, makes any warranty, express or implied, or assumes any legal responsibility for the accuracy, completeness, or usefulness of any information, apparatus, product, or process disclosed, or represents that its use would not infringe privately owned rights. Reference herein to any specific commercial product, process, or service by its trade name, trademark, manufacturer, or otherwise, does not necessarily constitute or imply its endorsement, recommendation, or favoring by the United States Government or any agency thereof, or The Regents of the University of California. The views and opinions of authors expressed herein do not necessarily state or reflect those of the United States Government or any agency thereof, or The Regents of the University of California.
Ernest Orlando Lawrence Berkeley National Laboratory is an equal opportunity employer.
LBNL-5933E
An Evaluation of Solar Valuation Methods Used in Utility Planning
and Procurement Processes
Prepared for the
Office of Energy Efficiency and Renewable Energy Solar Energy Technologies Program
U.S. Department of Energy Washington, D.C.
and the
Office of Electricity Delivery and Energy Reliability National Electricity Division
U.S. Department of Energy Washington, D.C.
Principal Authors
Andrew Mills and Ryan Wiser
Ernest Orlando Lawrence Berkeley National Laboratory 1 Cyclotron Road, MS 90R4000
Berkeley CA 94720-8136
December 2012
The work described in this report was funded by the Office of Energy Efficiency and Renewable Energy (Solar Energy Technologies Program) and by the Office of Electricity Delivery and Energy Reliability (National Electricity Division) of the U.S. Department of Energy under Lawrence Berkeley National Laboratory Contract No. DE-AC02-05CH11231.
Acknowledgements
The work described in this report was funded by the Office of Energy Efficiency and Renewable Energy (Solar Energy Technologies Program) and by the Office of Electricity Delivery and Energy Reliability (National Electricity Division) of the U.S. Department of Energy under Lawrence Berkeley National Laboratory Contract No. DE-AC02-05CH11231. For reviewing drafts of this report and/or for providing comments the authors would like to thank Galen Barbose (Berkeley Lab), Mark Bolinger (Berkeley Lab), Karlynn Cory (National Renewable Energy Laboratory), Adam Green (Solar Reserve), Udi Helman (BrightSource Energy), Brendan Kirby (consultant to NREL), Colin Loxley (Public Service Electric and Gas), Eran Maher (Solar Electric Power Association), Mark O’Malley (University College Dublin), Kevin Porter (Exeter Associates), Jason Schmidt (Ventyx), Paul Smith (Arizona Public Service), Peter Larsen
(Berkeley Lab), Rebecca Lim (Colorado Public Utilities Commission), Charlie Smith (Utility Variable Generation Integration Group), Mike Taylor (SEPA), Jordan Wilkerson (Lawrence Berkeley National Laboratory), Frank Wilkins (CSP Alliance), and Valerie V. vonSchramm (CPS Energy), and Pei Zhai (Berkeley Lab). We also appreciate the detailed technical editing of draft versions of this report from Jarett Zuboy. Of course, the authors are solely responsible for any remaining omissions or errors.
Abstract
As renewable technologies mature, recognizing and evaluating their economic value will become increasingly important for justifying their expanded use. This report reviews a recent sample of U.S. load-serving entity (LSE) planning studies and procurement processes to identify how current practices reflect the drivers of solar’s economic value. In particular, we analyze the LSEs’ treatment of the capacity value, energy value, and integration costs of solar energy; the LSEs’ treatment of other factors including the risk reduction value of solar, impacts to the transmission and distribution system, and options that might mitigate solar variability and uncertainty; the methods LSEs use to design candidate portfolios of resources for evaluation within the studies; and the approaches LSEs use to evaluate the economic attractiveness of bids during procurement.
We found that many LSEs have a framework to capture and evaluate solar’s value, but approaches varied widely: only a few studies appeared to complement the framework with detailed analysis of key factors such as capacity credits, integration costs, and tradeoffs between distributed and utility-scale photovoltaics. Full evaluation of the costs and benefits of solar requires that a variety of solar options are included in a diverse set of candidate portfolios. The design of candidate portfolios evaluated in the studies, particularly regarding the methods used to rank potential resource options, can be improved. We found that studies account for the capacity value of solar, though capacity credit estimates with increasing penetration can be improved. Furthermore, while most LSEs have the right approach and tools to evaluate the energy value of solar, improvements remain possible, particularly in estimating solar integration costs used to adjust energy value. Transmission and distribution benefits, or costs, related to solar are rarely included in studies. Similarly, few LSE planning studies can reflect the full range of potential benefits from adding thermal storage and/or natural gas augmentation to concentrating solar power plants. Finally, the level of detail provided in requests for proposals used in procurement is not always sufficient for bidders to identify the most valuable technology or configurations to the LSE.
Table of Contents
Acknowledgements ... iv
Abstract ... v
Table of Contents ... vi
List of Figures and Tables... vii
Acronyms and Abbreviations ... viii
Executive Summary ... ix
1. Introduction ... 1
2. LSE planning and procurement documents reviewed in this report ... 4
3. Summary of steps used by LSEs in planning studies and procurement processes ... 5
3.1 Step 1: Assessment of future needs and resources ... 6
3.2 Step 2: Creation of candidate portfolios that satisfy these needs and constraints ... 8
3.3 Step 3: Evaluation of candidate portfolio cost and impacts ... 9
3.4 Step 4: Selection of preferred portfolio ... 11
3.5 Step 5: Resource procurement ... 12
3.6 Bringing it all together: A simple illustration of a resource planning study with PV ... 12
4. Analysis of LSE treatment of solar in planning and procurement ... 17
4.1 Solar technologies considered in planning and procurement ... 17
4.2 Recognition of solar capacity value in planning studies ... 18
4.3 Estimates of solar capacity credit in planning studies and broader literature ... 19
4.4 Evaluation of the energy value of solar using production cost models ... 25
4.5 Adjusting the energy value to account for integration costs ... 29
4.6 Additional factors included or excluded from planning studies... 31
4.7 Designing candidate portfolios for planning studies ... 33
4.8 Economic evaluation of bids in procurement processes ... 42
5. Conclusions and Recommendations ... 45
References ... 49
List of planning and procurement documents reviewed ... 56
Appendix A. Summary of LSE planning and procurement practices ... 60
List of Figures and Tables
Figure 1. General steps followed by LSEs in planning and procurement ... 6
Figure 2. Example of expected future peak loads and existing resources (adapted from PSCo) ... 6
Figure 3. Example of the creation of a feasible candidate portfolio (adapted from PSCo) ... 8
Figure 4. Example evaluation of the sensitivity of revenue requirement to different assumptions about the future for various portfolios (adapted from APS) ... 10
Figure 5. Portfolio composition and hypothetical dispatch ... 13
Figure 6. Capacity credits applied by LSEs in planning studies... 21
Figure 7. Estimated capacity credits at low penetration from studies that use LOLP-based methods ... 22
Figure 8. PV capacity credit estimates with increasing penetration levels (dashed line is average capacity credit, solid line is incremental capacity credit) ... 24
Figure 9. Capacity value and energy value formulas used by LADWP to rank resources ... 37
Figure 10. Example of ranking by levelized cost with capacity adder (adapted from PGE) ... 38
Table 1. Planning studies and procurement practices reviewed in this analysis ... 5
Table 2. Illustration of evaluation and comparison of three hypothetical portfolios ... 14
Table 3. Solar technologies included in assessment of potential future resources ... 17
Table 4. Capacity credits applied by LSEs in planning studies ... 20
Table 5. Temporal resolution of production cost models used in LSE planning studies... 26
Table 6. Assumed integration costs used by LSEs to adjust production costs for portfolios with solar ... 30
Acronyms and Abbreviations
APS Arizona Public Service
AS Ancillary service
CA IOU California Investor-Owned Utility CAISO California Independent System Operator CCGT Combined cycle gas turbine
CPUC California Public Utilities Commission CSP Concentrating solar power
CT Combustion turbine
DG Distributed generation
ELCC Effective load-carrying capability IID Imperial Irrigation District
IRP Integrated resource plan
LADWP Los Angeles Department of Water and Power LCBF Least-cost, best-fit
LOLP Loss of load probability
LSE Load-serving entity
LTPP Long-Term Procurement Plan NGST Natural gas steam turbine
NPCC Northwest Power and Conservation Council NQC Net qualifying capacity
NREL National Renewable Energy Laboratory O&M Operations and maintenance
PG&E Pacific Gas and Electric PGE Portland General Electric PNM Public Service of New Mexico
PPA Power purchase agreement
PSCo Public Service of Colorado
PV Photovoltaics
PVRR Present value of the revenue requirement
RA Resource adequacy
REC Renewable energy certificate
RETI Renewable Energy Transmission Initiative RFP Request for proposals
RPS Renewables portfolio standard
SCPPA Southern California Public Power Authority SEPA Solar Electric Power Association
T&D Transmission and distribution
TEP Tucson Electric Power
TWh Terawatt-hour
WECC Western Electricity Coordinating Council WREZ Western Renewable Energy Zone Initiative
Executive Summary
Introduction
Recent declines in the cost of photovoltaic (PV) energy, increasing experience with the
deployment of concentrating solar power (CSP), the availability of tax-based incentives for solar, and state renewables portfolio standards (RPS) (some with solar-specific requirements) have led to increased interest in solar power among U.S. load-serving entities (LSEs). This interest is reflected within LSE planning and procurement processes and in a growing body of literature on the economic value of solar energy within utility portfolios. This report identifies how current LSE planning and procurement practices reflect the drivers of solar’s economic value identified in the broader literature. This comparison can help LSEs, regulators, and policy makers identify ways to improve LSE planning and procurement.
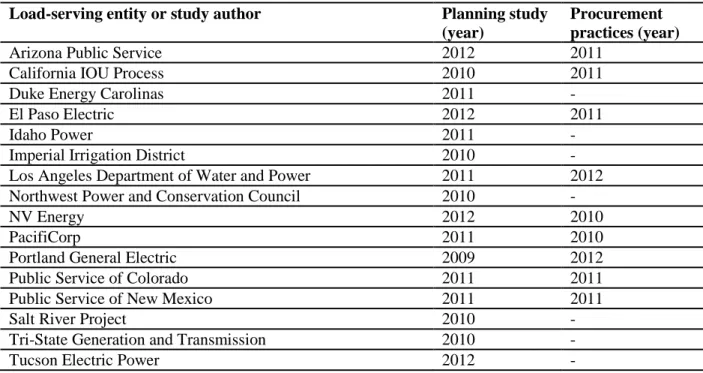
The report reviews 16 planning studies and nine documents describing procurement processes created during 2008–2012 by LSEs interested in solar power (Table ES1). We first summarize the typical approach used by LSEs in planning studies and procurement processes. We then analyze the LSEs’ treatment of the capacity value, energy value, and integration costs of solar energy; the LSEs’ treatment of other factors including the risk reduction value of solar, impacts to the transmission and distribution system, and options that might mitigate solar variability and uncertainty; the methods LSEs use to design candidate portfolios of resources for evaluation within the studies; and the approaches LSEs use to evaluate the economic attractiveness of bids during procurement. We offer several recommendations that could help LSEs improve planning studies and procurement processes.
Table ES1. Planning studies and procurement practices reviewed in this analysis
Load-serving entity or study author Planning study
(year)
Procurement practices (year)
Arizona Public Service 2012 2011
California IOU Process 2010 2011
Duke Energy Carolinas 2011 -
El Paso Electric 2012 2011
Idaho Power 2011
-Imperial Irrigation District 2010
-Los Angeles Department of Water and Power 2011 2012
Northwest Power and Conservation Council 2010
-NV Energy 2012 2010
PacifiCorp 2011 2010
Portland General Electric 2009 2012
Public Service of Colorado 2011 2011
Public Service of New Mexico 2011 2011
Salt River Project 2010 -
Tri-State Generation and Transmission 2010
-Summary of steps used by LSEs in planning studies and procurement processes
Many of the LSEs followed a similar set of steps that began with an assessment of demand forecasts, generation options, fuel price forecasts, and regulatory requirements over a planning horizon. Based on this assessment, LSEs created candidate resource portfolios that satisfy these needs and regulatory requirements. These candidate portfolios were typically created using one of three methods:
• Manual creation based on engineering judgment or stakeholder requests
• Creation using capacity-expansion models based on deterministic future assumptions • Creation using an intermediate approach in which resource options are ranked according
to metrics defined by each LSE
The present value of the revenue requirement (PVRR) of candidate portfolios was then evaluated in detail. The PVRR of each portfolio was based primarily on the capital cost of each portfolio and the variable cost of dispatching each portfolio to maintain a balance between supply and demand over the planning period. The variable cost was commonly evaluated by simulating the dispatch of the portfolio using a production cost model. Many LSEs used scenario analysis or Monte-Carlo analysis (or some combination of both) to evaluate the exposure of each portfolio to changes in uncertain factors such as fossil-fuel prices, demand, or carbon dioxide prices. LSEs then chose a preferred portfolio based on the relative performance of the candidate portfolios. The preferred portfolio was often determined by balancing a desire for both low costs and low risks. During procurement, LSEs often solicited bids for resources that matched the
characteristics of resources identified in the preferred portfolio.
Solar technologies considered in planning and procurement
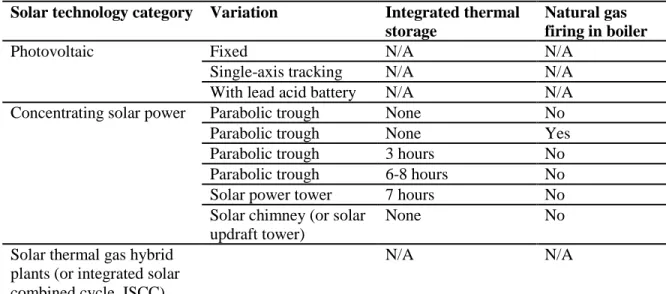
Among our sample, many LSEs considered PV and CSP with or without thermal storage or natural gas augmentation.1 The PV technologies considered by LSEs were not always described in detail. When they were described, LSEs typically considered fixed PV or single-axis tracking PV; some also distinguished between distributed and utility-scale PV. One LSE considered a PV plant coupled with a lead-acid battery. The CSP technology was usually based on a parabolic trough or a solar power tower configuration. One LSE considered a solar chimney, and another LSE considered a solar thermal gas hybrid (a natural gas power plant with solar concentrators that preheat water used in the plant’s steam cycle).
Recognition of solar capacity value in planning studies
In regions where solar generation is well correlated with periods of high demand, one of the main contributors to solar’s economic value is the capacity value. The capacity value of solar
1
Natural gas augmentation is a modification to CSP plants in which the boiler used in the steam cycle can burn natural gas. This allows the CSP plant to operate when insolation is low. The low efficiency of using natural gas in a steam boiler compared with a combined cycle natural gas plant typically means that natural gas augmentation is only used during times when insolation is low and more efficient power plants are already fully deployed.
reflects the avoided costs from reducing the need to build other capacity resources, often combustion turbines (CTs), to meet peak demand reliably. LSEs usually added sufficient capacity to meet the peak load plus a planning reserve margin in each candidate portfolio. Portfolios that included solar need not include as much capacity from other resources, so solar offset some of the capital cost that would otherwise be included in the portfolio’s PVRR. Thus, solar’s capacity value was based in part on the capital cost of the avoided capacity resources and the timing of the need for new capacity.
The capacity value of solar was affected by the study methodology. In at least one case, the LSE assumed that the generating resources used for capacity were very “lumpy” (i.e., only available in blocks of 290 MW or greater). As a result, adding a small amount of solar to a portfolio could not change the timing or amount of other capacity resources required; thus, the same amount of CT capacity was needed with or without the inclusion of solar, even though the LSE recognized that some of the solar nameplate capacity could contribute to meeting peak loads. Including capacity resources that are available in smaller size increments—e.g., 50-MW CTs, which were modeled by other LSEs—or modeling the value of selling excess capacity to neighboring LSEs better recognizes solar’s capacity value.
Estimates of solar capacity credit in planning studies and broader literature
The primary driver of solar’s capacity value is the capacity credit: the percentage of the solar nameplate capacity that can be counted toward meeting the peak load and planning reserve margin. The capacity credit assigned to solar technologies by the LSE determines how much capacity from an alternative resource can be avoided by including solar in a portfolio. For example, a capacity credit of 50% for PV indicates that a 100-MW PV plant can contribute roughly the same toward meeting peak load and the planning reserve margin as a 50-MW CT. Analysis in the literature shows that the capacity credit of solar largely depends on the
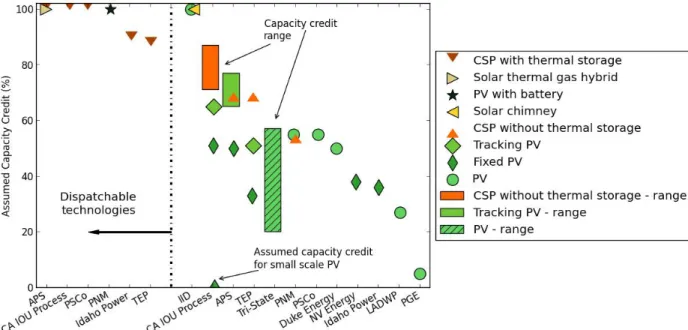
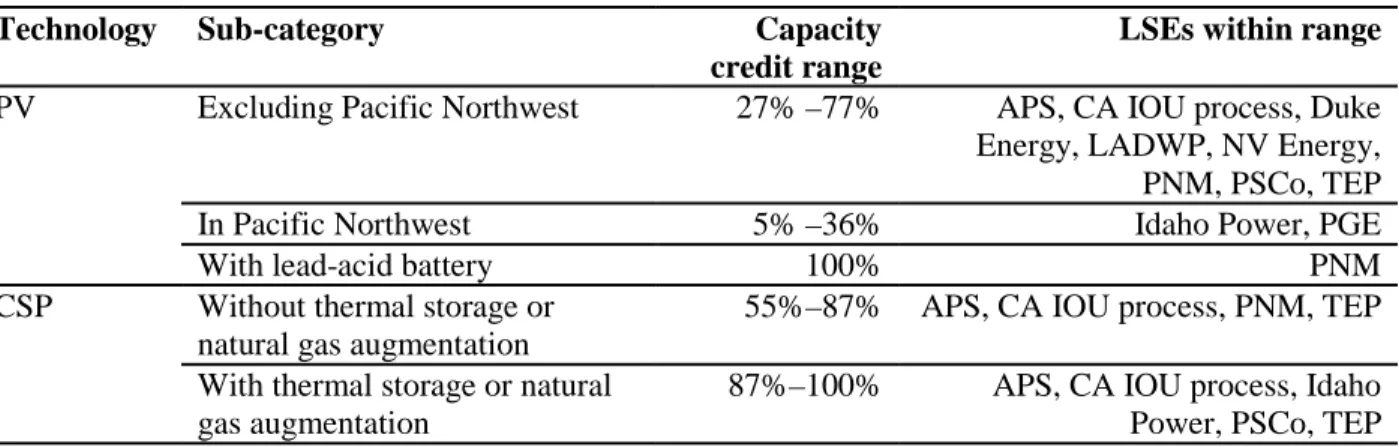
correlation of solar production with LSE demand, meaning the capacity credit varies by solar technology (e.g., PV vs. CSP with thermal storage), configuration (e.g., single-axis tracking PV vs. fixed PV), and LSE (e.g., summer afternoon peaking vs. winter night peaking). As expected, the capacity credit assigned by LSEs to solar in planning studies varied by technology,
configuration, and LSE (Figure ES1). However, few studies appeared to use detailed loss of load probability (LOLP) studies to determine the capacity credit of solar. Instead, most LSEs relied on analysis of the solar production during peak-load periods or assumptions based on rules of
thumb. The reliance on assumptions or simple approximation methods to assign a capacity credit to solar may also contribute to much of the variation in capacity credit across studies.
Only one LSE, Arizona Public Service, appeared to account for changes in the capacity credit of solar with increasing penetration. Analysis in the broader literature finds that solar capacity credit decreases with increasing solar penetration, particularly for PV and CSP without thermal storage or natural gas augmentation (Figure ES2). One of the main factors in the literature that distinguishes the economic value of CSP with thermal storage from the economic value of PV and CSP without thermal storage or natural gas augmentation is the ability of CSP with thermal storage to maintain a high capacity credit with increasing penetration. If LSE planning studies do not reflect this difference in capacity credit with increasing penetration, then the difference in economic value among different solar technologies will not be reflected in their planning studies.
Note: Imperial Irrigation District (IID) appears to assume a 100% capacity credit for PV and a solar chimney. Capacity credit for APS represent capacity credit applied at low penetration level; capacity credit is reduced with higher PV penetration. Range of capacity credits for APS and CA IOU process are based on different plant locations.
Figure ES1. Capacity credits applied by LSEs in planning studies
See main text for additional notes
Figure ES2. PV capacity credit estimates with increasing penetration levels (dashed line is average capacity credit, solid line is incremental capacity credit)
Given the importance of solar’s capacity credit for determining economic value and ensuring reliability, LSEs should consider conducting detailed estimates of solar capacity credit. LSEs
considering portfolios with large amounts of solar may also need to account for expected changes in the solar capacity credit with increasing penetration.
Evaluation of the energy value of solar using production cost models
In addition to capacity value, another primary driver of solar’s economic value is the energy value. The energy value reflects the reduction in the PVRR from avoiding variable fuel and operational costs from conventional power plants in portfolios with solar. When LSEs evaluate candidate portfolios, they often use production cost models that account for the temporal variation in solar generation, demand, and other resource profiles. Many of the production cost models used by LSEs in planning studies have hourly temporal resolution (either over a one-week period each month or over the full year), and some production cost models account for the various operational constraints of conventional generation. These models appear to account for any benefit from solar generation being correlated with times when plants with high variable costs would otherwise be needed.
The LSEs in our sample that included CSP with thermal storage in candidate portfolios did not describe the approach they used to account for the dispatchability of CSP with thermal storage in the production cost models. In previous analyses, CSP with thermal storage was assumed to operate with a fixed generation profile in which the thermal storage generates as much power as possible in specific, static periods. While this simplified approach may capture some of the benefits of thermal storage, the full benefits to a particular LSE can be better captured by
modeling the dispatchability of CSP directly in the production cost model. Compared to thermal storage, natural gas augmentation is relatively easier to model in a production cost model. One LSE described its approach to incorporating natural gas augmentation into its model.
The production cost models used by most LSEs also can account for changes in the energy value as the penetration of solar increases. One key factor in this regard is how LSEs consider the broader wholesale market and the assumptions they make about solar penetration in neighboring markets. If the LSE assumes other regions do not add solar, then selling power to the broader market during times of high insolation and low load may mitigate reductions in the energy value as the penetration of solar increases in the candidate portfolio. Such opportunities may not be available to the same degree, however, if many LSEs in a region simultaneously add solar. LSEs can improve their planning studies by better describing the assumptions and approaches used to account for broader wholesale markets when using production cost models to evaluate candidate portfolios.
Adjusting the energy value to account for integration costs
Many LSEs adjust production cost model assumptions or results to account for solar integration costs. Adjustments make sense when there are factors that cannot be represented in the
production cost model owing to data or computational limitations. In that case, the adjustments could be tailored to account for the shortcomings of a specific LSE’s modeling approach or production cost model. Two studies accounted for solar integration costs by increasing the operating reserve requirement in the hourly production cost model to account for sub-hourly variability and uncertainty that otherwise would be ignored. The increase in operating reserves
was based on a separate detailed analysis of sub-hourly variability and uncertainty of solar, wind, and load. Alternatively, other LSEs directly added an estimated integration cost to the production cost model results depending on the amount of solar included in the candidate portfolio. The integration costs for solar added to the production cost model results ranged from $2.5/MWh to $10/MWh. Of the LSEs that used this approach, only one conducted a detailed study of solar integration costs (based on day-ahead forecast errors). The remaining LSEs relied on
assumptions, results from studies in other regions, or integration cost estimates for wind. Based on the scarcity of detailed analysis of solar integration costs and the wide range of integration cost estimates used in the planning studies, more LSEs should consider carefully analyzing solar integration costs for their system (estimating what is not already captured by their modeling approach) to better justify their assumptions.
Additional factors included or excluded from planning studies
Aside from the capacity and energy values, other attributes of solar are often also included in planning studies. The potential risk-reduction benefit of solar, for example, can be accounted for in studies that evaluate the performance of candidate portfolios with and without solar under different assumptions about the future. Transmission and distribution benefits, or costs, related to solar are not often accounted for in LSE studies. In one clear exception, avoided distribution costs were directly accounted for by one LSE in portfolios with distributed PV. In a few other cases, candidate portfolios with solar required less transmission than candidate portfolios with other generation options. The difference in avoided costs between utility-scale solar and distributed PV are not well known, but as more studies provide insight into these differences, LSEs should consider incorporating that information into their planning studies.
A number of LSE planning studies included options that may increase the economic value of solar. Some LSEs included thermal storage or natural gas augmentation with CSP plants, one study considered PV coupled with a lead-acid battery, and another added grid-scale batteries to candidate portfolios with wind and solar (in both cases the additional capital cost of the batteries was too high to reduce the overall PVRR relative to the cases without batteries). Other studies considered a wide range of grid-level storage options without explicitly tying these storage resources to the candidate portfolios with wind or solar. None of the studies appeared to directly consider the role of demand response in increasing the value of solar or directly identify
synergies in the capacity credit or integration costs for combinations of wind and solar. Any such synergy in energy value, on the other hand, may have been indirectly accounted for in production cost modeling of candidate portfolios with combinations of wind and solar.
Designing candidate portfolios to use in planning studies
While the overall framework used by many of the LSEs for evaluating candidate portfolios appears to capture many (but not all) solar benefits, one important area for improvement is creating candidate portfolios in the first place. The complex interactions between various
resource options and existing generation make it difficult to identify which resource options will be most economically attractive. To manage this complexity, a number of LSEs relied on
capacity-expansion models to design candidate portfolios, most of which were based on deterministic assumptions about future costs and needs. The LSEs that did not use
capacity-expansion models either manually created candidate portfolios based on engineering judgment or stakeholder input or created candidate portfolios by ranking resource options using simplified criteria.
A logical way to rank resources is to estimate the change in the PVRR of a portfolio from including a particular resource in the portfolio and displacing other resources. This change in PVRR is called the “net cost” of a resource since it represents the difference between the cost of adding the resource and the avoided cost from displacing other resources that are no longer needed to ensure the portfolio can meet reliability and regulatory constraints. Since the goal of many planning studies is to minimize the expected PVRR, the resources with the lowest net cost should be added to the portfolio. LSEs in California used a similar approach to identify
renewable resource options that were included in their candidate portfolios.
In contrast, a number of LSEs used the levelized cost of energy of resource options along with various adjustments (often based on capacity and integration cost adjustments) to rank resource options. The adjustments, particularly the capacity adjustments, were often not clearly justified and did not always link back to the broader objective of minimizing the expected PVRR. Based on these findings, we recommend that, where possible, LSEs use capacity-expansion models to build candidate portfolios. Improvements in capacity expansion models to account for factors like risk, uncertainty, dispatchability of CSP plants with thermal storage, and operational constraints for conventional generation may be appropriate for some LSEs. If using a capacity-expansion model to build candidate portfolios is not possible, then an approach like the net cost ranking should be considered instead.
Economic evaluation of bids in procurement processes
Finally, we found that LSE procurement often evaluated the economic attractiveness of bids based on the estimated net cost, but often it was unclear exactly how this net cost was evaluated. The lack of clarity in many procurement documents makes it difficult for a bidder to estimate how various choices it makes in terms of solar technology or configuration will impact the net cost of its bid. The bidder will know how these choices affect the cost side of the bid but often must guess or try to replicate the LSE’s planning process to determine how different choices will affect the LSE’s avoided costs. LSEs likely could elicit more economically attractive bids by providing as much detail as possible on how the net cost of each bid will be evaluated and the differences in the LSE’s avoided costs for different technologies and configurations.
Although this review focused on the valuation of solar in planning and procurement, many of the LSEs are considering other renewable technologies, particularly wind. The lessons learned from this analysis and many of the recommendations apply to the evaluation of other renewable energy options beyond solar.
1. Introduction
With increased worldwide deployment of solar energy technologies, the cost of generating power from photovoltaics (PV) and concentrating solar power (CSP) has decreased and is expected to decrease further (Barbose et al. 2012, Arvizu et al. 2011, EASAC 2011, Chu and Majumdar 2012). As the cost of solar generation falls, load-serving entities (LSEs), regulators, and policy makers increasingly consider solar generation as one of the many viable options for supplying electricity. For an LSE, solar power provides energy and can satisfy some peak electricity demand in place of conventional generation resources (Hoff 1988, Perez et al. 2008, Pelland and Abboud 2008, Madaeni et al. 2012a, Olson and Jones 2012, Mills and Wiser 2012), helps meet state renewables portfolio standard (RPS) targets (Wiser and Barbose 2008; Wiser et al. 2011), reduces exposure to uncertain fossil fuel and carbon dioxide prices (Bokenkamp et al. 2005, Bolinger and Wiser 2009, Denholm et al. 2009, Perez et al. 2011), and provides ancillary
services in the case of CSP with thermal storage and/or natural gas augmentation (EASAC 2011, Madaeni et al. 2012b).
Generally, the primary resource-procurement considerations of an LSE include its needs for capacity and energy, regulatory requirements (state and federal), the relative impact of resources on the LSE’s revenue requirement, and the impact of the resource options on the LSE’s exposure to future cost uncertainty. Regarding the impact on the revenue requirement, the cost of
contracting or building a new plant is in part offset by the costs that the new resource allows the LSE to avoid. These avoided costs are sometimes called the “economic value” of a new
generation resource.
Detailed estimates of the economic value of solar in previous analyses show that solar can have high economic value at low penetration levels where there is high coincidence of solar
generation and periods of high demand (Borenstein 2008, Lamont 2008, R.W. Beck 2009, Sioshansi and Denholm 2010). At least at low penetration, the economic impact of imperfect forecastability and the need for increased ancillary services with solar appear to be secondary to the higher capacity and energy value (EnerNex 2009, Mills and Wiser 2010, Navigant
Consulting et al. 2011, Mills and Wiser 2012). In addition, various studies highlight synergistic effects between combinations of renewable generating technologies such as solar and wind (Denholm and Hand 2011, Nagl et al. 2011, Fripp 2012), PV and CSP with thermal storage (Denholm and Mehos 2011), and PV with storage or demand response (Denholm and Margolis 2007).
Detailed studies also show that the economic value of PV and CSP without thermal storage (or natural gas augmentation) decreases with increasing penetration (Olson and Jones 2012, Mills and Wiser 2012). Increased solar penetration reduces the net load during the day, so eventually the period of peak load net of solar generation shifts into the early evening, even where there is high coincidence of load and insolation. Further, on days with relatively lower load, solar will start to displace generation resources with lower variable costs, such as coal (Denholm et al. 2009, Olson and Jones 2012, Mills and Wiser 2012). At low penetration, the addition of 2–4 hours of thermal storage to CSP appears more valuable than CSP without thermal storage
(Madaeni et al. 2012b),2 although in a separate analysis, CSP plants with 6 hours of thermal storage do not appear to have a significantly greater value (in $/MWh terms) than other solar technologies (Mills and Wiser 2012). On the other hand, the benefit of thermal storage is clear at high penetrations (above about 10% penetration on an annual energy basis) because it helps avoid the otherwise significant decline in value of solar with increasing solar penetration (Mills and Wiser 2012).
This report investigates whether the understanding of solar’s economic value from the research literature is reflected in the treatment of solar options in LSE planning studies and procurement processes.3 We compare methods used by different LSEs, primarily located in the Western and Southern United States. Where possible, we also highlight potential improvements that LSEs (or regulators that oversee them) could make to current planning and procurement methodologies to better reflect the economic value of solar.4 In particular, we focus on the methods for
representing the capacity value,5 energy value, costs associated with day-ahead forecast errors and ancillary services, and various other factors including transmission and distribution system impacts, measures that might mitigate solar variability and uncertainty and portfolio risk reduction. Although these attributes are not necessarily uniquely identified for solar in LSE planning studies, organizing the discussion around these attributes helps illuminate the many drivers that ultimately affect the attractiveness of resource portfolios that include solar. We also look for indications that LSEs are considering attributes that might increase the value of solar, such as PV tracking, CSP with thermal storage and natural gas augmentation, or synergistic interactions between multiple technologies like PV and CSP or solar and wind. In addition, we review LSE procurement processes to determine how publicly available documents communicate what configurations and technologies are most economically attractive to LSEs and how the processes allow solar developers and equipment manufacturers to communicate to the LSE their technologies’ capabilities (e.g., PV tracking, natural gas firing in CSP plant boilers, and
integrated storage). This review evaluates the impression that LSE planning and procurement
2 Madaeni et al. (2012b) only present changes in the value of CSP with thermal storage and the solar multiplier in
$/kW terms, not $/MWh terms. Based on simple calculations using their figures it appears that adding 4 hours of thermal storage and increasing the solar multiple from 1.5 to 2.0 increases the value of CSP by about $10/MWh in Nevada and by about $20/MWh in Death Valley (about half of that increase in the value with thermal storage comes from the sale of ancillary services based on the CAISO ancillary service prices between 2001 and 2005).
3
Austin Energy is beginning to offer a solar tariff to PV customers that compensates PV generation at a rate set to the current year’s estimated value of solar to the LSE (Rábago et al. 2012). We do not include this tariff in our analysis because it focuses primarily on designing a fair compensation scheme rather than planning a portfolio of resources. Many concepts used in the design of the Austin Energy tariff are similar to the concepts reviewed in this report.
4 Of course, solar is but one of many considerations in LSE planning studies; the desire for better representation of
solar should be balanced with practical constraints due to limitations in available tools, methods, and time.
5 “Capacity value” here refers to the economic value related to the savings associated with solar displacing the need
to procure other sources of capacity (with units of $/MWh). “Load-carrying capability” represents the amount of additional load that can be reliably met when solar is added to a portfolio (with units of MW). “Capacity credit” refers to the LSE’s assumed/estimated load-carrying capability of solar per unit of solar nameplate capacity (represented as a % of nameplate capacity). We maintain these definitions consistently through this document but note that many LSEs and researchers use these terms differently. Most notably, the term we refer to here as “capacity credit” is synonymous with what others sometimes call “capacity value.” When we use “capacity value” we mean the economic savings from avoiding other capacity resources, similar to how we use “energy value” to describe the economic savings from reducing production costs.
practices focus too much on levelized cost comparisons that ignore considerations of the economic value of solar (e.g., Joskow 20116). Although this report focuses on solar, a sizeable number of its insights apply to the evaluation of other renewable energy options, such as wind.
This report builds on previous analysis of the treatment of renewable energy (Wiser and Bolinger 2006) and carbon regulatory risk (Barbose et al. 2008) in utility resource plans in the western United States, and a survey of the treatment of solar in utility procurement processes (SEPA 2009, Text Box 1). Research into incorporating renewables, other non-conventional
technologies, and uncertainty into utility planning has a long history and remains active. Hirst and Goldman (1991), for example, review best practices for integrated resource planning and distinguish it from traditional utility planning. Doherty et al. (2006) examine the impact of wind in generation portfolios, with particular attention to the benefit of increasing the diversity of generation resources, using mean-value portfolio theory, one of the approaches to understanding optimal generation portfolios reviewed in Bazilian and Roques (2008). Jin et al. (2011) and Vithayasrichareon and MacGill (2012) propose refined methods to solve large-scale generation-expansion problems while accounting for uncertainty. For improving capacity-generation-expansion modeling, Shortt et al. (2012) compare the production costs estimated using a simple dispatch-only model with those using a detailed unit-commitment and economic dispatch model with increasing wind penetration in Texas, Ireland, and Finland. They find that the difference in production costs increases with wind penetration due to conventional generation flexibility issues that are only captured in the unit-commitment model.
Note that this study focuses on the planning and procurement methodologies used by LSEs. Except for assumptions unique to solar, we do not focus on the particular assumptions made by LSEs, such as fossil fuel price forecasts, carbon cost estimates, or capital cost estimates for conventional plants. However, such assumptions do impact the value of solar and are likely to have just as much impact on LSE planning decisions as the methodological approach. This review also does not focus on the methods used by LSEs to estimate the costs of building or procuring new solar plants. Other studies illuminate current cost trends, drivers, and uncertainties (e.g., IEA 2011, Barbose et al. 2012, EASAC 2011, Goodrich et al. 2012). Although we do not discuss the solar cost assumptions used by LSEs, all LSEs account for the capital costs of the solar technologies considered in their planning studies and procurement processes.
Section 2 of this report describes the LSE planning and procurement documents we reviewed. Section 3 summarizes the steps LSEs use in planning studies and procurement processes. Section 4 analyzes solar’s role in planning and procurement, including discussions of solar capacity values and credits, energy value, integration costs, and other factors as well as the design of candidate portfolios for planning studies and the economic evaluation of bids in procurement processes. Section 5 offers conclusions and recommendations. Following the main text, we provide additional details on the planning and procurement documents we reviewed, LSE
6 Joskow (2011) states, for example, “The most widely used metric for comparing the ‘competitiveness’ of different
generating technologies is the estimated ‘levelized cost’ per megawatt-hour (MWh) supplied.…competitive procurement programs run by utilities to meet renewable electricity purchase mandates often use auction
mechanisms that effectively choose the supply offers with the lowest levelized cost per MWh regardless of when it is supplied.”
planning and procurement practices, and a derivation of net cost based on the objective of minimizing the expected present value of the revenue requirement for a portfolio of resources.
2. LSE planning and procurement documents reviewed in this report
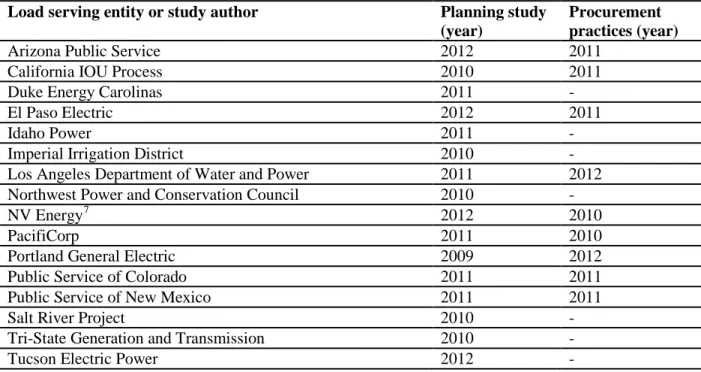
In order to understand the current practices used by LSEs to estimate the economic value of solar, we reviewed a sample of 16 integrated resource plans (IRPs) or similar planning documents and nine documents outlining evaluation procedures for procurement (Table 1). These documents were created between 2008 and 2012 and are primarily from LSEs in the western United States that are considering solar power, among other options. Details of the planning and procurement approaches used by each LSE is further documented in Appendix A.
Text Box 1. SEPA survey of LSE perceptions of the value of solar in procurement
Instead of reviewing publicly available planning and procurement documents, as we do in this report, the Solar Electric Power Association (SEPA 2009) directly surveyed LSEs. In response to survey questions about their assessment of solar attributes in procurement, LSEs attached the following qualitative values to solar:
Highest value:
• No emissions of carbon or pollutants
• Carbon offset value
Moderate value:
• Correlation between solar generation and peak hours of utility
• Dispatchability (CSP with storage)
• Elimination of fuel price uncertainty
• Fuel diversification
Lowest value:
• Potential for location close to load
• Minimal water use
• Delay of transmission or distribution investment
Table 1. Planning studies and procurement practices reviewed in this analysis
Load serving entity or study author Planning study
(year)
Procurement practices (year)
Arizona Public Service 2012 2011
California IOU Process 2010 2011
Duke Energy Carolinas 2011 -
El Paso Electric 2012 2011
Idaho Power 2011
-Imperial Irrigation District 2010
-Los Angeles Department of Water and Power 2011 2012
Northwest Power and Conservation Council 2010
-NV Energy7 2012 2010
PacifiCorp 2011 2010
Portland General Electric 2009 2012
Public Service of Colorado 2011 2011
Public Service of New Mexico 2011 2011
Salt River Project 2010 -
Tri-State Generation and Transmission 2010
-Tucson Electric Power 2012 -
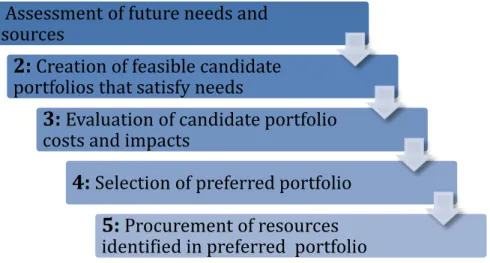
3. Summary of steps used by LSEs in planning studies and procurement processes The general planning process adopted by many LSEs followed a similar pattern: the LSE conducted the planning study, identified a preferred plan from the study, and then issued a request for proposals (RFP) for project developers to provide power from resources identified in the preferred portfolio.8 In this section we briefly describe the structure of the approach used by LSEs in these planning studies and procurement practices. Figure 1 simplifies the varied plans reviewed for this report. Not all LSEs exactly followed these steps: depending on the plan, some steps were not included, multiple steps were bundled into one step, or the order of steps did not follow this same pattern. For details, see the list of planning and procurement documents reviewed at the end of this report.
The most important steps for considering solar are the creation of feasible candidate portfolios (Step 2) and the evaluation of candidate portfolio costs and impacts (Step 3), so our later review emphasizes these steps.9 In the meantime, the following subsections describe each step and then provide a simple illustration of how the costs and benefits of solar can be evaluated in planning studies.
7
We only reviewed the southern Nevada plan for NV Energy in this report.
8 Developers may construct a plant that will then be owned by the LSE, construct a plant whose output will be sold
under long-term contract to the LSE, or contract to sell power to the LSE from an existing facility on a short-term (a few years or less) or long-term (more than 10 years) basis. In some cases the LSE may build the plant itself if the options from project developers are not more attractive.
9 Candidate portfolios are groups of demand-side and supply-side resource options, including solar, that are
Figure 1. General steps followed by LSEs in planning and procurement 3.1 Step 1: Assessment of future needs and resources
In the initial stage of their planning studies, the LSEs evaluated expectations and uncertainties for elements that may impact their operations and options in the future. They considered demand forecasts, cost and availability of demand-side management measures, existing generation and contracts, expectations for generator retirement, regulatory and policy constraints, and new generation options, characteristics, and costs. Often a key result of this step was the identification of the gap between existing and planned generating resources in each year and the forecast of peak demand plus a planning reserve margin (Figure 2). This gap describes a constraint that the combination of resources in each candidate portfolio must be able to meet, but it does not
describe a decision in terms of what resources can be part of candidate portfolios that satisfy this constraint. In other words, not all resources must contribute equally to meeting this constraint as long as the combination of resources meets the constraint.
Figure 2. Example of expected future peak loads and existing resources (adapted from PSCo)
1
: Assessment of future needs andresources
2:
Creation of feasible candidateportfolios that satisfy needs
3:
Evaluation of candidate portfoliocosts and impacts
4:
Selection of preferred portfolio5:
Procurement of resourcesExpected future demand levels impacted the degree to which an LSE may need additional capacity and what time of day and year demand was expected to be highest. Understanding future demand included forecasting load growth, understanding trends in energy efficiency, identifying options available for demand-side management (both in terms of LSE-led energy efficiency programs and demand-response programs), and adhering to regulatory requirements for implementing demand-side measures. The level of detail and sophistication used to assess demand-side resources in the planning studies varied across the LSEs.
The supply side included both existing and new resources. These supply-side resource options determined in part the costs that could be avoided by including solar in a portfolio instead of other supply options. Costs for existing generation included assessments of future operations and maintenance (O&M) costs, the need for major equipment upgrades or replacements, and future fuel and pollution (including potential carbon dioxide) costs. The LSEs also considered the impact of increasingly stringent Environmental Protection Agency regulations on the costs and operation of existing assets.
The assessment of new generation resources considered future fuel costs and environmental regulations. Fuel price forecasts were handled in different ways across studies; frequently NYMEX futures and proprietary fundamental energy market models managed by third parties were used in the planning studies. Additional detail on various fuel price forecasts and the treatment of uncertainty in planning models for LSEs in the western U.S. is provided by Larsen and Wilkerson (2012). In addition, LSEs estimated the capital cost of conventional and
renewable generating options. Some also evaluated the availability and cost of procuring energy from wholesale power markets in future years.
For renewables, LSEs considered RPS requirements and the dependence of RPS requirements on future demand. In some cases RPSs specify a carve-out for solar generation or distributed
generation (DG) that the LSEs also considered in designing feasible candidate portfolios. In Arizona, for example, Arizona Public Service (APS) and Tucson Electric Power (TEP) expected a significant portion of the DG requirement in the state’s RPS to be met with distributed PV. Many included an assessment of future availability and timing of tax-based incentives for renewables and the resulting cost implications. Finally, many LSEs considered the ability to purchase unbundled renewable energy certificates (RECs) in lieu of RECs that are bundled with power that is delivered to the LSE. When there was no RPS requirement, some LSEs considered potential future prices for RECs from their renewable generation that they could sell to other markets.
A number of LSEs included an evaluation of existing and/or new transmission in their
assessment of needs. In some cases, the need for transmission expansion was linked to particular generation options or import limitations that required reliance on broader wholesale markets to meet future needs. In other cases, transmission was driven by factors not linked to specific generation choices. Overall, LSEs did not appear to emphasize how transmission costs would vary across resource choices as much as other factors like resource capital and fuel costs. As noted by Schwartz (2012), availability of existing transmission is often the primary consideration for determining potential resources, rather than the cost of building new transmission, for LSEs in the western United States.
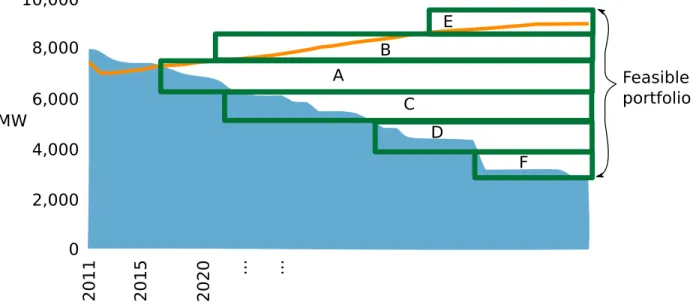
3.2 Step 2: Creation of candidate portfolios that satisfy these needs and constraints The LSEs often needed to reduce a wide range of future options into a set of multiple feasible resource portfolios that could then be analyzed with available tools and methods. Generally, “feasible” meant that the candidate portfolios met all state and federal regulatory requirements. In almost all cases this also meant that the generating resources in each candidate portfolio could meet peak load (plus planning reserve margins) and annual energy demand (Figure 3).10,11 A key element in this step was estimating the load-carrying capability of solar, i.e., the amount of additional load that can be met without decreasing the reliability of the system. LSEs used different approaches to estimating solar load-carrying capability. We refer to the LSE’s estimate of load-carrying capability for each solar technology per unit of nameplate capacity as the “capacity credit” for that technology.
Note: The rectangles labeled A through F represent different resource options that illustrate one feasible portfolio (of many) to meet the peak load and planning reserve needs.
Figure 3. Example of the creation of a feasible candidate portfolio (adapted from PSCo)
We found that three basic methods were used in current LSE planning studies to create feasible candidate portfolios (although some LSEs did not describe the approach they used):
10
Generating resources did not necessarily need to be under long-term contract to the LSE to count toward satisfying its peak demand needs, but studies usually identified the total capacity that needed to be at least under short-term contract.
11 One exception was the Northwest Power and Conservation Council (NPCC), which is primarily concerned with
adequate energy rather than adequate capacity. The Pacific Northwest has significant amounts of energy-limited hydropower that can provide large amounts of power but not for an extended period. The “feasible” portfolios, therefore, are not required to satisfy particular capacity needs; instead, portfolios with too little generation result in large exposure to market purchases that may be uneconomic owing to the assumed high volatility of market prices.
• Manual/engineering judgment
• Commercial capacity-expansion models • Ranking of wide range of resources
With the manual approach, no clear formula or objective was used to create feasible portfolios. Instead, logical arguments based on the trends observed in the assessment of needs and resources (engineering judgment) or stakeholder inputs were used to create feasible portfolios. Often a number of “bookend” portfolios were created to demonstrate the extent to which different portfolios lead to different revenue requirements or different levels of exposure to risk.
Commercial capacity-expansion models used mathematical search algorithms (typically based on linear, mixed-integer, or dynamic programming) to evaluate hundreds or thousands of potential resource combinations under a specific set of assumptions. The models selected the portfolio that minimized the present value of the revenue requirement (PVRR, including capital and dispatch costs). In some cases LSEs created multiple candidate portfolios by varying the assumptions input to the capacity-expansion model and selecting the optimal portfolio for each particular set of assumptions.
A few studies applied a ranking, often based on economic criteria, to the variety of resource options available to the LSE. In one case, non-economic factors (shortest time to bring
renewables online and lowest environmental impact) were used to determine the composition of renewable resources included in candidate portfolios. Only the highest-ranked resources were then chosen for further evaluation in candidate portfolios.
3.3 Step 3: Evaluation of candidate portfolio cost and impacts
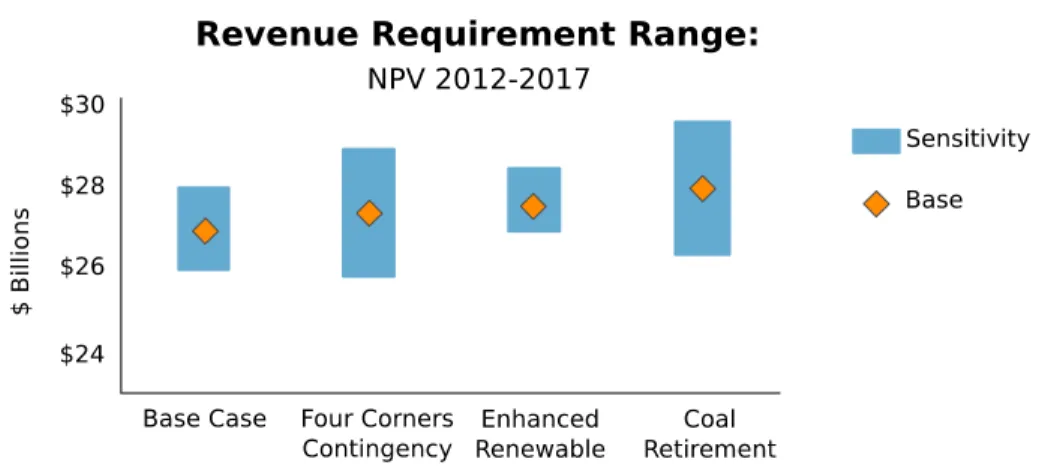
The costs and impacts of candidate portfolios were then quantitatively evaluated. Fixed capital, variable fuel, and O&M costs were estimated to calculate the PVRR of each portfolio. The PVRR is based primarily on the capital cost of each portfolio and the variable cost of dispatching each portfolio to maintain a balance between supply and demand over the planning period. The exposure of the portfolio to changes in costs based on uncertainties about the future was often evaluated to identify the relative risk of each option (Figure 4).
In this step, including solar in a portfolio resulted in changes in the dispatch of other generation resources, along with reductions in overall portfolio exposure to changes in future fuel and carbon prices. The dispatch of the candidate portfolio was typically simulated using a production cost model. The capital and fixed costs were commonly evaluated using a financial analysis model that transformed streams of future expenditures into a present value.
Figure 4. Example evaluation of the sensitivity of revenue requirement to different assumptions about the future for various portfolios (adapted from APS)
Portfolios were evaluated across LSE planning studies in three primary ways:
• Deterministic evaluation: A small number of LSEs simply estimated the PVRR for each candidate portfolio using one set of assumptions regarding future costs and needs. This approach is used in the illustration summarized later (Table 2).
• Deterministic evaluation with specific sensitivity cases: Many LSEs first estimated the PVRR of each portfolio based on a reference set of assumptions about future costs and needs and then examined the sensitivity of the PVRR to changes in those assumptions using specific sensitivity cases. The sensitivity cases not only showed how the PVRR of each portfolio was exposed to changes in assumptions, but also how the relative ranking of portfolios on a PVRR basis would change under different assumptions, including natural gas and carbon dioxide prices, load growth or energy efficiency program effectiveness, and retirement decisions for existing plants (often older coal plants). The uncertainties included in the sensitivity cases were often justified by the analysts’
assessments of future resource options and costs in Step 1. Typically the sensitivity cases changed one variable at a time, with a high and low case for each variable. In other cases multiple variables were changed simultaneously (e.g., high gas price and high carbon dioxide price vs. low gas price and low carbon dioxide price) to examine “best case” or “worst case” scenarios. The high and low variable estimates were often based on values that showed the upper or lower range of what was considered reasonably possible.12
12 A number of LSEs indicated their preference for the use of sensitivity cases using bookend scenarios over more
complex Monte-Carlo simulations. Their reason was the transparency and clarity that single-variable sensitivity cases provided: the analysts could understand the degree to which the PVRR would change under the given sensitivity conditions. For example PGE stated:
While we believe that both stochastic and deterministic scenario analyses provide important insights for assessing the performance and reliability of a portfolio over time, we have found that the most substantial risks in connection with making future resource choices are those associated with large fundamental or structural shifts – the types of risk best described through scenario analysis. As a result, we believe that scenario analysis
• Risk analysis using Monte-Carlo simulation: A number of studies used Monte-Carlo simulation methods that allow many variables to change simultaneously within a
distribution of potential future values. Monte-Carlo analysis required analysts to specify distributions of future values for each variable as well as the correlation between different variables. The PVRR of a portfolio was then estimated for hundreds of random draws from these distributions. As a result, the PVRR of each portfolio would also be a random variable with its own distribution of potential outcomes. Often the LSEs summarized the distribution of the PVRR for each portfolio with the average over all draws (the expected PVRR) and some metric that described the upper tails of the distribution (the risk of the portfolio).13 Variables used in the Monte-Carlo simulation often included natural gas prices, load variations, and carbon dioxide prices. Again, the choice of these variables was often justified by the analysts’ assessments of future resource options and costs in Step 1. In some cases, hydropower availability, generating plant forced outages, and wholesale electricity prices (among other variables) were included in the Monte-Carlo analysis. Although Monte-Carlo methods can account for correlation between uncertain variables, LSEs often assumed that all variables were uncorrelated.
3.4 Step 4: Selection of preferred portfolio
After the analysis in step 3, four main methods were used to identify the preferred portfolio among the multiple candidate portfolios:
• Lowest PVRR: In a number of cases, the LSE’s preferred portfolio was the portfolio with the lowest PVRR. Some LSEs did not assess the risk or degree to which the PVRR of different portfolio options would change if assumptions about the future changed. • Qualitative tradeoff between low PVRR and low risk: Where scenario analysis was
used to evaluate how the PVRR might change with different assumptions about the future, LSEs would sometimes use those results to adjust their preferred portfolio in an ad-hoc fashion to be a portfolio that was relatively low cost but also less risky. In some cases, for instance, the portfolio with the lowest expected cost might rely on purchases from the wholesale market instead of the LSE building or contracting for a new asset. The PVRR of this portfolio could increase greatly if wholesale prices varied within the plausible range posited by the LSE. In that case the LSE would choose a portfolio that had the next lowest cost but less exposure to the risk of high wholesale power prices.
should be given the primary emphasis in our overall portfolio risk evaluation. However, we do also continue to consider the instructive value from the stochastic analysis.
Ultimately no degree of modeling and analysis can account for all possible future uncertainties. Modeling by its nature only provides an estimate or range of estimates of future results. Nevertheless, we believe that a well-reasoned and complementary application of both scenario and stochastic analysis can provide useful insights about how a candidate portfolio is likely to perform in the future.
13
Common risk measures included the value at risk (VaR), which is the PVRR at some particular high percentile of Monte-Carlo draws (e.g., the PVRR for the 90th percentile), and the conditional value at risk (CVaR), which is the average PVRR for the most costly fraction of all draws (e.g., the average of the PVRR for the most costly 10% of draws).
• Detailed weighting between expected cost and value at risk: Some LSEs weighted the portfolio’s expected PVRR against a quantitative measure of the portfolio’s risk, such as the value at risk (e.g., the PVRR of the portfolio at the 90th percentile in the Monte-Carlo analysis). To estimate the expected PVRR and the PVRR at risk, the LSE had to perform a Monte-Carlo analysis with several hundreds of different potential futures.
• Detailed weighting among many factors: In some cases, additional factors were used to evaluate the attractiveness of each portfolio, e.g., by scoring based on cost, risk,
reliability, resource diversity, or other factors.14 This approach expands on the cost vs. risk tradeoff by adding other factors that may be important but are not clearly covered in the quantitative portfolio evaluation.
3.5 Step 5: Resource procurement
Often LSEs created IRPs using publicly available information and generic representations of generating options. When procuring resources, the LSEs solicited bids to meet the needs
identified in the preferred strategy. These bids could differ from the assumptions in the planning study in terms of cost, resource type, resource location, and generating profile. LSEs that also owned generation assets (like many western U.S. utilities) could also propose to build new generation that would satisfy the needs identified in the planning study (i.e., the “build” option rather than the “buy” option). Some LSEs used an independent evaluator to compare bids in order to mitigate potential conflict of interest. In most cases, the LSE’s RFP described how the economic attractiveness of each bid would be estimated along with the information required by the LSE or the independent evaluator to evaluate each bid. LSEs often included non-economic factors such as bidder experience as part of the bid evaluation.
3.6 Bringing it all together: A simple illustration of a resource planning study with PV To illustrate the basic mechanics of many of the planning studies that included solar, we present a simple conceptual example of how different resource portfolio options can be created and compared. We then use this simple example to illustrate the economic value of solar and the key drivers of this value.
3.6.1 Illustrative feasible candidate portfolios
In this simple example, we consider a hypothetical LSE with an expected peak load and planning reserve margin of 10,000 MW and electricity demand of 28.3 TWh in a future year (Figure 5).
14
PGE, for example, developed a very detailed method for identifying its preferred portfolio from the many that were evaluated. Both scenario analysis based on several key uncertainties (future fuel prices, carbon prices and carbon price timing, availability of renewable tax incentives, and wholesale market prices) and Monte-Carlo analysis were used to evaluate 15 portfolios created by PGE. PGE then applied a scoring to each portfolio based on its ranking in terms of cost, risk, reliability, and resource diversity. The preferred portfolio was the one with the highest score by weighting each of the different categories as follows: 20% based on reliability and diversity metrics, 30% based on portfolio risk metrics, and 50% based on expected cost.
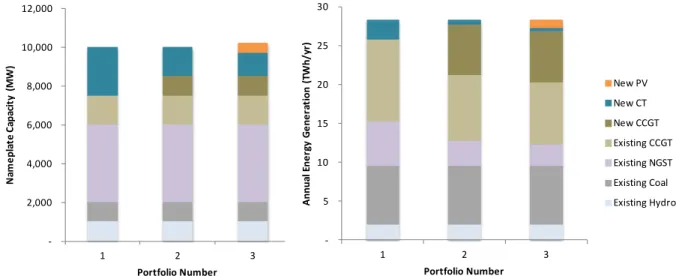
Figure 5. Portfolio composition and hypothetical dispatch
To satisfy this future demand, we create the three feasible candidate portfolios shown in Figure 5. Each portfolio maintains all of the existing generation capacity; the portfolios differ only by the generation capacity added to satisfy future needs. Portfolio 1 adds only new combustion turbine (CT) capacity, Portfolio 2 adds CT and combined cycle gas turbine (CCGT) capacity, and Portfolio 3 adds CT, CCGT, and PV (500 MW) capacity. In each case the total capacity of all resources is sufficient to maintain the same level of reliability across all portfolios.
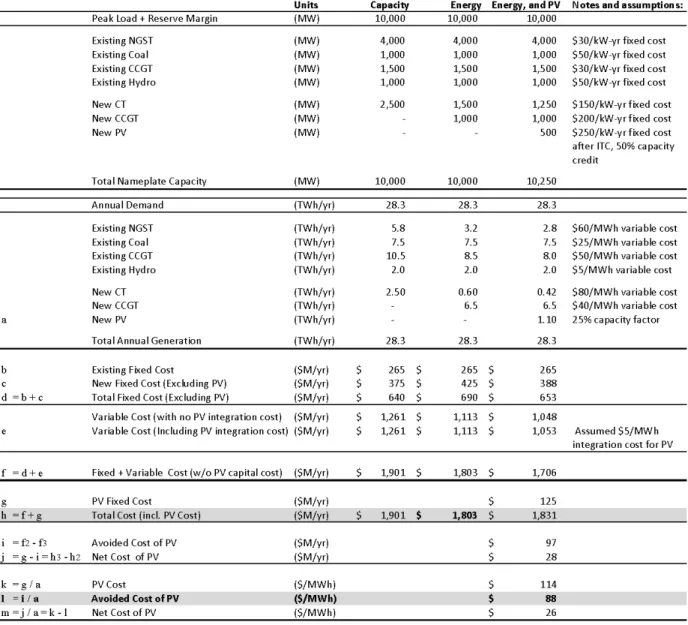
Assuming in this example that PV has a capacity credit of 50% of its nameplate capacity for this particular LSE and portfolio, then only 250 MW of the 500 MW of PV count toward the peak load and planning reserve target (the actual estimates of the capacity credit used by LSEs and the methods used to estimate the capacity credit are described in the next section). The addition of 500 MW of PV to Portfolio 3 therefore allows 250 MW of capacity (CT in this case) to be removed relative to a similar portfolio without PV (e.g., Portfolio 2). Since adding 500 MW of PV only removes 250 MW of CT, the overall nameplate capacity of Portfolio 3 is 250 MW greater than the overall nameplate capacity of Portfolio 1 or 2. The annualized fixed cost of each portfolio (excluding the capital cost of PV) is shown in Row “d” in Table 2.
-2,000 4,000 6,000 8,000 10,000 12,000 1 2 3 N am ep la te C ap ac ity ( M W ) Portfolio Number New PV New CT New CCGT Existing CCGT Existing NGST Existing Coal Existing Hydro -5 10 15 20 25 30 1 2 3 An nu al E ne rg y G en er at io n ( TW h/ yr ) Portfolio Number New PV New CT New CCGT Existing CCGT Existing NGST Existing Coal Existing Hydro
Table 2. Evaluation and comparison of three hypothetical portfolios
3.6.2 Evaluation of candidate resource portfolios
The dispatch of the existing and new generation, typically estimated using a production cost model, is assumed in this example to differ based on the resources available in each of the portfolios, as shown in Figure 5. Portfolio 1 requires significantly more of its energy to be generated by CTs and existing natural gas steam turbines (NGSTs) compared to Portfolio 2 and 3, which both have more CCGTs and PV. In particular, the addition of PV in Portfolio 3
displaces energy from new CTs, existing NGSTs, and existing CCGTs. We assume hydropower is dispatched differently in each portfolio, although the annual energy production remains the same. Owing to the relatively low variable cost of coal, the addition of PV to the portfolio does not affect the dispatch of the existing coal. In addition, PV is assumed to contribute an additional $5/MWh integration cost due to factors not represented in the other variable cost estimates such