Estimation of Mean Radius, Length
and Density of Microvasculature
Using Diusion and Perfusion MRI
M. Ashoor
, M. Jahed1, M. Chopp2 and A. Mireshghi3
In theory, diusion and perfusion information in MRI maps can be combined to yield morphological information, such as capillary density, volume and possibly capillary plasma velocity. This paper suggests a new method for determination of mean radius, length and capillary density in normal regions using diusion and perfusion MRI. Mean Transit Time (MTT), Cerebral Blood Volume (CBV), Apparent Diusion Coecient (ADC), pseudo-diusion coecient(D
)
andR
2 and R
2 values were utilized to calculate mean radius, length and capillary density.
To verify the proposed theory, a special protocol was designed and tested on normal regions of a male Wistar rat using obtained functions. Mean radius, length and capillary density in the normal regions were calculated to be 2:48 0:35 (mean SD), 234 12 microns
and 11897 219=mm
3, respectively. With respect to the values 0.01 through 0.1 for the
CBV/Vol(voxel) parameter and 1 through 1000 sec for R
2 2
=R 3
2, the mean radius of the
capillary, using the proposed method, varied from 0.076 to 7.58 microns.
INTRODUCTION
As an alternative to traditional techniques for measur-ing such parameters as capillary density and character-izing microvascular morphology, non-invasive Magnetic Resonance Imaging (MRI) techniques, with contrast weighting sensitive to micro-vasculature characteris-tics, have been proposed [1]. For instance, an approach suggested by Dennie et al., which measures changes in the spin-spin suggested relaxation rates 1=T
2( R
2)
and 1=T 2(
R
2), caused by the injection of a blood
pool restricted contrast agent, has been proposed to be sensitive to microvessel density. An image is formed by mapping the ratio R
2
=R
2, which is believed to be
proportional to the product of the diusion constant of water and microvascular density. However, the ratio
*. Corresponding Author, Department of Mechanical Engi-neering, Sharif University of Technology, Tehran, I.R. Iran.
1. Department of Electrical Engineering, Sharif University of Technology, Tehran, I.R. Iran.
2. Department of Neurology, Henry Ford Health Sciences Center, Detroit, MI, USA; and Department of Physics, Oakland University, Rochester, MI, USA.
3. Department of Mechanical Engineering, Sharif Univer-sity of Technology, Tehran, I.R. Iran.
R 2
=R
2depends, when contrast agent concentration
is high, not just on microvascular properties, but also, on contrast agent concentration [2]. This may be a disadvantage, since concentration can be dicult to estimate accurately.
Another imaging technique [3], which is not con-trast agent concentration-dependent, is proposed, in which the contrast is correlated to the morphology of capillaries and other small blood vessels. Again, the technique is based on measurements of the spin-spin re-laxation rates, 1=T
2and 1 =T
2, before and after the
in-jection of a contrast agent. An image is then formed by mapping the quantity: Q= R
2 =(R
2)
2=3. This leads
to a simple analytic formula forQ that involves only
vessel density, water diusion rate and distribution of the vessel radii: Q 1:678(DN)
1=3 hR
4=3 ihR
2 i
2=3,
where R is the radius of the cylinder (capillary), N
is the histological vessel (cylinder) density and D is
the diusion constant of water. Thus, \Q-maps"
may yield information about capillary density, raising the possibility that Q may be a good indicator of
angiogenesis. However, this expression does not yield a value for mean microvascular radius in the tissue.
Van Rijswijk et al. have reported that Apparent Diusion Coecient (ADC) values of all tumors, sub-cutaneous fat and muscle were signicantly higher than
true diusion coecients, indicating a contribution of perfusion to the ADC. Also, true diusion measure-ments, which are corrected for the perfusion eect, have the potential to be used as a noninvasive parameter in the characterization of soft-tissue masses [4], therefore, resulting in the assessment that a combination of diusion and perfusion parameters may characterize the geometrical parameters of capillaries.
Capillaries, consisting of single layer endothelial cells, permit a rapid exchange of water and solutes with interstitial uid, forming an interconnecting network of tubes of dierent lengths. Capillary distribution varies from tissue to tissue. In metabolically active tissues, capillaries are numerous, whereas, in less active tissues, capillary density is low. Therefore, geometry evaluation of capillaries can be useful and important.
At present, the relationship between capillary geometry and perfusion and diusion information, such as Cerebral Blood Flow (CBF), Cerebral Blood Volume (CBV), ADC, Mean Transit Time (MTT) and R
2 and R
2 values, is not fully established.
The combination of CBV, ADC, MTT, R 2 and
R
2values may allow a certain descriptive assessment
related to microvascular geometry, such as mean radius, length and capillary density. In this study, through introduction of a preliminary function using the above parameters, along with a suitable set of hypotheses, a new descriptive qualier, related to microvascular geometry, such as mean radius, length and capillary density, is introduced.
METHODS
Theory
A paramagnetic or super paramagnetic contrast agent introduced in the vascular compartment creates an additional susceptibility dierence () between blood
vessels and surrounding tissues and the blood fraction,
0, may be determined from R
2 measurements, if the
blood concentration of contrast agent (and, hence, )
is known,
0= 34
:
R 2 ::B
0
; (1)
whereB
0 is the magnetic eld strength of the external
magnetic eld and is the proton gyromagnetic ratio.
A spin-echo experiment yields information on the vessel size distribution and the Vessel Size Index, (VSI), can be written as:
r= 0:425
D ::B
0
1=2 : R 2 R 2 3=2
: (2)
Absolute measurement of radius (r) requires
measure-ment (or prior knowledge) of the diusion coecient
and of the increase in blood susceptibility, due to the contrast agent injection [5]. The index of the Total Capillary Length (TCL) is dened as follows:
TCL = 0 r 2
:Vol(voxel): (3)
By combining Equations 1 to 3, one obtains: TCL = 420:7 1
D : R 3 2 R 2 2
:Vol(voxel): (4)
If the capillaries are assumed to be cylinders with mean length (`) and mean radius (r), then, CBV may be
approximated as:
N
= CBV(:`:r 2) 1
; (5)
where N is the number of capillaries [6]. Arranging
the cylindrical capillary segments in a series format, namelyN:`, provides the notion that this value is
prac-tically equal to TCL. Hence, by combining Equations 4 and 5, one obtains:
r (m)=
7:5710 3 D:CBV Vol(voxel): R 2 2 R 3 2 1=2
: (6)
An experimental assessment of CBV, CBF and MTT can be outlined as follows: CBV can be dened as a volume fraction: CBV (%) = 100(volume of blood in
a voxel)/(volume of the voxel). CBF is dened as the net blood ow through the voxel divided by the mass of the voxel. The used unit for CBF is milliliters per 100 grams of tissue per minute. The MTT describes the average amount of time it takes any water molecule or particle of contrast agent to pass through the voxel vasculature. MTT is generally expressed in seconds and is given by MTT = CBV/CBF [7].
If the TCL is the Total Capillary Length, one has, according to the denition of the MTT in the capillary network, the following:
MTT = TCLV
1= (TCL)
:`(6:D ) 1
= CBVCBF 1
; (7)
where, as before, ` is the mean capillary segment
length, dened as the average distance along which spins move with a constant velocity (V) and D
is
pseudo-diusion coecient [8]. The quantity (<`>< V >=6) has the dimension of a diusion coecient and
has been referred to as pseudo-diusion coecientD .
By combining Equations 4 to 7, one obtains,
V
(m=s)= 420 :7 1
D:MTT : R 3 2 R 2 2
:Vol(voxel); (8) `
(mm)= 142 :62 D:D :MTT Vol(voxel) : R 2 2 R 3 2 ; (9)
N (1=mm
3 )= 0
:295 Vol(voxel) D 2 :D :MTT : R 2 2 R 3 2 2 : (10)
Using literature data for < ` > and < V > [7], D
is expected to be about eight to ten times larger
than the true diusion coecient of water at room temperature (D
= 10D) [9]. However, a currently
precise measurement of D
is not possible, in view
of Signal to Noise Ratio (SNR) limitations. As such, this issue certainly requires further study, especially in the theoretical analysis domain. It is believed that
D
= 10D is a good estimation and starting point for
further analytical studies and, therefore, it has been utilized in the current study. Hence, now, based on the above estimation, Equations 9 and 10 can be rewritten as:
`
(mm)= 1426 :2 D 2 :MTT Vol(voxel): R 2 2 R 3 2 ; (11) N (1=mm 3 )= 2
:9510
2Vol(voxel) D 3 :MTT : R 2 2 R 3 2 2 : (12) Finally, one can estimate mean radius, length and capillary density in normal regions using Equations 6, 11 and 12, respectively.
MRI Measurement Procedure
To evaluate the proposed theory and develop a test protocol, the following measurement was conducted on the normal vasculature regions of a male Wistar rat, using a 7 Tesla MRI system. Briey, an aged white clot (prepared 24 h before ischemia) was slowly injected into the internal carotid artery to block the middle cerebral artery (MCA) [10]. MRI measurements were performed using a 7 T, 20 cm bore super conducting magnet (Magnex Scientic, Abingdon, UK) interfaced to a SMIS console (Surrey, England). A 12 cm bore actively shielded gradient coil set, capable of producing magnetic eld gradients up to 20 gauss/cm, was used. The Radio Frequency (rf) pulses were applied by a 7.5 cm diameter saddle coil, actively decoupled by TTL control from the 1.4 cm surface receiver coil, which was positioned over the center line of the animal skull. Stereotaxic ear bars were used to minimize movement during the imaging procedure. During MRI measurements, anesthesia was maintained using a gas mixture of N2O (69%), O2 (30%) and halothane (1%).
Rectal temperature was kept at 37 0:5
C, using
a feedback controlled water bath. A modied Fast Low Angle SHot (FLASH) [11] imaging sequence was employed for reproducible positioning of the animal in the magnet at each MRI session [12]. Diusion Weighted Imaging (DWI) and Perfusion Weighted
Imaging (PWI) measurements were performed 24 hrs after the onset of embolization.
T
2 was measured using a standard
two-Dimensional Fourier Transform (2DFT) multi slice (seven slices) multi echo (four echo) MRI. A series of four sets of images (7 slices for each set) were obtained using TEs of 20, 40, 60 and 80 msec and a TR of 3 seconds. Images were produced using a 32 mm Field Of View (FOV), 2 mm slice thickness and 12864 image
matrix. The total time for the entire sequence was approximately 3.2 min. Transverse relaxation rates,
R 2, R 0 2 and R 2(1 =T 2, 1
=T 0 2 and 1
=T
2), were measured
using the Look-Locker sequence [13], which provides the data required to construct multi section maps of
R 2, R 0 2 and R
2 in a single acquisition. For this study,
ve gradient echoes, with a rst echo time of 10 msec and an interecho spacing of 8 msec, were acquired prior to the 180pulse. The echo train, after the 180pulse,
contained six echoes separated by 8.1 msec. A series of eleven sets of images (7 slices for each set) were obtained using TEs of 98 msec and a TR of 3 seconds. Images were produced using a 32 mm FOV, 2 mm slice thickness and 128128 image matrix. The total time
for the entire sequence was approximately 6.4 min. ADCw was measured using the Stejskal-Tanner
sequence with threeb-values (10, 800 and 1800 s/mm 2)
in each of three diusion sensitizing directions, seven slices, 32 mm FOV, 12864 matrix, TR = 1.5 s and TE
= 40 ms. Each image required a scan time of 3.2 min for completion. The total time for the entire sequence was, approximately, 14.4 min.
Perfusion measurements were performed prior to each diusion measurement, using the arterial spin tagging technique [14]. Two images were obtained for perfusion measurement with parameters: TR = 1 sec, TE = 30 msec, 6464 image matrix, 3 mm slice
thickness and a 32 mm eld of view. The animal PWI was measured within a coronal section, with coordinates centered at interaural 8.2 mm and bregma 0.8 mm [15]. The duration of the inversion pulse was 1 sec at a B1 amplitude of 0.3 KHz.
Data Analysis
The ROIs were selected for measurement of MRI parameters. The mean and Standard Deviations (SD) of ADCwvalues of the parenchymal tissue (not
includ-ing Cerebrospinal Fluid (CSF)) in the contra lateral hemisphere were measured and the threshold values, to determine the number of pixels with abnormal values in the ipsilateral hemisphere, were dened using mean ADCw 1:5 SD in the contra lateral hemisphere,
where this value is a heuristic one. With respect to the obtained ROIs, the mean and Standard Deviations (SD) of MTT, CBV, R
2 and R
2 values of the
were also measured. A paired t-test was used to
compare the two ROI's, with a signicance level of 0.05.
RESULTS
With respect to the values 0.01 through 0.1 for the CBV/Vol(voxel) parameter and 1 through 1000 sec for
R 2 2
=R 3
2, the mean radius of the capillary using
Equation 6 in the theory section, has been varied from 0.076 to 7.58 microns. Figure 1 depicts the relationship among the mean capillary radius, CBV/Vol(Voxel) and
CSSRT parameters, where CSSRT is the R 2 2
=R 3 2
value with the two dierent diusion constants of water as 0.0007 mm2/sec and 0.0004 mm2/sec in the ROI of
the rat's brain. As shown, by increasing the diusion constant of the water, the mean capillary radius is
Figure1. Plots showing the relationship between mean
capillary radius, CBV/Vol(Voxel ) and CSSRT parameters
where CSSRT is R 2 2
=R 3
2 value with the diusion
constant of water. As shown, by increasing diusion constant of water, mean capillary radius is increased.
increased. Figure 2 also depicts the relationship between the total capillary length, ADC, and ICSSRT parameters, where ICSSRT is the R
3 2
=R 2 2 value
with three dierent voxel volume values; 1, 8 and 27 mm3. As shown with increasing voxel volume, total
capillary length is increased.
For the calculation of ADC, the mono-exponential intra-voxel incoherent motion model was used, S(b) = S(0)exp( bADC) [12]. Because the diusion of
water may be directionally dependent (anisotropic), measurement in only one direction can lead to incorrect image interpretation. The diusion gradient was, therefore, applied in each of three orthogonal directions (x;y;z), and an average of these measurements was
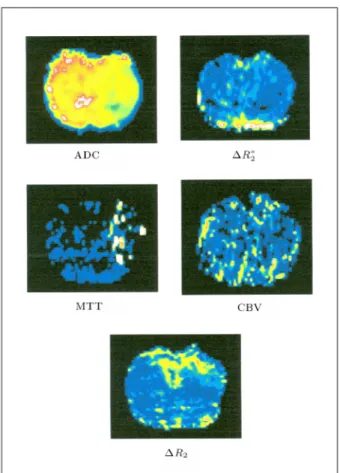
calculated to give the trace of the diusion tensor, which is reported to minimize the eects of diusion anisotropy [16]. Figure 3 depicts known maps (ADC, CBV, MTT, R
2 and
R
2) utilizing noise reduction
and artifact cancellation algorithms.
Using the ROIs in the normal regions on the upper maps, the perfusion and diusion parameters have been measured as MTT = 3:19 0:28 sec,
CBV/Vol(voxel) = 0
:058 0:012, R 2 = 3
:56
0:3 sec
1, ADC = 0
:00064 0:00007 mm 2sec 1,
Vol(voxel) = 0
:31250:31252 mm
3 and R
2 =
33:7 3 sec
1, using the obtained maps. Mean
radius, length and capillary density in normal regions, using Equations 6, 11 and 12, were calculated to be 2:48 0:35 (mean SD), 234 12 microns and
11897 219/mm
3, respectively. For normal regions,
the results are shown in Table 1, depicting the radius, length and density of the microvasculature in capillary space.
DISCUSSION
It has been shown that mean radius, length and capillary density are dependent on the ADC, CBV, MTT,D
and R
2 2
=R 3
2parameters. This study
pro-vides key specications of the microvasculature through appropriate hypotheses, using diusion and perfusion MRI. These results have been veried through
mi-Table 1. Geometrical specications of capillaries in the
normal region of rat's brain.
MeanCapillaryLength` 0:234 0:012 mm CapillaryDensity(N) 11897 219/mm
3 MeanCapillaryRadius (r) 2:48 0:35m Results are presented for normal regions where mean length, radius and density of capillary have been calculated using measured parameters such as MTT = 3:19 0:28 sec, CBV/Vol(voxel)= 0
:058 0:012, R 2= 3
:56 0:3 sec 1, ADC = 0:00064 0:00007 mm
2sec 1, Vol(voxel)= 0
:31250:31252 mm 3and
R 2= 33
:7 3 sec 1.
Figure2. Plots showing the relationship between TCL,
D and R 3 2
=R 2
2 with volume voxel. As shown, by
increasing volume voxel TCL is increased.
Figure3. ADC, MTT, R2 , R
2 and CBV maps. Left
side of all images is normal and selected ROIs are based on the right side that is a damaged region.
croscopy methods and in various published material on this subject [17-21]. Pathak et al. showed that, in the normal contra-lateral section of the brain, the mean vessel length and mean vessel radius were 178:59
28:76 and 3:72 0:72 microns, respectively [18].
The ADC is a weighted average of the diusion coecients of the intracellular and interstitial compart-ments. The diusion coecients for two separate com-partments, Dint (interstitial) and Din (intracellular), are given in the literature as Dint = 0.00325 mm2s 1
and Din = 0.000143 mm2s 1. In a normal brain, the
interstitial space volume is 20% of the total volume, whereas the intracellular compartment comprises ap-proximately 80% of the total volume. Thus, for a normal brain, one would calculate an average weighted diusion coecient of 0:20:00325 + 0:80:000143
mm2s 1, or 0.00076 mm2s 1 [22,23]. The authors
measured value is in agreement with this result. Mean radius, length and capillary density are depended on this parameter.
Energy depletion, temperature, intracellular wa-ter accumulation, changes in tortuosity of the extra cellular diusion paths and changes in cell membrane permeability have all been implicated as contributing to the changes in ADCw. The increase in ADCw
appears to occur concomitantly with loss of membrane structure and loss of barriers to diusion [24]. The decreased ADCw is associated with a specic
thresh-old level of regional cerebral blood ow, similar to that which is associated with the loss of membrane potential and is, also, associated with breakdown of energy metabolism, acidosis, cellular ionic shifts and decreased Na+, K+-ATPase activity [25]. ADC values of normal cortex and caudate-putamen were (726
22)10
6 mm2s 1 and (659
17)10
6 mm2s 1,
respectively [26]. This, however, is again, in agreement with the results obtained in this study. As shown in Figure 1, with increasing ADC, mean capillary radius will be increased.
Background imaging gradients, gradient linearity, refocusing RF pulses, eddy currents, image misregistra-tion, noise and dynamic range contribumisregistra-tion, as systemic sources of error, may aect estimation of the ADC value. Also, microscopic, biophysical tissue properties, partial volume eects, anisotropy, restriction, diusion distance, compartmentation, exchange, multiexponen-tial diusion decay, T
2 weighting and microvascular
perfusion are responsible for ADC inaccuracy [27]. In general, they aect estimation of the static and dynamic specications of the capillary, which is not in the scope of this study.
Quantity R 2 2
=R 3
2 plays a major role in the
quantication of the dynamic and static specications of capillaries in perfusion and diusion MRI. Gener-ally, in such quantication, slow rhythm and static dephasing are included. As this quantity is increased, for a constant CBV/Vol(voxel)in capillary space, mean
capillary radius is also increased. Such an increase will accelerate as CBV/Vol(voxel) is further increased. In
general, maximum (minimum) mean capillary radius occurs when R
2 2
=R 3
2 and CBV/Vol
(voxel)are both
maximized (minimized). On the other hand, (maxi-mum) mean capillary radius is directly related to ADC. In regard to the capillary length, as such quantity is variable, it is directly related to eective voxel volume, R
3 2
=R 2
2 and ADC.
ACKNOWLEDGMENTS
The authors wish to extend their gratitude and thanks to Drs. Zheng Gang Zhang, Quan Jiang and James R. Ewing for technical assistance and to the Department of Neurology's NMR Facility at Henry Ford Health Sciences Center in Detroit, Michigan, for providing the means and support required for the implementation of this study.
REFERENCES
1. Van Dijke, C.F., Brasch, R.C., Roberts, TPL., Wei-dner, N., Mathur, A., Shames, D.M., Mann, J.S.,
Demsar, F., Lang, P. and Schwickert, H.C. \Mam-mary carcinoma model: Correlation of macromolecular contrast-enhanced MR imaging characterizations of tu-mor microvasculature and histologic capillary density",
Radiology,198, pp 813-818 (1996).
2. Dennie, J., Mandeville, J.B., Boxerman, J.L., Packard, S.D., Rosen, B.R. and Weissko, R.M. \NMR imaging of changes in vascular morphology due to tumor angiogenesis", Magnetic Resonance in Medicine, 40,
pp 793-799 (1998).
3. Jensen, J.H. and Chandra, R. \MR imaging of mi-crovasculature", Magn. Reson. Med., 44, pp 224-230
(2000).
4. Van Rijswijk, C.S.P., Kunz, P., Hogendoorn, P.C.W., Taminiau, A.H.M., Doornbos, J. and Bloem, J.L. \Diusion-weighted MRI in the characterization of soft-tissue tumors", Journal of Magnetic Resonance Imaging,15, pp 302-307 (2002).
5. Tropres, I., Grimault, S., Vaeth, A., Grillon, E., Julien, C., Payen, J.F., Lamalle, L. and Decorps, M. \Vessel size imaging", Magn. Reson. Med., 45, pp 397-408
(2001).
6. Ashoor, M., Jiang, Q., Chopp, M. and Jahed, M. \Introducing a new denition towards clinical de-tection of microvascular changes using diusion and perfusion MRI",Scientia Iranica, Sharif University of Technology,12(1), pp 109-115 (2005).
7. Barbier, E.L., Lamalle, L. and Decorps, M. \Method-ology of brain perfusion imaging",Journal of Magnetic Resonance Imaging,13, pp 496-520 (2001).
8. Bihan, D.L.,Diusion and Perfusion Magnetic Reso-nance Imaging, Raven Press, Ltd. New York, chapter 15, pp 270-274 (1995).
9. Bihan, D.L. \Molecular diusion nuclear magnetic resonance imaging",Magn. Reson. Med.,7(1), pp 1-30
(1991).
10. Zhang, R., Chopp, M., Zhang, Z., Jiang, Q. and Ewing, J.R. \A rat model of embolic focal cerebral ischemia",
Brain Research,766, pp 83-92 (1997).
11. Haase, A., Frahm, J., Matthaei, D., Hanicke, W. and Merboldt, K.D. \FLASH imaging. Rapid NMR imaging using low ip-angle pulses",J. Mag. Res.,67,
pp 258-266 (1986).
12. Jiang, Q., Zhang, Z.G., Chopp, M., Helpern, J.A., Ordidge, R.J., Garcia, J.H., Marchese., B.A., Qing, Z.X. and Knight, R.A. \Temporal evolution and spa-tial distribution of the diusion constant of water in rat brain after transient middle cerebral artery occlusion",
Journal of the Neurol Sci.,120, pp 123-130 (1993).
13. Ma, J. and Wehrli, F.W. \Method for image-based measurement of the reversible and irreversible con-tribution to the transverse-relaxation rate",J. Magn. Reson.,B111, pp 61-69 (1996).
14. Williams, D., Detre, J., Leigh, J. and Koretsky, A. \Magnetic resonance imaging of perfusion using spin inversion of arterial water", Proc. Nat'l. Acad. Sci., USA,89, pp 212-216 (1992).
15. Paxinos, G. and Watson, C.,The Rat Brain in Stereo-taxic Coordinates, 2nd Eds., Academic Press (1986). 16. Barber, P.A., Darby, D.G., Desmond, P.M., Yang, Q.,
Gerraty, R.P., Jolley, D., Donnan, G.A., Tress, B.M. and Davis, S.M. \Prediction of stroke outcome with echo planar perfusion- and diusion-weighted MRI",
Neurology,51, pp 418-426 (1998).
17. Bihan, D.L. and Turner, R. \The capillary network: A link between IVIM and classical perfusion",Magn. Reson. Med.,27, pp 171-178 (1992).
18. Pathak, A.P., Schmainda, K.M., Ward, B.D., Linder-man, J.R., Rebro, K.J. and Greene, A.S. \MR-derived cerebral blood volume maps: Issues regarding histolog-ical validation and assessment of tumor angiogenesis",
Magn. Reson. Med.,46, pp 735-747 (2001).
19. Gesztelyi, G., Finnegan, W., De Maro, J.A., Wang, J., Chen, J. and Fenstermacher, J. \Parenchymal microvascular systems and cerebral atrophy in spon-taneously hypertensive rats",Brain Research,611, pp
249-257 (1993).
20. Lin, S.Z., Sposito, N., Pettersen, S., Rybacki, L., McKenna, E., Pettigrew, K. and Fenstermacher, J. \Cerebral capillary bed structure of normotensive and chronically hypertensive rats",Microvascular Re-search,40, pp 341-357 (1990).
21. Dunn, J.F., Roche, M.A., Springett, R., Abajian, M., Merlis, J., Daghlian, C.P., Lu, S.Y. and Makki, M. \Monitoring angiogenesis in brain using steady-state quantication of R
2 with MION infusion", Magn. Reson. Med.,51, pp 55-61 (2004).
22. Benveniste, H., Hedlund, L.W. and Johnson, A. \Mechanism of detection of acute cerebral ischemia in rats by diusion-weighted magnetic resonance mi-croscopy",Stroke,23, pp 746-754 (1992).
23. Bihan, D.L., Moonen, C.T.W., Van Zijl, P.C.M., Pekar, J. and Des Pres, D. \Measuring random micro-scopic motion of water in tissues with MR Imaging: A cat brain study", Journal of Computer Assisted Tomography,15, pp 19-25 (1991).
24. Jiang, Q., Chopp, M., Zhang, Z.G., Knight, R.A., Jacobs, M., Windham, J.P., Peck, D., Ewing, J.R. and Welch, K.M.A. \The temporal evolution of MRI tissue signatures after transient middle cerebral artery occlusion in rat",Journal of the Neurological Sciences,
145, pp 15-23 (1997).
25. Welch, K.M.A., Windham, J., Knight, R.A., Nagesh, V., Hugg, J.W., Jacobs, M., Peck, D., Booker, P., Dereski, M.O. and Levine, S.R. \A model to predict the histopathology of human stroke using diusion and T2-weighted magnetic resonance imaging",Stroke,26,
pp 1983-1989 (1995).
26. Hoehn-Berlage, M., Norris, D.G., Kohno, K., Mies, G., Leibfritz, D. and Hossmann, K.A. \Evolution of regional changes in apparent diusion coecient during focal ischemia of rat brain: The relationship of quantitative diusion NMR imaging to reduction in cerebral blood ow and metabolic disturbances",
Journal of Cerebral Blood Flow and Metabolism, 15,
pp 1002-1011 (1995).
27. Conturo, T.E., McKinstry, R.C., Aronovitz, J.A. and Neil, J.J. \Diusion MRI: Precision, accuracy and ow eects",NMR in Biomedicine,8, pp 307-332 (1995).