American Journal of Engineering and Technology Management
2018; 3(5): 61-68http://www.sciencepublishinggroup.com/j/ajetm doi: 10.11648/j.ajetm.20180305.11
ISSN: 2575-1948 (Print); ISSN: 2575-1441 (Online)
Optimize the Energy Conversion Efficiency for Solar PV
Grid-Connected System at Low Distribution Voltage
Shazly Abdo Mohamed
Department of Electrical Engineering, Faculty of Engineering, South Valley University, Qena, Egypt
Email address:
To cite this article:
Shazly Abdo Mohamed. Optimize the Energy Conversion Efficiency for Solar PV Grid-Connected System at Low Distribution Voltage.
American Journal of Engineering and Technology Management. Vol. 3, No. 5, 2018, pp. 61-68. doi: 10.11648/j.ajetm.20180305.11 Received: January 2, 2019; Accepted: January 23, 2019; Published: February 26, 2019
Abstract:
Renewable energy found in many forms such as solar and wind energy, tidal energy, etc. In this work, we interested to focus on solar power because of it is clean and the large amount of solar radiation arrived to the surface earth. The main purpose of this article aims to maximize the amount of extracted power from the solar system. This research investigates the connotation of maximum power point tracking (MPPT) methods which significantly increases the efficiency of the solar photovoltaic (PV) energy system. This paper presents a simulation based comparison between two different MPPT methods to optimize the energy conversion efficiency of solar PV system.Keywords:
MPPT Methods, Grid-connected PV System, Power Converters, Modeling, Simulation, Control Unit1. Introduction
Recently, renewable energy resources such as wind, PV panels and fuel cells has obtained a significant opportunity as new means of power generation to face the increasing demand for electric power [1]. Through various kinds of renewable energy resources, solar system has become one of the most favorable resources. for the time being, solar based PV is considered to be one of the most helpful natural energy sources that widely used in numerous applications as it have the feature of being maintenance and most widely distributed [2]. Newly, a great number of PV modules are inserted to the grid in many countries. The use of PV systems has become a current way of power generation owing to its well-known technology, free energy source and increasing efficiency however, costs have reduced as well as, a PV system generates electricity without moveable parts and has a long lifespan compared to another renewable sources [3]. PV generation has many merits like less any fuel costs, no pollution, require little maintenance and PV system have more others features. PV applications are split into two groups: stand-alone and grid-connected systems. Stand-alone energy systems require a battery banks to store the PV energy; this is appropriate for low power applications. Furthermore, grid-connected systems do not require battery banks; they are resorted generally in high power applications [4]. PV unit is designed to supply applicable power by means of
photovoltaic. It composed of different components, such as solar panels, an inverter, mounting, cabling and other electrical parts to set up an operating system.
This article is focus on the grid-connected PV systems that represent the most important field applications of solar energy. Grid-connected PV systems are installed to promote the performance of the utility grid by reducing the power losses, reduction in the maintenance and operational costs of the grid [5]. Generally, the common grid-connected PV systems are consisting of major components like; PV solar cell, power converters and grid interface control unit as shown in Figure 1. The main function for grid-connected PV system is to control the power flow between the primary renewable energy source and the grid, as well as the power factor of PV inverter-grid connection with high power quality.
Figure 1. A structure of PV grid-connected with MPPT controller.
In this work, the performance of solar module at different environmental conditions like solar temperature and irradiance is analyzed. The main contribution of this study aims to implement in Matlab/Simulink software the (P&O) and INC methods that are presented in this paper to determine which of these two methods are the most proper for MPPT to establish an optimal algorithm.
The rest of this article is organized for easy presentation as follows: the conventional PV modeling systems are addressed in section II. Section III, represents the implementation of MPPT different control methods. Simulation results for the proposed model are discussed in section IV. Ultimately, brief conclusions are drawn in the last section.
2. Mathematical Model Description of
PV System
The basic element of a PV system is the PV cell. PV array consists of different photovoltaic cells in series and parallel connections. Series connections are responsible for increasing the voltage of the system while the parallel connection is responsible for increasing the current in the module. The power supplied by the PV-generator depends on the solar temperature and irradiation intensity. Generally, the well-known solar cell equivalent circuit model can be modeled by a photo-generated current (Iph), a shunt resistor (Rsh) inserted in parallel with a diode and a series resistor (Rs) is represented in Figure 2 [9]. The mathematical model of the output current produced by the solar cell can be expressed as follows:
(1)
Where, I: Output current (Amperes) : Photo-current (Amperes) : Diode current (Amperes)
: Shunt current (Amperes)
Figure 2. Equivalent circuit model for representing PV cell.
By the Shockley diode, the currentdiverted over the diode is:
(exp[ ]–1) (2)
Substituting into the first equation produces the characteristic equation of a solar cell, which relates solar cell parameters to the output current and voltage:
– exp – 1 – /
(3)
Where,
IO: Reverse saturation current (Amperes)
q: Elementary charge, K: Boltzmann constant
n: Diode factor (1 for an ideal diode) V: PV cell output voltage,
T: Operating temperature Rs: Series resistance (Ω), Rsh: Shunt resistance (Ω)
American Journal of Engineering and Technology Management 2018; 3(5): 61-68 63
The current at maximum power point (Imp) is given by:
" – exp #$ #$ – 1 – " " /
(4)
Also, the power at maximum power point (Pmax) is given by:
%"&' " ( – exp #$ #$ – 1 – " " / )
(5)
3. Methods for MPPT Controller
There is a one point on the curve at which the PV is maximum (MPP). The power corresponding to this point is known as cell power at maximum (PMPP) and the voltage is known as cell voltage at maximum (VMPP). The need for MPPT is the power output of the solar PV system varies with irradiation level and cell temperature. The main base of MPPT is to extract the maximum available energy from PV by making them operate under the most efficient voltage [10]. Figure 3 represents the characteristics under standard conditions of a common PV cell which fundamentally depend on the irradiance and the cell temperature. From the curve it is observed that, the value of VMPP is lower than the value of VOC and also the value of IMPP is lower than the value of ISC.
Figure 3. (I-V) and (P-V) characteristics of a PV module.
Generally, the MPPT is an electronic device which connected between the PV-generator and its load. It aims to retain the operating point of the system as close to the MPP. The MPPT has non-linear characteristic of solar PV module. It has unique maximum power point depend on irradiation intensity and cell temperature. So, it is necessary to track constantly the MPP to maximize the output power from a photovoltaic system [11]. The efficiency of a solar panel it is very low. To improve the efficiency of the solar panel MPPT is used. There are several techniques that are used to control the MPPT. The techniques that are most commonly used are the (P&O) and the incremental conductance (INC) which illustrated in this paper.
3.1. The Perturb and Observe (P&O) Technique
The perturb and observe (P&O) is the most commonly applied method in control of MPPT for the PV-generator in practice thanks to its simple structure, low cost, easy to implement and reduced number of parameters [12, 13]. The
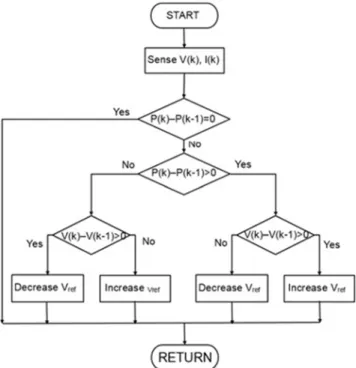
(P&O) technique is depending on investigating the relation between PV module output power and its voltage. The solar panel curve showing MPP operating points is depicted in Figure 4 that indicates, the resulting change of PV power is observed as follow: If the PV module working point is on the left side of the curve (∆P/∆V is positive). So, the PV module output power increases, then the perturbation of the PV module voltage should be increased towards the MPP. When the working point of the module on the right side of the curve (∆P/∆V is negative). then the perturbation of the PV module voltage should be decreased towards the MPP. Figure 5 illustrates the flow diagram of the (P&O) technique.
Figure 4. Solar panel curve showing MPP operating points.
3.2. The Incremental Conductance (INC) Technique
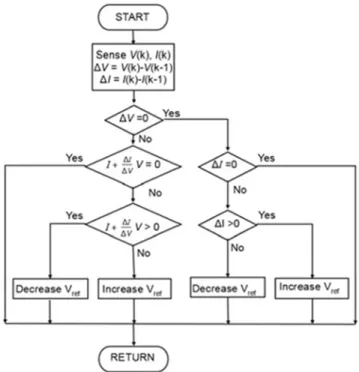
In the incremental conductance (INC), the controller sense incremental changes in PV array voltage and current. This technique requires more computation but can track changing conditions more readily than the (P&O) method [14, 15]. This method utilizes the incremental conductance (∆I/∆V) of the PV array to calculate the sign of the variation in power with respect to voltage (∆P/∆V). The INC method calculates the MPP by comparison of the incremental conductance (∆I/∆V) to the array conductance (I/V). If two are the same (∆I/∆V= I/V), the output voltage is the MPP voltage. The controller keeps this voltage till the irradiation changes. The INC method is based on the observation that at the MPP, ∆P/∆V = 0 and that P = VI. The INC technique has only two sensors, voltage and current sensors are required to measure the PV output voltage and current [16]. The flow diagram of the INC method is presented in Figure 6. The mathematical equations that describe the INC method can be expressed as: The output power from the source can be written as:
P = V. I (6)
The chain rule for the derivative of products with respect to voltage yields:
∆P/∆V = ∆ (V I) / ∆V = I ∆V / ∆V + V ∆I / ∆V
∴ (1/V) ∆P/∆V = (I/V) + ∆I/∆V (7) Generally, the output voltage from a source is (+ve). The main assignment of this technique is therefore to search the voltage working point at which the conductance is equal to the INC. These notions are expressed by equation (8-10) and shown graphically in Figure (4). The INC is based on the slope of the P-V curve. The slope will become zero at MPP, increases on the left side of the MPP and decreases on the right side of the MPP. The model equations of this method are as follows:
∆P/∆V > 0, Left side of the MPP (8)
∆P/∆V = 0, At the MPP (9)
∆P/∆V + 0, Right side of the MPP (10)
The relation among the instantaneous conductance (I/V) and the incremental conductance (∆I/∆V) can be calculated based on equation (7) as follows:
∆-∆.
-. At the MPP (11)
∆-∆. /
-. Left side of the MP (12)
∆-∆. +
-. Right side of the MPP (13)
The PV output is required to contain a dc/dc converter to set the solar modules output voltage at the desired value to track the MPP. The power converters are the devices widely used in numerous industrial applications. The three topologies more common which are the buck, boost and
buck-boost converters. These topologies have several features depend on the insertion among their devices. In this study, boost-converter topology is used because its freewheeling diode can be used for blocking reverse current and it efficiently amplify PV output voltage to higher value and are controlled by pulse width modulation (PWM) switch.
Figure 6. Flow diagram of (INC) MPPT technique.
Figure 7. Boost converter topology.
Boost converter topology steps up the input voltage magnitude to a required output voltage magnitude without the use of a transformer [17]. The basic components of a boost converter are an inductor, capacitor, a diode and a high frequency switch as depicted in Figure 7. For steady-state operation, the average voltage through the inductor over a full period is zero. The ratio between the input and output voltages conversion can be expressed as follows:
0 1 122 0.0 (14)
Therefore, 0 5 0 1 1 5 1 (15)
Where, The duty cycle, α = Ton/T and T = Ton + Toff
∴ 6 67 688 22
9
9:; (16)
American Journal of Engineering and Technology Management 2018; 3(5): 61-68 65
higher rms current would flow through the filter capacitor.
4. Analysis of the Simulation Results
In this simulation model the PV panel is inserted with utility grid as shown in Figure 8. The PV designed aims to transfer power from PV array to the utility grid. In order to compare the accuracy and efficiency of the MPPT techniques
selected in this research. Simulation results are obtained by using MATLAB/Simulink for the MPPT control techniques of the solar PV generator that is connected to the grid. The modeling system is used to highlight the difference between (P&O) and the INC methods which used in this work. The parameters and specifications of the PV modules are listed in Appendix.
Figure 8. Configuration of PV grid-connected system in Simulink model.
Figure 9. Output power with and without the (P&O) method
Figure 10. Output power with and without the (INC) method.
Figure 11. P-V curve of a PV module at weather conditions.
Figures 9 and 10 are comparison of output powers for the PV system with MPPT techniques used in the present paper at the conditions of 700W/m2, 28°C and the load of 15Ω. Figure 11 is the power-voltage curve of PV modules at the same climate conditions, which is used to collating the tracking results simulated by the PV module. From these Figures it can be noticed that, the output powers with MPPT techniques are obviously greater than those without MPPT techniques.
Figure 12. Simulation results of PV side with (P&O).
Figure 13 show the simulation results of the (P&O) at grid side which indicates the changes in real and reactive power on the grid side, voltage and current injected to the utility grid from the PV system.
Figure 13. Simulation results of grid side with (P&O).
American Journal of Engineering and Technology Management 2018; 3(5): 61-68 67
Figure 14. Simulation results of PV side with (INC).
Figure 15 show the simulation results of the INC at grid side which indicates the changes in real and reactive power on the grid side, the voltage and current injected to utility grid from the PV system.
Figure 15. Simulation results of grid side with (INC).
5. Conclusion
The purpose of this article is to study and compare merits, demerits and execution efficiency for power-feedback MPPT techniques, including P&O and INC methods. Also, presents a grid-connected PV-generator under low distribution voltage appropriate for residential, industrial and small customer applications. As well, the MPPT methods are carried-out with
faster than the (P&O) method because of not have drifting problem and it was the most efficient at rapidly changing conditions.
Appendix
Rated maximum power = 200W Rated voltage = 40V
Rated current = 5A
Open circuit voltage VOC = 49.6V Short circuit current ISC = 5.5A
ISC temperature coefficient = 1.65 mA/C VOC temperature coefficient = -0.129 V/C
References
[1] L. El Bahir and T. Hassboun, “Accurate Maximum Power Point Tracking Algorithm Based on a PV Device Model”, International Journal of Photoenergy, Article ID 5693941, pp. 1-10, 2017.
[2] R. Chao, S. Ko, H. Lin and I. Wang, “Evaluation of a Distributed Photovoltaic System in Grid-Connected and Standalone Applications by Different MPPT Algorithms”, Energies, Vol. 11, pp. 1-15, 2018.
[3] A. Rini , M. Thomas, K. Palanisamy, S. Umashankar, “Enhancing Low Voltage Ride Through Capability in Utility Grid Connected Single Phase Solar Photovoltaic System”, Journal of Engineering Science and Technology, Vol. 13, No. 4, pp. 1016 - 1033, 2018.
[4] B. Yang, W. Li, Y. Zhao and X. He, “Design and Analysis of a Grid-Connected Photovoltaic Power System”, IEEE Transactions on Power Electronics, Vol. 25, No. 4, pp. 992-1000, Apr. 2010.
[5] C. Khomsi, M. Bouzid, K. Jelassi, “Power Quality Improvement in a 3-Phase Grid Tied Photovoltaic System Supplying Unbalanced and Nonlinear Loads”, International Journal of Renewable Energy Research, Vol. 8, No. 2, pp. 1166- 1177, June 2018.
[6] M. Khatri, A. Kumar,” Experimental Investigation of Harmonics in a Grid-Tied Soalr PV System,” International Journal of Renewable Energy Research, Vol. 7, No. 2, pp. 901-907, 2017.
[7] A. Enany, A. Farahat and A. Nasr, “Modeling and evaluation of main maximum power point tracking algorithms for photovoltaic systems”, Renewable and Sustainable Energy Reviews, Vol. 58, pp. 1578–1586, 2016.
[8] S. R. Nandurkar, et al., “Modeling Simulation & Design of Photovoltaic Array with MPPT Control Techniques”, International journal of applied power engineering (IJAPE), Vol. 3, No. 1, pp. 41-50, April 2014.
[9] V. Lavanya and G. Janardhan, “Simulink Modeling and
Analysis of Grid connected PV System”, Journal of Science and Technology, Vol. 13, PP. 67-72, Dec. 2017.
[10] M. Bakkar, M. Abdel G., M. A. zied, “Photovoltaic Maximum Power Point Grid Connected based on Power Conditioning Technique Employing Fuzzy Controller”, Renewable Energy and Power Quality Journal (RE&PQJ), Vol. 1, No. 13, April 2015.
[11] B. Subudhi and R. Pradhan, “A comparative study on maximum power point tracking technique for photovoltaic power systems,” IEEE Trans. Sustainable energy, vol. 4, No. 1, pp. 89–98, Jan 2013.
[12] R. Bharti, R. Mandal, “Modeling and simulation of maximum power point tracking for solar PV system using perturb and observe algorithm,” International journal Research and Tech., Vol. 3, Issue. 7, PP. 675-681, July 2014.
[13] G. Patel, D. B. Patel and K. M. Paghdal, “Analysis of P&O MPPT Algorithm for PV System”, International Journal of Electrical and Electronics Engineering (IJEEE), Vol. 5, Issue 6, 2016.
[14] M. El-Sayed and S. Leeb, “Evaluation of Maximum Power Point Tracking Algorithms for Photovoltaic Electricity Generation in Kuwait”, Renewable Energy and Power Quality Journal (RE & PQJ), pp. 1-6, April 2014.
[15] M. Lamnad et al., “Comparative Study of IC, P&O and FLC Method of MPPT Algorithm for Grid Connected PV Module”, Journal of Theoretical and Applied Information Technology, Vol. 89, No. 1, pp. 242-253, 15th July 2016.
[16] F. L. Tofoli, D. C. Pereira and W. J. Paula, “Comparative Study of Maximum Power Point Tracking Techniques for Photovoltaic Systems”, International Journal of Photo-energy, pp. 1-10, January 2015.
[17] R. Ingudam and N. Roshan, “Modelling and Performance Analysis of DC-DC Converters for PV Grid Connected System”, International Journal of Science, Engineering and Technology Research (IJSETR), Vol. 4, Issue 5, pp.1378-1390, May 2015.