Does interactivity improve exploratory data analysis of animated trend
visualization?
Felwa A. Abukhodair*, Bernhard E. Riecke**, Halil I. Erhan**, Chris D. Shaw**
School of Interactive Art and Technology, Simon Fraser University, 250 – 13450 102 Avenue,
Surrey, BC, V3T 0A3, Canada +1778 782 7532
ABSTRACT
Effectively analyzing trends of temporal data becomes a critical task especially when the amount of data is large. Motion techniques (animation) for scatterplots make it possible to represent lots of data in a single view and make it easy to identify trends and highlight changes. These techniques have recently become very popular and to an extent successful in describing data in presentations. However, compared to static methods of visualization, scatterplot animations may be hard to perceive when the motions are complex. This paper studies the effectiveness of interactive scatterplot animation as a visualization technique for data analysis of large data. We compared interactive animations with non-interactive (passive) animations where participants had no control over the animation. Both conditions were evaluated for specific as well as general comprehension of the data. While interactive animation was more effective for specific information analysis, it led to many misunderstandings in the overall comprehension due to the fragmentation of the animation. In general, participants felt that interactivity gave them more confidence and found it more enjoyable and exciting for data exploration.
Keywords: scatterplot animation, comprehension, trend visualization, animated visualization, animated bubble chart, animation, trends, information visualization, experiment, interactive animated visualizations, interactivity
1
INTRODUCTION
Animation is argued to have many advantages for presenting complex information graphics. Bartram [1] and other researchers demonstrated evidence for the effectiveness of using animation for visualization, mainly as an additional dimension to represent complex multivariate data. Animation has been widely used in visualizations for various reasons such as showing trends of change over time (Gapminder Trendlizer) [2], state transition from one view to another [3][4][5][6], and demonstrating complex systems for learning [7]. In particular, animation has become a popular method for visualizing trends in multivariate information spaces that contain many distinct time series over a common time period. Recently, we observed animations in data visualizations that are used in live presentations, where usually a narrator (or a presenter) tells a data-driven story and directs the audience’s attention to points of interest and changes in the data. For example, animated trend visualizations have been extensively used and popularized by Hans Rosling in his famous and engaging TED talks about global trends using his animated bubble chart. Rosling introduced animated bubble charts to present complex global trends in a simple and enjoyable way. But are they also effective without such an engaging narrator?
The literature presents different views on the potential benefits and disadvantages of animation as a technique for exploratory data analysis. Nakakoji et al.’s [8] protocol analysis of their user study on the cognitive effect of animated visualizations for exploratory data analysis showed that animation can help for chunking data, interpreting data, focusing, and comparing. Also, they showed it falls short in supporting grasping the whole. Robertson et al. [4] studied the effectiveness of animated transition between related data graphics. They concluded that animated transitions potentially improve graphical perception of changes between views and help keep the user in context. In addition, Boltman et al. [3] suggested that using animated transition helps the user construct a mental map of spatial information.
**[email protected]; [email protected]; [email protected]
Similarly, Griffin et al. [9] compared animated maps (passive animation without interactivity) and multiple static map representations. Their findings revealed that animated maps could be more effective for data exploration and particularly for map readability tasks. Further, Bartram [10] and Ware [11] both argued that animation can enable visual grouping of moving clusters and thus support users in analyzing and identifying trends.
On the other hand, Tversky et al. [12] argued that animations can be hard to perceive mainly because of the complexity and speed of motion or the complexity of perceiving moving patterns as a sequence instead of discrete steps. Supporting this argument, Archambault et al.’s [13] comparison study showed that static small multiple images of a time series next to each other can be more effective in terms of task completion time for data analysis but has led to more user errors compared to animation. Similarly, Robertson et al. [14] compared animation to two static techniques to represent trends in temporal data: small multiples and static traces. They studied the effectiveness of the three techniques for both presentation and analysis using animated bubble charts. Results from this study showed that animation is the most effective way for presentation but the least effective for analysis in terms of error rate and task completion time.
However, previous studies that favor static multiples acknowledge the fact that static representations suffer from scalability issues in most cases not exceeding 200 data points at once according to Robertson et al. [14]. Also, Bartram [10] argued that small multiple representations suffer from visual fragmentation between the different displays and make it harder to accurately perceive an overview understanding. Morrison et al. [15] conducted a critical analysis of previous studies on the effectiveness of animation compared to multiple static displays and concluded that results from those studies cannot be fully trusted. He argued that in most cases where animation was superior to static presentation, the studies were not comparable because of lack of equivalence in the amount of available information or in some cases added interactivity that is known to enhance learning. On the contrary, in cases where animation failed, this was explained to be due to the complexity of perceiving animation or in other cases events that were perceived as discrete rather than sequential. Tversky et al. [12] concluded that only carefully designed animated graphics could be beneficial and interactivity is the key to overcome most of the disadvantages of using animation in data representation. To date, however, there is a shortage of studies that directly investigated the potential benefits of interactivity in trend visualizations without introducing unnecessary confounds.
These views suggest that there is a need for further investigation on the effectiveness of animation for analyzing trend visualizations and whether interactivity plays a contributory role in making animations more effective and comprehensible. In order to further understand whether interactive animation is effective for “exploratory data analysis of trend visualizations” we conducted a comparative study on animated bubble chart visualization with and without interactivity. Bubble charts (or scatter plots using bubbles) became to be known as the most successful way to visually perceive trend (change over time) for data plotted on three dimensions as defined by Sirisack et al. [16]. The basic concept of animated bubble charts, as in Gapminder Trendalyzer (the Gapminder website, 2008), is to present temporal data in more than two dimensions using bubble size as an additional dimension along with motion to depict development over time. This technique appeared to be effective for presenting trends and changes in the data flow. However, the question remains about whether or not animation is effective for analysis, in which case an individual is exploring the data without the help of a narrator to indicate points of interest and change. We measured analyst task time and error rate on a number of small analysis tasks, along with subjective satisfaction ratings of the two bubble chart variants. We were interested in measuring overall comprehension of the datasets as well as detail related tasks. This study is designed to help us better understand whether viewing animations alone is effective for analyzing data patterns without the presence of a narrator, or whether analysts need added interactivity to play, stop, playback and control the speed and time to make animation an effective technique for data analysis.
The hypotheses for this study are:
H1: Interactive animation will be more effective than non-interactive animation for exploratory data analysis. This means that participants in general will be (a) faster and (b) will make fewer errors in analyzing the data.
H2: Interactive animation will be more accurate for answering specific tasks.
These two hypothesis are derived from Tversky et al’s [12] suggestion that interactivity could overcome the complexity of animation.
H3: Non-Interactive animation will be more accurate for understanding overviews and answering overall tasks.
This hypothesis is derived from Bartram’s argument [10] that multiple static displays suffer from visual fragmentation and decrease an analyst’s overall understanding.
2
METHODS
This study was performed to investigate the effectiveness of interactivity in animated trend visualizations for exploratory data analysis using animated bubble charts. The Research Ethics Board at Simon Fraser University approved this study.
2.1 Participants
20 naïve participants were recruited from different backgrounds including SFU undergraduate students, 10 males and 10 females. Upon successful completion of the two periods of the study, participants were paid $20. In addition, SFU students were also rewarded with one course credit for participation.
2.2 Visualization technology
To conduct the experiment, animated bubble charts were used as the visualization technique for data analysis using the Gapminder desktop software (see Figure 1) created by Hans Rosling (2008). The Gapminder Desktop is a standalone downloadable version of the famous Gapminder Trendalyzer that can be used to create animated data plots without an Internet connection.
15 participants reported that they have never seen Hans Rosling talks on TED or the Gapminder software. All 20 participants said they were familiar with scatterplots but have never seen animated bubble charts before except for 5 participants who saw the TED talks.
Figure 1. Gapminder desktop, 2008
2.3 Datasets
For this experiment 2 Datasets were used: Global Health and Wealth, and Wealth and Mortality Rate. These datasets came from the Gapminder website database. The datasets were carefully selected to ensure they were both of the same size and topic, which in this case was about global trends between countries and continents. The datasets were blocked
within each session of the experiment. A set of 10 countries (bubbles) was pre selected and highlighted in the visualization to analyze for both periods of the experiment (see Figure 1).
2.4 Experiment design
The experiment design was a 2 (Session: 1, 2) × 2 (Treatment: Interactive, Non-Interactive) within participant experiment design. The main experiment included two sessions, consisting of 11 tasks (6 specific analysis tasks and 5 general comprehension tasks). These tasks were inspired by Hans Rosling’s TED talks as well as the Gapminder website. Order of treatment was blocked within each session, while the treatments were balanced between genders. The experiment was composed of a tutorial session where the experimenter played the role of a presenter and explained the visualization, animation, interaction and trend in the data. Following the tutorial the experiment consisted of two sessions, in which the order of treatment was balanced between the genders of participants. At the end of the experiment, participants completed a questionnaire that reflected their subjective preferences regarding animation and interaction (see Figure 5). The experiment took about 45 minutes overall including the tutorial session.
2.5 Interaction techniques
In the Interactive period, participants had full interaction with the animation control panel and visualization. These interactions included:
Animation control: play, stop, time slider to reverse direction of animation and select time slice, and speed slider.
Visualization interaction: select bubble to highlight name of country and readings on the x and y axes, and select continents from map to highlight country bubbles in the visualization.
Following the issue of comparability addressed by Tversky et al. [12], in the Non-Interactive period participants also had full interactivity with the visualization (e.g., select country, highlight name) but did not have the ability to control the animation. This was intended to reduce confounds that might have been present in some of the earlier studies criticized in Morrison et al. [15].
2.6 Tasks
The experiment contained 26 tasks (see Table 1 for sample tasks). In order to analyze the data, each participant was asked to complete general comprehension tasks as true and false questions as well as specific tasks as multiple-choice questions. For the latter, 3 different answers were provided but only one answer was correct.
These tasks were as follows:
• Tutorial: 2 specific tasks and 2 general comprehension tasks for training purpose during tutorial period. • Interactive: 6 analysis specific tasks and 5 general comprehension tasks.
• Non-Interactive: 6 analysis specific tasks and 5 general comprehension tasks. Table 1: Sample of tasks used in the study.
Specific Tasks:
Select the correct answer:
• In 1980, which country had the biggest number of Children per woman?
a. Afghanistan b. Rwanda c. Yemen
General comprehension tasks: Mark by True or False:
• The birth rate and life expectancy gaps between countries are larger today. [ ]
2.7 Experiment procedure
Each participant had to go through a tutorial session followed by two sessions of treatments. One session was Interactive and the other one was Non-Interactive. Treatment order was balanced within participants’ genders.
In each session the participant was presented with an animated bubble chart visualization of a specific dataset. The topic of the dataset was given to the participant on a paper with a general overview description of the data. Then each participant was required to answer the given tasks on paper. A set of 10 countries (bubbles) was pre selected for each dataset in the visualization. There were no time restrictions for each of the sessions, although participants were asked to analyze the data and answer the questions as accurately and efficiently as possible.
2.7.1 Tutorial period
Consists of small dataset visualization about technology and the trend of Internet users around the globe. The experimenter presented the data and explained the visualization. Following the mini presentation each participants was asked to answer 2 specific tasks followed by 2 general comprehension tasks.
2.7.2 Interactive period
In this period participants actively interacted with the visualization and controlled the animation. That is participants had the freedom to play and stop the animation as well as use the speed slider and time slider to control the direction of the animation and pinpoint a specific time slice. Participants were also able to interact with the bubbles by clicking or selecting a country from a side menu to highlight bubbles in the visualization.
2.7.3 Non-interactive period
In this period participants passively watched the animation without the ability to control the animation. Participants were only able to play the animation from beginning to end as many times as needed. Interactivity was limited to interaction with the visualization by clicking and highlighting bubbles.
2.8 Data collection
During the experiment the following data were collected. (1) Time: was collected in two segments.
• Learning time: is the time needed by the participant to understand the dataset. This time was calculated from the time the dataset was available and the participant was ready to analyze the data until the participant decided he/she was ready to answer the tasks. (Beginning and end were verbally communicated between participant and conductor).
• Task completion time: is the time needed by the participant to complete tasks. This time was calculated from the time the participant started to read the task descriptions until he/she finished completing all tasks.
(2) Accuracy: measures the number of correct answers in three parts.
• Specific task accuracy: each question has three possible answers but only one answer is correct.
• General comprehension accuracy: each question could be answered with true or false but only one answer is correct.
• Overall accuracy: average percentage of correct answers of the two previous measures. (3) Subjective Preferences Questionnaire:
• A set of 13 questions on a 7-point likert scale (see Figure 5).
• 2 multiple-choice questions about the most and least preferred animation control. • 1 open ended question seeking more feedback.
3
RESULTS
3.1 Learning and task completion time
Learning time on average was equal to the time needed for playing the animation once across all participants thus; it was ignored in the further data analysis.
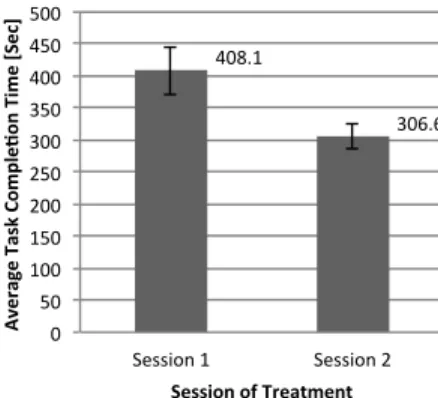
To analyze task completion time, we performed a 2-Way ANOVA on 2 (Sessions: 1, 2) × 2 (Treatment: Interactive, Non-Interactive). For this analysis we used the mean task completion time. The session in which the treatment was given had a main effect on task completion time (F (3,36) = 5.63, p = 0.023*). In general, participants performed significantly faster in Session 2 where they were already familiar with the visualization and knew already how to interact (306.7s vs. 408.2s, respectively, see Figure 2). Participants supposedly took longer in Session 1 because they needed to spend a significant amount of time learning the interaction and control tools and familiarize themselves with the visualization.
Figure 2. Task completion in Session 2 was significantly faster than Session 1.
3.2 Accuracy
Accuracy was defined as the percentage of correct answers, and is summarized in Table 2 for each of the eight conditions. The overall accuracy was high in this experiment, with an average of 84.6%, which indicates that the tasks were easier than anticipated.
Table 2: Average Accuracy (%) for each of the eight conditions.
Session 1 Session 2
Task Type Specific General Specific General
Interactive 91.7 86 91.7 84
Non-Interactive 76.7 76 78.3 92
To analyze accuracy, we performed a 3-Way ANOVA on 2 (Session: 1,2) × 2 (Treatment: Interactive, Non-Interactive)
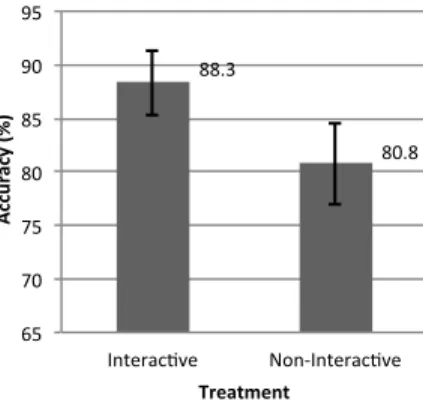
× 2 (Task Type: Specific, General). Results showed a main effect of Treatment on accuracy (F(7,72) = 5,05, p = 0.028*). Accuracy was overall higher for Interactive treatment (mean: 88.3%) as compared to Non-Interactive treatment with a mean of 80.8% (see Figure 3). Neither session nor task type showed any significant main effects (F(7,72) = 1.35, p = .249 and F(7,72) = .0006, p = .980, respectively).
The only interaction that came close to significance was between Treatment and Task Type (F(7,72) = 3.81, p = .055). This interaction is illustrated in Figure 4. To further investigate this, we performed post hoc comparisons using the Tukey HSD test. Average accuracy for answering Specific questions using Interactive treatment (M = 91.7, SD = 13.8) was significantly higher than the average accuracy for answering Specific questions using Non-Interactive treatment (M = 77.5, SD = 17.3). However, the average accuracy for answering General questions using Interactive treatment (M = 85, SD = 12.8) and the average accuracy for answering General questions using Non-Interactive treatment (M = 84, SD =
408.1& 306.6& 0& 50& 100& 150& 200& 250& 300& 350& 400& 450& 500& Session&1& Session&2& Av er ag e' Ta sk' Co m pl e0 on 'T im e' [S ec ]' Session'of'Treatment'
16.7) did not significantly differ from each other or from the average accuracy for answering specific questions for both treatments (see Figure 4). In summary, interactive treatment was most accurate for answering specific questions whereas non-interactive treatment was the least accurate for answering specific questions. General questions, however, did not benefit from added interacticity.
As indicated in Table 2, there was also a tendency for general comprehension questions for Non-Interactive treatment being more accurately answered in the Session 2 (92% accuracy) as compared to Session 1 (76% accuracy), but this trend did not reach significance.
Figure 3. Interactive treatment was overall more accurate than Non-Interactive treatment.
Figure 4. Interactive treatment was significantly more accurate for answering Specific tasks than Non-Interactive treatment, whereas General tasks were not affected by Interactivity.
3.3 Subjective preferences
At the end of the study each participant was asked to complete a questionnaire that consists of 13 questions with a 7-points Likert scale answers where 0 = strongly disagree, and 6 = strongly agree (See Table 2). Person correlation analysis was performed to understand the relationship between subjective preferences for animation and interaction. There is a strong correlation between Q1 and Q5 and between Q5 and Q10. This correlation showed that participants who found the animation enjoyable and participants who found the animation exciting alone without interaction also found the animation helpful for answering questions. Another correlation was detected between Q8 and Q9. This showed that participants who found interactivity enjoyable also found the tasks easy to answer using interactivity. Another correlation was detected between Q8 and Q11 and between Q9 and Q11. This showed that participants who found the interaction exciting also found the interaction helpful for answering questions. Similarly participants who found the interaction enjoyable also found it helpful for answering questions.
88.3$ 80.8$ 65$ 70$ 75$ 80$ 85$ 90$ 95$ Interac1ve$ Non5Interac1ve$ !Ac cu ra cy !(%) ! Treatment! 91.7% 77.5% 85% 84% 70% 75% 80% 85% 90% 95% 100% Interac1ve% Non5Interac1ve% Ac cu ra cy '(%) ' Treatment' Specific%% General%
Figure 5. Average rating for 13 general questions about the usefulness of animation and interaction on a 7-point Likert scale where 0 = strongly disagree, and 6 = strongly agree.
Overall, the questionnaire results on the one hand showed that most of the participants were neutral or somewhat agreed about animation alone being exciting (Q10, M = 3.9) and neutral about animation alone being helpful for answering questions without interaction (Q7, M = 3.1). On the other hand, the majority agreed that interaction is enjoyable, helpful and made the tasks easy to answer (Q8 & Q9, M = 5.3).
The questionnaire also included a question to choose the most and least preferred method of animation control. Participants had to choose between time slider, speed slider and play/stop button. 19 out of 20 participants reported that the time slider is the most effective tool while 18 out of 20 reported that the speed slider is the least effective and in most cases never been used. 2 out of 20 participants said that the play / stop button is the most useful while 3 out of 20 said it is the least useful control. The last question was open-ended seeking more feedback. Following the questionnaire, participants were encouraged to orally express further feedback about the animation and the interactivity. The questions included which session they found more enjoyable, easy to understand the overview, easy to find details, and which one is more comprehensible. In the final feedback participants often commented that they generally enjoyed the Interactive treatment more because they felt much more in control and they could be more accurate about the specific information
4.75% 2.7% 2.2% 4% 4.9% 5.8% 3.1% 5.3% 5.3% 3.9% 4.8% 2.3% 2.9% .00% 1.00% 2.00% 3.00% 4.00% 5.00% 6.00% Q1:%I%found%the%anima;on%enjoyable.% Q2:%The%anima;on%went%too%fast%for%me.% Q3:%The%anima;on%went%too%slow%for%me.% Q4:%I%lost%track%of%some%data%points%as%they% moved.% Q5:%The%anima;on%was%helpful%for%me%for% answering%the%ques;ons.% Q6:%The%interac;on%was%helpful%for%me%for% answering%the%ques;ons.% Q7:%I%found%the%task%easy%for%me%to%answer%using% anima;on%only.% Q8:%I%found%the%task%easy%for%me%to%answer%using% interac;on%with%anima;on.% Q9:%I%enjoyed%the%interac;on.% Q10:%I%found%the%anima;on%alone%exci;ng.% Q11:%I%found%the%interctaion%exci;ng.% Q12:%I%found%the%screen%too%cluKered.% Q13:%Interctaion%with%the%bubbles%would%be% enough%to%answer%ques;ons%without%the%need%to%
Subjec've)Prefrences)Ques'onnaire)
they were seeking. Also they commented on the difficulty of tracking bubbles in the Non-Interactive treatment and answering Specific questions when they had no control over the animation.
In the Non-Interactive treatment, most of the times participants did not feel like they want to play the animation again, instead they would do a guess while the overview image is still fresh in mind. Participants also commented that they were more confident answering General questions in the Non-Interactive session and Specific questions in the Interactive session. Another interesting comment that supports the previous one is that participants felt it was almost harder to understand the big picture about the data in the Interactive session and felt like the overview was more fragmented as opposed to the Non-Interactive session where the animation was playing smoothly from beginning to end. It is also interesting that participants felt that they almost changed the way they were thinking and analyzing the data depending on the treatment. They were more focused on finding details in the Interactive session and answering the questions in a sequential order. On the contrary, in the non-interactive session participants were jumping between questions and keener on having an overview understanding from which they were able to make inferences or guess in some cases.
4
DISCUSSION AND CONCLUSION
This paper studied the effectiveness of interactive animation as a visualization technique for exploratory data analysis of large data. Results from this study showed that while the use of animation with interaction is more effective for specific information analysis, it had no significant effect on the general comprehension of the overall trend. Participants felt that animation without interaction is more efficient for understanding the overview when the animation is played smoothly from beginning to end. However, there are no statistically significance differences between the accuracy of answering General comprehension tasks using both treatments. In the conclusion, participants felt that interactivity gave them more confidence and found it more enjoyable and exciting for data exploration.
Analysis of task completion time showed no effect of interactivity on speed of analysis. However, the Session in which the treatment was given had a main effect on the average task completion time. This finding supports participants’ feedback about feeling confident and efficient in answering any kind of questions because they feel in control but only after they are familiar with the available interactions and controls.
The analysis of task completion time rejects the first hypothesis part (a) that suggests that interactive animation will be faster in general since there was no significant effect of treatment on task completion time.
Results of accuracy analysis showed that overall accuracy was high. This finding supports Archambault et al.’s [13] findings that showed that animation has led to lower error rate compared to multiple static views.
In general, Interactive treatment was significantly more accurate than Non-Interactive treatment. This finding supports the first hypothesis part (b) that suggests that interactive animation will be more accurate than Non-Interactive treatment. More specifically, Interactive treatment was very effective for accurate data analysis of specific details in which case the analysis had the option to control when to play and stop the animation. The analysis also had the ability to pin point the time slider to investigate specific point of interest in the data without the constraint of passively watching the whole animation. This finding strongly support the second hypothesis that suggests that interactive animation will be more accurate for answering specific tasks, thus supporting Tversky et al’s argument [12].
The post-hoc interaction analysis of accuracy between Treatment and Task Type showed no significant effect of Treatment on general comprehension tasks (Interactive, M = 85%, Non-interactive, M = 84%). This finding rejects the third hypothesis that suggests that Non-Interactive animation will be more accurate for understanding overviews and answering overall tasks.
We also acknowledge that there are several issues that should to be considered in future studies. For task completion time analysis: first, the Non-Interactive session was slow because participants could not control the animation and needed to play the animation 5 - 7 times on average to answer specific questions. Second, in the Interactive session participants spent a significant amount of time exploring and trying the different tools they can use to control the animation and loosing focus of the specific task. Finally, we could not make predictions and conclusions about time in regard to Specific tasks versus General tasks. This is due to the limitation of collecting time as overall task completion time for each treatment instead of separate time collection for Specific and General tasks within each treatment.
For accuracy analysis: first, accuracy was higher than expected, which indicates that the questions were easier than anticipated. Second, in the Interactive session the majority of participants did not feel the need to play the full animation and were too excited to play and stop several times which might have made their perception of the general overview poor and fragmented. Third, the Non-Interactive session participants felt more confident answering general questions and less confident answering specific questions unless they play the animation several times. This resulted in guessing the answers most of the time.
In general, results from the study showed that interactive animation was effective for identifying moving clusters, trends and general data analysis in terms of accuracy. Interactivity added confidence as well as made it easier and more accurate to perceive details with the ability to play and stop as needed. This finding supports Tversky et al.’s [12] argument about interactivity being the solution for animation drawbacks.
In conclusion, interactive animation of trend visualizations proved to be an effective technique for exploratory data analysis and was significantly more accurate than animation alone, specially for detailed analyses. With these findings we aim to support the use of interactive animation visualizations as an effective and powerful technique for exploratory data analysis. We also aim to partially alleviate the dispute on whether or not animation is effective for data analysis as well as whether or not we need interactivity to make animation effective. Hence this study fills a small gap; there is still need to conduct more research in this area.
For future work, we would like to extend this work to include static representation that is comparable. Also we would like to design the visualization and include the different representation in an automated framework for running the experiment.
ACKNOWLEGMENTS
Special thanks to Liaqat Ali who provided assistance with the statistical analysis. Also many thanks for the people who devoted time for the pilot study and gave me great feedback including Chao Feng, Samar Al-Hajj and Mina Soltangheis.
REFRENCES
[1] L. Bartram, “Perceptual and interpretative properties of motion for information visualization,” in Proceedings of the 1997 workshop on New paradigms in information visualization and manipulation, pp. 3–7 (1997).
[2] “Gapminder: Unveiling the beauty of statistics for a fact based world view. - Gapminder.org,” <http://www.gapminder.org/> (20 July 2012).
[3] B. B. Bederson and A. Boltman, “Does animation help users build mental maps of spatial information?,” in
Information Visualization, 1999.(Info Vis’ 99) Proceedings. 1999 IEEE Symposium on, pp. 28–35 (1999).
[4] J. Heer and G. G. Robertson, “Animated transitions in statistical data graphics,” Visualization and Computer Graphics, IEEE Transactions on 13(6), 1240–1247 (2007).
[5] G. G. Robertson, J. D. Mackinlay, and S. K. Card, “Cone trees: animated 3D visualizations of hierarchical information,” in Proc. of the SIGCHI Conference on Human factors in computing systems: Reaching through technology 189, p. 194 (1991).
[6] G. Robertson, K. Cameron, M. Czerwinski, and D. Robbins, “Animated Visualization of Multiple Intersecting Hierarchies,” Information Visualization 1(1), 50–65 (2002) [doi:10.1057/palgrave.ivs.9500002].
[7] D. E. Zongker and D. H. Salesin, “On creating animated presentations,” in Proc. Eurographics/SIGGRAPH Symp. on Comp. Animation, pp. 298–308 (2003).
[8] K. Nakakoji, A. Takashima, and Y. Yamamoto, “Cognitive effects of animated visualization in exploratory visual data analysis,” in Information Visualisation, 2001. Proceedings. Fifth International Conference on, pp. 77–84 (2001).
[9] A. L. Griffin, A. M. MacEachren, F. Hardisty, E. Steiner, and B. Li, “A comparison of animated maps with static small-multiple maps for visually identifying space-time clusters,” Annals of the Association of American Geographers 96(4), 740–753 (2006).
[10] L. R. Bartram, “Enhancing information visualization with motion,” Simon Fraser University (2001). [11] C. Ware, Information Visualization : Perception for Design, Morgan Kaufman (2004).
[12] B. Tversky, J. B. Morrison, and M. Betrancourt, “Animation: can it facilitate?” International journal of human-computer studies 57(4), 247–262 (2002).
[13] D. Archambault, H. Purchase, and B. Pinaud, “Animation, small multiples, and the effect of mental map preservation in dynamic graphs,” Visualization and Computer Graphics, IEEE Transactions on(99), 1–1 (2011). [14] G. Robertson, R. Fernandez, D. Fisher, B. Lee, and J. Stasko, “Effectiveness of animation in trend visualization,”
Visualization and Computer Graphics, IEEE Transactions on 14(6), 1325–1332 (2008).
[15] J. B. Morrison, B. Tversky, and M. Betrancourt, “Animation: Does it facilitate learning,” in AAAI spring symposium on smart graphics, pp. 53–59 (2000).