Earthquake Risk Assessment
Study
Part 1 - Review of Risk Assessment
Methodologies and Development of a
Draft Risk Assessment Methodology
for Christchurch
Earthquake Risk Assessment Study
Part 1 - Review of Risk Assessment
Methodologies and Development of a Draft Risk
Assessment Methodology for Christchurch
Report No. U04 / 108 : Final
Prepared by Opus International Consultants Limited Wellington Office
P. Brabhaharan, Robert Davey, Level 9, Majestic Centre
100 Willis Street, PO Box 12-003 Francis O’Riley, and Leonard Wiles Wellington, New Zealand
Reviewed by Telephone: +64 4 471 7000 Facsimile: +64 4 471 1397 Dr David Prentice Report No SPT 2004 / 28 Date: August 2005 Reference: 5C0542.00 Status: Final
This document is the property of Opus International Consultants Limited. Any unauthorised employment or reproduction, in full or part is forbidden.
Disclaimer
Opus has used the best available information in preparing this report and has interpreted this information exercising all reasonable skill and care. Nevertheless, neither Environment Canterbury nor Opus accepts any liability, whether direct, indirect or consequential, arising out of the provision of information in this report.
© All rights reserved. This publication may not be reproduced or copied in any form without the permission of Environment Canterbury (the client). Such permission is to be given only in accordance with the terms of the
Contents
Executive Summary... iii
1 Introduction...1
2 Scope of Study ...2
3 Key Components of Earthquake Risk Assessment and Applications...3
3.1 Objectives ...3 3.2 Risk Assessment...3 3.3 Socio-economic Consequences...5 3.4 Outcomes ...5 3.5 Applications...6 4 Literature Review...7 4.1 Scope of Review ...7
4.2 General Earthquake Risk Assessment ...7
4.3 Earthquake Hazards...13
4.4 Damage and Loss Modelling ...15
4.5 Earthquake Risk Studies Undertaken for Christchurch and Canterbury...24
4.6 Summary of Literature Review...25
5 Inventory Data ...27
5.1 General Approach...27
5.2 Buildings ...27
5.3 Roads ...29
5.4 Water Supply Networks ...30
5.5 Telecommunications Assets ...30
5.6 Electricity Assets ...31
5.7 Demographic Information...33
5.8 Geographical Information Systems Data Format...33
5.9 Summary of Asset Inventory Data ...33
6 Earthquake Hazard Information Review ...35
6.1 Introduction ...35
6.2 Earthquake Hazard Literature ...35
6.3 Discussion of Hazard Information ...43
6.4 Additional Hazard Information ...43
7 Development of Risk Assessment Methodology for Christchurch ...45
7.2 Risk Assessment Context...45
7.3 Scenario and Probabilistic Approaches ...46
7.4 Spatial Assessment Approach...47
7.5 Modelling Uncertainty...47
7.6 Risk Assessment Model ...48
7.7 Risk Assessment Outputs ...56
8 Conclusions ...58
9 Recommendations...60
10 Bibliography ...63
List of Appendices
Appendix A Mesh Blocks and Statistical Area Units for Christchurch Appendix B Example Risk Assessment Outputs for Lifelines
Executive Summary
Environment Canterbury (ECan) needs to know the likely impact and consequences of a major earthquake on Christchurch, to fulfil its hazard mitigation and emergency management functions. Opus International Consultants Limited (Opus) was commissioned by ECan to review risk assessment methodologies and develop a draft risk assessment methodology for Christchurch.
A comprehensive review of literature relating to earthquake risk assessment has been completed. Key features of significant relevant literature are presented.
Sources of asset data for the study have been explored by contacting the relevant Councils and organisations. This indicates that the information required for the risk assessment is generally available. The inventory would be collected from a variety of organisations, and would include information on critical facilities.
There is good hazard information available from previous research and studies. Some additional microzoning information would need to be derived, including a map showing ground class to modify ground shaking, liquefaction ground damage hazards for the earthquake scenarios, and slope hazards for the Port Hills. These can be incorporated into the risk assessment. The tsunami risk could be considered in a separate study.
A spatial approach should be used for the risk assessment using a geographical information system (GIS) platform, and the results of the study be presented as maps and accompanying tables and charts, so that the information can be readily used by stakeholders.
A methodology has been developed to undertake an earthquake risk assessment for Christchurch. The approach has been based on generating risk information that meets the objectives of Environment Canterbury and provides a basis for organisations to undertake risk management actions.
It is proposed that the risk assessment be carried out for four earthquake scenarios, rather than using probabilistic uniform hazard levels. This would provide information most suitable for emergency management and meeting functionality requirements for lifelines. Risk assessment has considerable uncertainty and loss estimates could be derived using probability distributions so that the uncertainty is explicitly presented. The risk assessed should focus on direct losses. The socio-economic consequences may be considered later in follow-on studies.
1
Introduction
Environment Canterbury (ECan) needs to know the likely impact and consequences of a major earthquake on Christchurch, to fulfil its hazard mitigation and emergency management functions. ECan considers that the earthquake hazard information currently available is generally of a standard and scale suitable for an earthquake risk assessment. The Resource Management Act 1991 (RMA) and more recently the Civil Defence Emergency Management Act 2002 require local authorities to identify, assess and mitigate the effects of natural hazards and other technological hazards. An assessment of the risk from earthquakes to Christchurch will assist with the management of the risk, through reduction, readiness, response and recovery planning.
Opus International Consultants Limited (Opus) has been commissioned by ECan to review risk assessment methodologies and develop a draft risk assessment methodology for Christchurch as part of the Earthquake Risk Assessment Study: Part 1.
This report presents the results of this study, and recommends a methodology for use in carrying out a risk assessment for Christchurch.
2
Scope of Study
The scope of the study required by ECan comprises the following steps:
1. Describe in detail the key components of earthquake risk assessment methodologies, and in particular the outputs and their applications.
2. Review in detail the available literature on (any) specific earthquake risk assessments carried out for Canterbury and/or Christchurch, and methodologies and approaches developed in New Zealand and internationally for assessing earthquake risk.
This review will include:
(a) A description of the approach used to complete the literature review.
(b) A full bibliographic reference for each report, paper, map or other publication reviewed.
(c) Details of where each report, paper, map or other publication can be obtained. (d) A detailed summary of the relevant details of each report, paper, map or
publication.
(e) A discussion on the implications of the literature review findings for the development of an earthquake risk assessment model for Christchurch.
3. Investigate the source, availability and nature of building (residential, industrial and commercial), engineering lifeline infrastructure (water supply, telecommunications, electricity distribution and roading only) and demographic information for Christchurch, and provide a summary of the information in the report.
4. Investigate the source, availability and nature of earthquake hazard information for Canterbury and Christchurch, and provide a summary of the information in the report.
5. Identify (if appropriate), the need for, and nature of, any additional earthquake hazard information and/or investigations for the purpose of better assessing the earthquake risk in Christchurch.
6. Based on the literature review findings and the nature of the existing earthquake hazard information available for Canterbury and Christchurch, and the existing available building, engineering lifeline infrastructure and demographic information, develop a draft risk assessment methodology for Christchurch.
ECan required that this study include the lifelines of water supply, telecommunications, electricity distribution and roading only. However, this may be extended to include other key lifelines in the city such as wastewater, ports and rail infrastructure.
3
Key Components of Earthquake Risk Assessment and Applications
3.1 Objectives
Risk may be defined as the chance of something happening that will have an impact upon objectives. It is measured in terms of consequences and likelihood [AS/NZS 4360:2004]. The objective of an earthquake risk assessment is to quantify the potential damages and losses due to future earthquakes (the consequences) and their probabilities of occurrence in a given period (the likelihood).
3.2 Risk Assessment
The basic steps in an earthquake risk assessment are:
Hazard Analysis: Identification of earthquake sources.
Modelling of the occurrence of earthquakes from these sources. Estimation of the attenuation of earthquake motions between these sources and the study area.
Evaluation of the site effects of soil amplification, liquefaction, landslide and surface fault rupture.
Inventory Collection: Identification of infrastructure (buildings and lifelines) that are exposed to damage.
Classification of the buildings and lifelines according to their vulnerability to damage.
Classification of the occupancy of the buildings and facilities.
Damage Modelling : Modelling of the performance of the inventory classes under earthquake shaking and consequent effects such as ground damage. Development of damage functions (relationship between levels of damage and corresponding levels of shaking).
Estimation of the damage to the inventory from the earthquake motion at the inventory locations.
Estimation of the damage caused by post earthquake fires.
Loss Estimation : Estimation of direct losses due to damage repair costs.
These steps are illustrated in Figure 1.
Figure 1 - Basic Steps in Earthquake Risk Assessment
[King and Kiremidjian, 1994]
The regional risk assessment process is further illustrated in Figure 2, and the risk assessment process with the aid of a Geographical Information System (GIS) is illustrated in Figure 3.
3.3 Socio-economic Consequences
The social and economic consequences of earthquake damage are also important. However, the assessment of the social and economic effects is more complex and there isn’t a well defined process to assess these outcomes. Usually these have been assessed as a multiplier of the direct losses to indicate an order of magnitude of such losses.
A number of researchers have considered the economic impact of earthquakes (Cochrane, 1995). More research is continuing to assess such effects. For example, Gordon et al (1997) outlined a framework for assessing the total economic impact from the effect of earthquakes on transportation (bridges only considered), using input/output models. They included changes in traffic demand after the earthquake. However, the practical use of this model for risk assessment of a road network was not demonstrated (Brabhaharan et al, 2001). The Multi-disciplinary Center for Earthquake Engineering Research (MCEER) in the USA has an objective to develop a model for assessing the economic effects of damage to transportation networks.
Research into the social impacts of earthquakes is currently being carried out by Opus International Consultants, under a 4 year research programme.
It would be prudent to consider assessment of the socio economic effects of earthquakes as a future extension of the earthquake risk assessment.
3.4 Outcomes
The primary outcomes of a risk study are summaries and maps highlighting the spatial distribution of damage and casualties. A typical summary for an asset would include an overall damage rating, the number of casualties, the number of people affected by the damage, timeframe for basic reinstatement and likely repair costs.
Key assets covered by the summaries include:
Commercial, industrial and residential buildings;
Critical facilities including hospitals, police stations and fire stations; Lifelines, including:
Electrical and communication lifelines including substations, telephone
exchanges, underground and overhead lines;
Roading network including bridges;
Water assets including reservoirs, pump stations and key water mains.
For lifelines, the consequential effects (such as availability / disruption to road users) would also be assessed.
3.5 Applications
The outcomes from a risk assessment study have many applications. Such applications may include:
Consider the impact of earthquakes and development of appropriate policy on earthquake risk reduction initiatives (for example Earthquake Risk Buildings Policy development);
Earthquake risk reduction initiatives through a detailed understanding of the extent and distribution of damage, critical elements and redundancies;
Prioritisation and justification for founding of earthquake risk, based on a detailed understanding of the damage and consequences;
Understand and act on the interdependencies and relationships between various lifelines and emergency response and recovery;
Emergency response planning by the Civil Defence Emergency Management Groups and Civil Defence Personnel;
Understand the post-earthquake recovery resources requirements based on the understanding of the extent of damage to buildings and other infrastructure (including lifelines). Such a study was carried out for the Wellington Region and the results were published in a number of papers presented in “Wellington After the ‘Quake – The Challenge of Rebuilding Cities” (Earthquake Commission, 1995).
An earthquake risk assessment for the Greater Wellington Area was undertaken by Works Consultancy Services (1995) for the Wellington Regional Council. This study has been used extensively in the understanding of the risks to the region, earthquake risk policy development, and planning for emergency preparedness. As illustrated above, it has also provided the basis for understanding the resource requirements for recovery after large events.
An application of comprehensive assessment of the risk to lifelines, is the risk assessment of key roads in the Wellington City Road network and development of risk management strategy undertaken by Opus International Consultants for Wellington City Council (Brabhaharan, 2004), and this has provided the framework for prioritising, funding and implementation of key vulnerable roads in the Wellington City, starting with Ngaio Gorge Road.
This illustrates the usefulness of the results of earthquake risk assessment studies for earthquake preparedness planning and for developing strategies to minimise the risk from earthquakes.
4
Literature Review
4.1 Scope of Review
A review has been undertaken of New Zealand and international literature on earthquake risk assessment and of specific earthquake risk assessments carried out for Canterbury or Christchurch. This literature review has involved:
1. A review and collation of earthquake hazard and risk reports held by ECan;
2. A search of library databases by Opus’ Information Centre;
3. Sourcing of literature from various sources;
4. Review of information collated.
Search of relevant information for the study was carried out Opus’ Information Centre, which has access to a variety of databases and search facilities which allowed it to search a variety of papers and reports in journals, conference proceedings, research publications and studies.
The seminal paper “Engineering seismic risk analysis” by Cornell [1986], set the scene for the considerable advances that have been made in earthquake risk assessment over the past two decades. Many thousands of papers and other publications have been published on the subject since that time. This review has therefore been limited to those publications that are particularly relevant to a regional earthquake risk assessment as proposed for Christchurch.
The review is structured as follows:
General Earthquake Risk Assessment.
Earthquake Hazards.
Damage and Loss Modelling.
Earthquake Risk Studies undertaken for Christchurch and Canterbury.
4.2 General Earthquake Risk Assessment
King SA and Kiremidjian, A (1994). Regional seismic hazard and risk analysis through geographic information systems.
This report describes the development of a geographic information system (GIS) based methodology for a regional seismic hazard and risk analysis, and illustrates this with a case study. It is particularly useful as it provides a good framework for a GIS based risk assessment.
A flow chart of the basic procedure that was developed for this risk assessment is shown in Figure 2.
Figure 2 - Flowchart Showing the Basic Regional Risk Assessment Process [King and Kiremidjian. 1994]
The data and models that are the fundamental building blocks of regional risk assessments referred to in Figure 2 are:
Models
Seismicity
Bedrock motion (attenuation)
Local site effects (amplification, liquefaction)
Motion-damage (fragility)
Repair cost
Loss of use (repair time)
Inventory Data
Facility (building, lifelines) structural characteristics
Facility occupancy characteristics
Regional population distribution
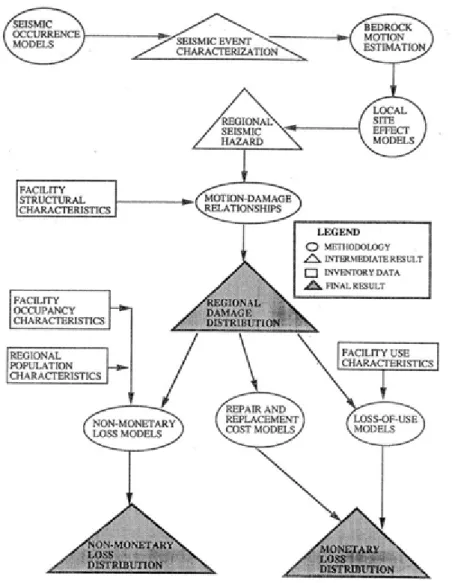
The GIS mapping process for the seismic risk analysis is illustrated in Figure 3.
Figure 3 - GIS Mapping Process for Regional Seismic Risk analysis [King and Kiremidjian, 1994]
Maps representing regional geological and geographical data are overlaid and their attributes are combined to produce intermediate maps of regional seismic hazards. These hazard maps are then overlaid and combined with structural inventory maps to produce maps predicting regional damage distributions. Combining the map of damage distributions with a map of population distributions for the area results in final estimates of direct loss (damage repair costs, etc), indirect loss (business interruption costs, etc) and casualties.
FEMA (2001). Earthquake loss estimation methodology, HAZUS99.
HAZUS is a comprehensive earthquake loss estimation methodology that was developed for the US Federal Emergency Management Agency (FEMA). It is designed for use by state, regional and local governments in planning for earthquake loss mitigation, emergency preparedness planning and response and recovery.
Use of the methodology will generate an estimate of the consequences to a city or region of a "scenario earthquake", i.e., an earthquake with a specified magnitude and location. The resulting "loss estimate" generally will describe the scale and extent of damage and disruption that may result from a potential earthquake. The following information can be obtained:
Quantitative estimates of losses in terms of direct costs for repair and replacement of damaged buildings and lifeline system components; direct costs associated with loss of function (e.g., loss of business revenue, relocation costs); casualties; people displaced from residences; quantity of debris; and regional economic impacts.
Functionality losses in terms of loss-of-function and restoration times for critical facilities such as hospitals, and components of transportation and utility lifeline systems and simplified analyses of loss-of-system-function for electrical distribution and potable water systems.
Extent of induced hazards in terms of fire ignitions and fire spread, exposed population and building value due to potential flooding and locations of hazardous materials. To generate this information, the methodology includes:
Classification systems used in assembling inventory and compiling information on the
building stock, the components of highway and utility lifelines, and demographic and economic data.
Methods for evaluating damage and calculating various losses.
Databases containing information used as default (built-in) data that are useable in the
calculation of losses.
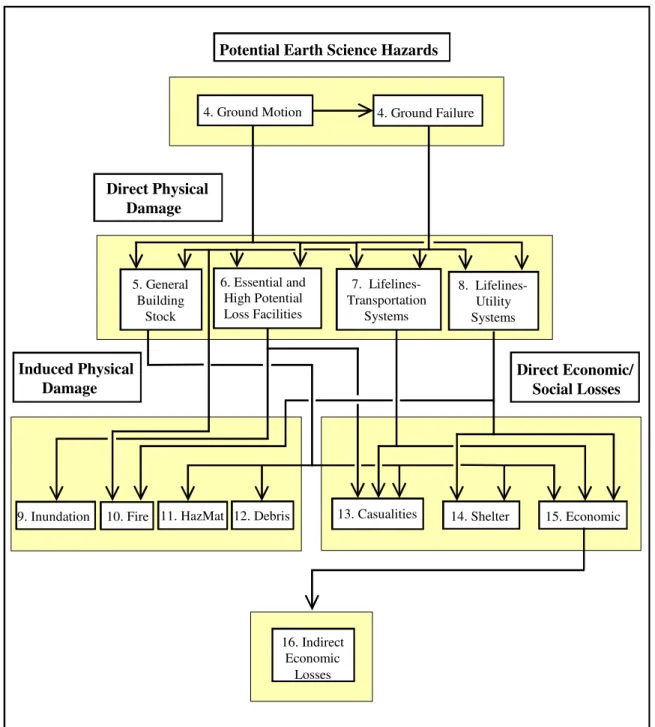
A flow chart illustrating this methodology is shown in Figure 4.
These systems, methods, and data have been coded into user-friendly software based on a GIS platform. GIS technology facilitates the manipulation of data on building stock, population, and the regional economy. The software can be run under two different GIS platforms, MapInfo and ArcView. The software makes use of GIS technology for displaying and manipulating inventory, and permits losses and consequences to be portrayed on both spreadsheets and maps.
Collecting the required information and entering it in an analysis program are the major tasks involved in generating a loss estimate. The HAZUS methodology permits estimates to be made at several levels of sophistication, based on the level of data input into the analysis (i.e., default data versus locally enhanced data). The better and more complete the inventory information, the more meaningful the results.
A new version of the software, HAZUS-MH (i.e. HAZUS Multi-Hazard), includes losses from floods and hurricane winds as well as earthquakes.
8. Lifelines-Utility Systems 4. Ground Motion 4. Ground Failure
Direct Physical Damage 6. Essential and High Potential Loss Facilities 12. Debris
10. Fire 14. Shelter 15. Economic
9. Inundation 11. HazMat
16. Indirect Economic
Losses
Potential Earth Science Hazards
Direct Economic/ Social Losses Induced Physical Damage 7. Lifelines-Transportation Systems 5. General Building Stock 13. Casualities
Figure 4 - Flow Chart of the HAZUS Loss Estimation Methodology
Most of the models that form the basis of the HAZUS methodology are documented in detail in the HAZUS Technical Manual, which is freely available from the FEMA website (http://www.fema.gov/hazus). These models can therefore be adopted and adapted for use in other methodologies. The GIS based HAZUS software is also freely available, but it can only be used for the geographical regions that the software has been customised for, i.e. the US and a few other countries. The HAZUS software has not been customised for New Zealand.
In a simplified form, the steps in applying the methodology are:
Select the area to be studied. This may be a city, a county or a group of municipalities. It is generally desirable to select an area that is under the jurisdiction of an existing regional planning group.
Specify the magnitude and location of the scenario earthquake. In developing the scenario earthquake, consideration should be given to the potential fault locations. Provide additional information describing local soil and geological conditions, if
available.
Using formulas embedded in HAZUS, probability distributions are computed for
damage to different classes of buildings, facilities, and lifeline system components and loss-of-function estimates are made.
The damage and functionality information is used to compute estimates of direct economic loss, casualties and shelter needs. In addition, the indirect economic impacts on the regional economy are estimated for the years following the earthquake.
An estimate of the number of ignitions and the extent of fire spread is computed. The
amount and type of debris is estimated. If an inundation map is provided, exposure to flooding can also be estimated.
The user plays a major role in selecting the scope and nature of the output of a loss estimation study. A variety of maps can be generated for visualising the extent of the losses. Numerical results may be examined at the level of the “census tract” (equivalent to statistical area unit / mesh block in New Zealand) or may be aggregated by county or region.
McGuire, RK (2004). Seismic Hazard and Risk Analysis.
McGuire is one of the pioneers of seismic risk analysis, and his monograph provides a general introduction to methods of seismic hazard and risk analysis. He pays particular attention to one of the most important aspects of seismic risk analysis, that is, how to deal with the associated large uncertainties. There are two types of uncertainty:
1. Aleatory (or random) uncertainty: uncertainty that is inherent in a random phenomenon and cannot be reduced by acquiring additional data: Examples include future earthquake locations, future earthquake magnitudes, ground motions at a site given the median value, damage state for a class of buildings given the median value.
2. Epistemic (or knowledge) uncertainty: the uncertainty that stems from lack of knowledge about some model or parameter. This type of uncertainty can be reduced (at least conceptually) by additional data. Examples include maximum magnitude for a source, median value of ground motion given the source properties, median damage state for a class of buildings given the ground motion.
McGuire describes risk analysis methodologies that include allowance for uncertainty based on probability theory. The probabilistic seismic hazard assessment (PSHA) method is described, along with methods to convert seismic hazard into seismic risk or loss.
4.3 Earthquake Hazards
4.3.1 General Approaches
Reiter, Leon (1990). Earthquake Hazard Analysis.
Reiter provides an introduction to the subject of identification of earthquake sources and modelling of the occurrence of earthquakes on these sources.
Models for the occurrence of future earthquakes are based on historical seismicity, crustal geology and tectonic processes. There are two sources of earthquake:
1. Area sources are geographical areas within which an earthquake of a given magnitude
is equally likely to occur at any time or location, where the local geological features that cause the earthquakes have not been identified.
2. Fault sources are usually individual faults where the tectonic and geological features causing earthquakes have been identified.
4.3.2 New Zealand Data
Active fault and historic earthquake data for New Zealand are available in the following databases.
Environment Canterbury Active Faults Database
http://www.ecan.govt.nz/EcanGIS/ecanpro/viewer.htm
The Environment Canterbury database keeps an up to date record of the active faults in the Canterbury Region.
Active Faults Database of New Zealand.
http://www.gns.cri.nz/store/databases/indexb.html#Faults
The Active Faults Database of New Zealand is maintained by the Institute of Geological and Nuclear Sciences. It has been designed to hold all data collected from investigations of active faults. Along with the locations of active faults, the Active Faults Database contains the results from field measurements of offset features, trenching, and dating. It also stores interpretation of these results in the form of the fault recurrence interval, slip rate, single event displacement and date of last movement.
The National Earthquake Information Database is maintained by the Institute of Geological and Nuclear Sciences. It contains summary information of New Zealand earthquakes including epicentres, depths, magnitudes, and “felt” information for more than 160,000 earthquakes. This includes pre-instrumental shocks, but not all information is available for all events. The database also contains over 1,000,000 analogue and digital seismograms recorded by the short-period National Seismograph Network, of which the digital archive is held on-line.
Institute of Geological & Nuclear Sciences (2000). Probabilistic Seismic Hazard Assessment of New Zealand: New Active Fault Data, Seismicity Data, Attenuation Relationships and Methods
This report provides details of the fault sources and area sources that were used for a probabilistic seismic hazard analysis (PSHA) for New Zealand.
Seismological Society of America (1997). Seismological Research Letters, No. 68.
Attenuation relationships are used to calculate the ground shaking at a site given the earthquake location and magnitude. They are derived from recorded earthquake ground motions. This publication provides a good state-of-the-art summary of the development of these relationships.
McVerry GH, et al. (2000). Crustal and Subduction Zone Attenuation Relations for New Zealand Earthquakes.
McVerry et al developed attenuation relationships from a dataset of New Zealand earthquake records, supplemented by overseas data. The attenuation model takes account of different tectonic types of earthquake (crustal and subduction zone) and their range of depths. The attenuation expressions for crustal earthquakes have further subdivisions for different types of fault rupture (strike-slip, normal, oblique reverse and reverse). The model takes account of site soil amplification through a range of site soil classes. The ground motions are given in terms of peak ground acceleration (PGA) and spectral acceleration.
Dowrick D.J., Rhoades D.A. (1999). Attenuation of Modified Mercalli Intensity in New Zealand Earthquakes.
Dowrick and Rhoades developed Modified Mercalli (MM) intensity attenuation relationships from observed intensities in New Zealand earthquakes. The MM intensity (MMI) scale measures the earthquake effects at a site in terms of the effect it has on the natural and built environment. The advantage of using the MMI scale as a measure of earthquake intensity is that there is more historical earthquake consequence data available that is correlated to MMI than there is to peak ground accelerations (PGA).
4.4 Damage and Loss Modelling 4.4.1 General
Rojahn, C and Sharpe, R L (1985). Earthquake Damage Evaluation Data for California, ATC-13.
In the mid-1980s, the US Federal Emergency Management Agency (FEMA) undertook a comprehensive programme to estimate the economic impacts of a major California earthquake. This included estimates of damages to all types of facilities, the associated losses and casualties. Because the required earthquake damage and loss data were not available in the literature, FEMA and Applied Technology Council (ATC) agreed that the best way to develop the required data was to draw on the experience and judgement of seasoned earthquake engineers. Accordingly a panel of senior level specialists in earthquake engineering was established to develop consensus damage and loss estimates. The expert panel estimated the probability of damage to a range of structure types. The standard damage descriptions used and the associated “damage factors” are shown in Table 1. The damage factor (also commonly known as damage ratio) is the ratio of the cost of repairing the damage to cost of replacing the structure.
Table 1 - ATC-13 Damage States and Damage Factors (Rojahn and Sharpe, 1985)
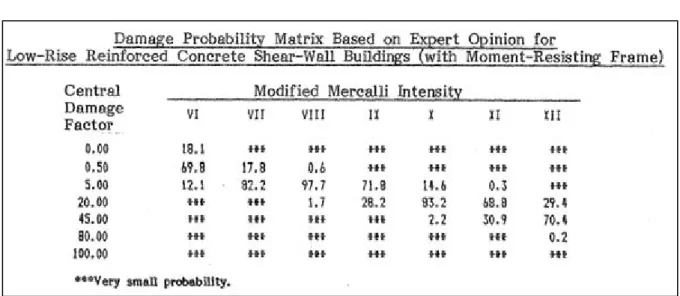
The outputs of the ATC-13 study included damage probability matrices, an example of which is shown in Table 2. By using such matrices, it is possible to estimate the probability of a structure being in a particular damage state for a given MMI ground shaking intensity, and to estimate the expected dollar loss by multiplying the damage factors for the structure by the estimated replacement value.
Estimates were also made of the repair times for given damage states, and number of casualties for given damage states and occupancy rates.
The data produced by this project remains the most comprehensive source of damage data, and form the basis of many subsequent loss studies and methodologies.
Table 2 - ATC-13 Damage Probability Matrix
FEMA (2001). Earthquake loss estimation methodology, HAZUS99
Damage models are provided in HAZUS for the full range of building types and other infrastructure.
In HAZUS, damage models are in the form of lognormal “fragility curves” that relate the probability of being in, or exceeding, a damage state for a given earthquake demand parameter (e.g., response spectrum displacement, PGA).
Northridge Earthquake Losses
Studies have been carried out by Mary Comerio and others on loss ratios from the Northridge earthquake 1994 in California, USA. Some of these results may be of relevance to risk assessment for buildings in Christchurch. These studies also considered contents losses, and are based on insurance claims.
In considering these results for New Zealand, care should be taken to recognise differences in insurance industry and the types of buildings.
4.4.2 Buildings and Casualties HAZUS
Figure 5 provides an example of building fragility curves for the four damage states used in the HAZUS methodology. These have been derived by analysing the earthquake response of model building types.
Descriptions of structural and non-structural damage states are provided for all of the model building types in HAZUS. Examples for one building type (reinforced concrete moment resisting frames) are given below :
Slight Structural Damage : Flexural or shear type hairline cracks in some beams and columns near joints or within joints.
Moderate Structural Damage : Most beams and columns exhibit hairline cracks. In ductile frames some of the frame elements have reached yield capacity indicated by larger flexural cracks and some concrete spalling. Non-ductile frames may exhibit larger shear cracks and spalling.
Extensive Structural Damage : Some of the frame elements have reached their ultimate capacity indicated in ductile frames by large flexural cracks, spalled concrete and buckled main reinforcement; non-ductile frame elements may have suffered shear failures or bond failures at reinforcement splices, or broken ties or buckled main reinforcement in columns which may result in partial collapse.
Complete Structural Damage : Structure has collapsed or is in imminent danger of collapse due to brittle failure of non-ductile frame elements or loss of frame stability. Approximately 20% (low-rise), 15% ( mid-rise) or 10% (high-rise) of the total area of the building with complete damage is expected to have collapsed.
The estimated damage (i.e., damage state for model building type for a given level of ground shaking) is used in conjunction with other models that are provided in the methodology to estimate :
1. casualties due to structural damage, including fatalities;
2. monetary losses due to building damage (i.e. cost of repairing or replacing damaged buildings and their contents);
3. monetary losses resulting from building damage and closure (e.g., losses due to business interruption);
4. social impacts (e.g., loss of shelter); and
5. other economic and social impacts.
The building damage predictions may also be used to study expected damage patterns in a given region for different scenario earthquakes (e.g., to identify the most vulnerable building types, or the areas expected to have the most damaged buildings).
Dowrick, et al. Various
Dowrick and his colleagues have analysed insurance claim records for the 1931 Hawkes Bay, 1942 Wairarapa, 1986 Inangahua and 1987 Edgecumbe earthquakes in New Zealand. They have used the data to calculate the “damage ratio” as a function of MM intensity for a range of building types and ground conditions. The damage ratio is the cost of damage to a building divided by the replacement value of the building.
The data from these studies are very important as they provide the most robust empirically derived information from New Zealand data, as opposed to expert opinion (eg ATC-13) or theoretically (eg HAZUS) derived damage or loss models. However, the range of building types covered by the data is limited.
Works Consultancy Services (1995). Earthquake Risk Assessment Studies
Opus International Consultants (Works Consultancy Services, 1995) assessed the damage and losses to buildings in the Wellington Region, and estimated deaths and injuries, for selected earthquake scenarios. The methodology that was developed for the studies was in accordance with the state-of-the-art of the time including the forerunner of HAZUS (NIBS, 1994).
The geographic models for the studies were built up from Valuation Roll Number areas. The analyses were done with spreadsheets, not GIS.
The building damage models were specifically developed for New Zealand construction types, based on data from Dowrick, ATC-13 and other sources. The number of buildings, their floor areas and construction types were supplied by Quotable Value (QV) New Zealand (Valuation New Zealand). Replacement costs were calculated from construction
cost rates. “Drive past” surveys were undertaken in a sample of suburbs to supplement the QV construction type data. Damages from fire following earthquake were included.
Population data used as a basis of the casualty estimates were obtained from Department of Statistics census data. From this data, it was possible to directly calculate the night-time population in each roll area and the daytime population, for over 15 years old, in each area. The under 15years old population was estimated from consideration of the school populations.
A table of casualty rates versus building construction type and damage state was developed from NIBS (1994) and University of Cambridge data (Spence, 1994), for estimating injuries, deaths and entrapments.
The outputs of the studies were:
Numbers of buildings in each damage state (none, light, moderate, extensive,
complete).
Costs of repairing earthquake damage to buildings.
Expected damage to critical facilities (hospitals, police stations, fire stations, CDHQ).
Number of casualties.
Maps showing the geographical distribution of these damages and losses.
The results of these studies have been used extensively, and in particular for earthquake preparedness planning.
One limitation with the methodology used is that it produced nominally “mean” estimates of damage and losses, with only a general indication given of the likely variation from the mean in any particular event due to uncertainty.
EQC Minerva Model
The Earthquake Commission (EQC) had a computer model developed, to allow it to predict and plan for insurance losses for the portfolio of assets covered by the EQC scheme. The EQC model is known as “Minerva”, and combines a geographical information system, a hazard model and a dynamic financial analysis model (Middleton, 2002). An outline of the insurance loss model is given by Shephard et al (2002). The model uses an approach similar to that shown on Figure 1, and uses the Quotable Value Database, EQC Building Costs Database and an Aon Soils Database. The earthquake loss system derives losses based on earthquake sources, a variety of attenuation models, and building damage vulnerability models (comprising loss tables for different building types and earthquake intensities and statistical distribution of loss). It should be noted that this primarily covers residential buildings in New Zealand which are covered by EQC.
Estimating Risks from Fire Following Earthquake (2002)
The New Zealand Fire Service commissioned GNS to investigate the risk of post earthquake fires. A GIS model containing property and valuation data for Wellington was shown to be a useful platform for modelling the spread of post-earthquake fire in the urban setting. Two approaches were investigated, one static and one dynamic. The static approach relied on a simple buffering technique to define potential “burn-zones” that are sampled randomly to give estimates of losses. Repeated sampling was used to assess the probability of exceedance of various levels of loss as a function of the number of ignitions and the spacing between buildings. The dynamic approach used a cellular automaton technique for determining both the rate and extent of fire spread in response to a wide range of factors including wind, radiation, sparking, branding, and individual separations of buildings.
4.4.3 Lifelines Studies
Lifelines studies have been carried out in a number of cities and regions in New Zealand starting with Wellington, to consider the potential for damage to lifelines in earthquakes and other hazards, and understand the interdependencies. These studies were carried out at a high level to understand the potential damage to lifelines largely based on the expert judgement of engineering professionals, based on their knowledge.
These include studies for :
Wellington (Centre for Advanced Engineering, 1991)
Christchurch (Centre for Advanced Engineering, 1997)
Auckland
Hawkes Bay
Invercargill
These studies nevertheless provided the impetus for further assessment of the risk from earthquakes and other natural hazards, and implementation of mitigation measures.
4.4.4 Water Supply
O’Rourke and Liu (2001)
O’Rourke and Liu have considered the theoretical response of pipelines to ground deformation. However because of the complexities of the ground motions, the soil-pipe interaction and pipeline behaviour, it is not practicable to estimate network damage rates from these analyses.
Damage rates are therefore based primarily on empirical evidence (earthquake damage data), tempered with engineering judgement and sometimes by analytical formulation.
American Lifelines Alliance (2001). Seismic Fragility Formulations for Water Systems
The American Lifelines Alliance has prepared fragility curves for buried pipelines, water tanks, tunnels and canals. These are based in part upon a large volume of earthquake damage data that was assembled for that study. These are the most comprehensive and soundly based models for water systems in particular and pipelines in general.
Data are available from the 1995 Kobe, 1994 Northridge, 1989 Loma Prieta, 1983 Hihonkai-Chubu, 1971 San Fernando and 1906 San Francisco earthquakes principally. Even so there is not a great deal of data available, and even that has inconsistencies in the way that numbers of repairs and the demands (PGV and PGD) were recorded.
Typically damage survey compilations are performed by third parties some time after the water system has been restored. Repair records by field crews are commonly used to ascertain damage counts. Since the main objective of the repair crews is to restore supply as rapidly as possible, documenting damage is of secondary importance. As a result, the damage estimates have some inaccuracies, including omitted repair records, vague damage descriptions, multiple repairs at a single site combined into one record and two visits (e.g. temporary and permanent repair) to one site counted as two repairs. Unfortunately, this inaccuracy is inherent in all damage surveys, is likely to vary significantly from earthquake to earthquake, and is impossible to quantify. These uncertainties need to be kept in mind when interpreting the results of loss analyses based on these data.
The fragility curves developed by the American Lifelines Alliance and others take into consideration the data and lessons from these earthquake events.
Opus International Consultants (2002). Earthquake Loss Assessment for Wellington Region Wholesale Water Pipelines
A probabilistic assessment was made of the financial loss that the Wellington Regional Council is exposed to from damage to its wholesale water supply pipeline network caused by an earthquake on the Wellington Fault.
The damage models for the buried pipe were expressed as a repair rate per unit length of pipe, as a function of wave passage (peak ground velocity) or ground failure (permanent ground deformation). These were derived from the American Lifelines Alliance data (ALA, 2001).
4.4.5 Telecommunications Networks
Schiff AJ (ed)(1998). Proceedings of the Workshop on Performance Criteria for Telecommunication Services Under Earthquake Conditions
These proceedings provide useful data on the earthquake performance of telecommunications networks. They identify several measures to characterise communications systems performance in earthquakes. The performance of the overall
telecommunications network. The workshop also addressed the key issues to help improve earthquake performance.
Work Consultancy Services (1996) Estimated Earthquake Damage to Telecom New Zealand’s Outside Plant
Opus (Works Consultancy Services) estimated the damage to the Telecom New Zealand’s telecommunications network in the Wellington Region. These were based on damage models for buried and pole mounted cables that were developed from earthquake damage data.
The damage assessment for the telecommunication cables were based on the expected ground shaking from earthquakes and more importantly the level of ground damage due to the earthquakes considered. Permanent ground deformation was assessed based on the potential for liquefaction and consequent lateral spreading as well as the potential for fault rupture and earthquake induced slope failures, which were derived from regional hazard maps and consideration of ground conditions in representative sub-areas. This then enabled the assessment of the damage to these assets by developing appropriate fragility relationships.
4.4.6 Road Networks
International literature on road risk assessment was summarised by Brabhaharan et al (2001). Relevant and particularly recent literature are summarised below.
Bridges
The National Institute of Standards and Technology (1992) held a US-Japan workshop in 1991 on earthquake disaster prevention for lifeline systems. The section on transportation lifelines concentrated on bridges, with reports on Caltrans’ seismic retrofit program in the USA (Maroney and Gates, 1992), and the seismic inspection and strengthening program in Japan (Kawashima et al, 1992). There have also been several reports and papers published on bridge seismic screening, prioritisation and retrofit.
Transit New Zealand (1998) published a seismic screening procedure for state highway bridges based on the methodology developed by Opus International Consultants (1998). The bridges along New Zealand’s state highways have been screened systematically, and the bridges were prioritised by Opus for further assessment on the basis of the screening (Opus International Consultants, 2002). Following on from the screening programme, the seismic performance of some bridges has been assessed in further detail.
Basoz and Kiremidjian (1995) proposed a more network based approach to the assessment of bridges and demonstrated the use of Geographical Information Systems (GIS) for bridge prioritisation. The use of GIS has facilitated the combination of seismicity, bridge vulnerability and traffic origin-destination information, to assess the risk. This allowed them to consider the effect of the seismic performance of bridges on the road network (Basoz and Kiremidjian, 1997).
Road Network
Nozaki and Sugita (2000) considered the traffic demand from post-earthquake emergency disaster recovery activities and the potential for damage to network links in assessing the network, using a parameter termed “structural performance index”. They illustrate the use of this model to assess the effectiveness of structural (retrofit) and non-structural (traffic control) measures. Chunguang and Huiying (2000) presented an assessment of the reliability of a road network by considering the probability of damage to various components of the network using a Monte Carlo simulation. They demonstrated the use of this approach in considering the location of emergency service resources, such as ambulances.
Henrickson et al (1980) considered losses to users from earthquake damaged road networks. They assessed a net user benefit or the “value” of the transportation network to users as the difference between the total user benefit and the cost of the trip. The effect of disruption from an earthquake was assessed as a decrease in the total net user benefit. Hence the total loss from the earthquake was assessed as :
total loss = repair or replacement cost + loss in user benefits
This together with a component damage probability matrix (earthquake damaged road link capacity and the associated probability of damage states for different earthquake intensities) was used to derive total cost of earthquake damage. This was then compared with the retrofit cost for that component.
Werner et al (1997) proposed seismic risk analysis of a highway system to estimate the loss from earthquakes. The use of GIS was suggested, with the following four modules :
System module with network and traffic data.
Hazards module with seismicity, topography and soils data.
Component module with structural, functionality and loss / repair cost data.
Socio-economic module with loss, emergency response and societal effects data.
They demonstrated this model using a simplified deterministic analysis for four earthquake scenarios (considering only the ground shaking effects) for a section of the road network in Memphis, Tennessee, USA, and considering only bridges on the road network. MINUTP traffic forecasting software was used to assess traffic impact. Only direct losses (repair cost) and traffic disruption costs were considered.
Gordon et al (1997) outlined a framework for assessing the total economic impact from the effect of earthquakes on transportation (bridges only considered), using input/output models. They included the change in traffic demand after the earthquake.
Augusti et al (1994) described the use of a dynamic programming optimisation procedure to assess the reliability (that is maintaining connection between origin and destination), evaluate optimal intervention (retrofit of bridges) and reduce the seismic risks to highway networks. The method allowed intervention (retrofit) to be distributed for a given amount of total resources, to maximise the reliability.
Opus International Consultants (1999) carried out a risk analysis for Upper Hutt City Council’s rural road network comprising the Akatarawa, Whitemans, Kaitoke and Moonshine Valley areas (Brabhaharan, 2000). A risk management framework was developed for the study based on hazard characterisation, loss estimation and risk-economic analysis with the aid of a GIS based model. The study considered all natural hazards, and characterised and mapped the hazards and the potential impact on the roads. The analysis comprised an assessment of the total economic costs, which were derived as : total economic costs = damage reinstatement costs + traffic disruption costs
The analyses took into consideration the probabilities of various intensities of each hazard. In this instance, earthquake and storm hazards were the dominant hazards, and consequent liquefaction, slope failure, erosion and flooding were also considered.
Dalziell et al (1999) carried out a study of the hazards affecting the road network in the Central North Island of New Zealand. They considered the state highway network in the area, and assessed the risk to the Desert Road section of State Highway 1. Computer aided traffic analysis using a SATURN model was used to consider the impact on traffic using the road network. The study included consideration of volcanic eruption, earthquakes, snow and ice as well as traffic accidents.
Brabhaharan et al (2001) developed a GIS based approach for the assessment of the risk to road networks and a systematic approach for the management of the risk. This was further developed by Brabhaharan & Moynihan (2002) who presented methods of implementation of risk management in the New Zealand context. This approach has been successfully applied to assess the risk to road networks in New Zealand (Brabhaharan, 2002 and 2004). In particular, the application to the Wellington Road Network has enabled the development of systematic risk management and implementation.
The approach developed by Brabhaharan et al (2001) would be a useful approach for assessing the risk to the road network, as it covers the risk to the whole road network, and the results are readily suited to further assessment of risk management.
4.5 Earthquake Risk Studies Undertaken for Christchurch and Canterbury
The Earthquake Hazard in Christchurch (Elder et al, 1991) presented a detailed evaluation of the earthquake hazards in Christchurch, and also included a brief overview of the potential damage that may affect structures, housing, water supply, sewerage reticulation, drainage, transport and energy supply.
Christchurch Seismic Loss Study (Soils & Foundations, 1991) presents an early study of potential earthquake losses for Christchurch, based on the understanding of the earthquake hazard at that time and total building stock values classified into building type from the valuation department. The report estimated an average annual loss of $ 42 Million (in 1989 dollar values) for structural damage to buildings, with losses exceeding $ 1 billion (in 1989 dollar values) for a 200-year return period earthquake.
Canterbury Regional Council Infrastructural Assets Risk Assessment (Institute of Geological & Nuclear Sciences, 1994) reported the seismicity, areas of liquefaction and damage ratios for Canterbury Region, but did not actually provide an estimate of the risk or losses.
Risks & Realities, a report of the Christchurch Engineering Lifelines Group (Centre for Advanced Engineering, 1997) presents a multi-disciplinary approach to the vulnerability of lifelines to natural hazards. It presents a qualitative assessment of the potential damage to drainage, sewer system, water supply, petroleum products, electricity supply, telecommunications, transport and emergency services. It also provides some maps showing the distribution of expected damage. It provides a good overview of potential damage from a variety of hazards, but only in a qualitative manner.
Soils & Foundations (1999) Lower Avon River Lateral Spread, Damage Costs and Mitigation
considered the impact of liquefaction and consequent lateral spread in the Lower Avon River banks on residential properties, damage costs and potential liquefaction mitigation costs. This was an area-specific study confined to a small area of Christchurch.
LAPP Fund : Earthquake Risk to Councils’ Assets in Wellington and Christchurch ( Institute of Geological & Nuclear Sciences , 2002) presents an assessment of the loss to assets owned by the Council only. The fragility models used for the assessment of the loss are not presented in the report.
Institute of Geological & Nuclear Sciences (2003). Review of Effects of Liquefaction Induced Differential Settlements on Residential Dwellings in Christchurch. The report reviews a student report by Kirsti Maria Carr on the potential damage to houses due to liquefaction.
Institute of Geological & Nuclear Sciences (2005). Estimated damage and casualties from earthquakes affecting Christchurch.
4.6 Summary of Literature Review
A review of relevant literature has been searched, sourced and reviewed as part of this project. The focus of the review has been to identify sources of information and techniques that would help develop a methodology for the earthquake risk assessment for Christchurch.
HAZUS provides a general framework for the assessment of the risk from earthquakes, buildings, casualties and lifelines. This framework is applicable for the earthquake risk assessment for Christchurch, with variations to suit the information available for the study.
The available hazard information and the approach for modelling hazards are presented in detail and discussed in Section 6.
Fragility relationships are available from HAZUS, ATC13 as well as data from the research into New Zealand earthquake damage and selected overseas data such as from Northridge. The Wellington study on 1995 still provides a useful example for a risk assessment for the built infrastructure and casualties. The recent research into damage from fire following an earthquake, has been carried out by Victoria University and the Institute of Geological & Nuclear Sciences, and could be useful to better assess the damage from fire.
Lifelines studies across New Zealand, including the Christchurch Study (Centre for Advanced Engineering, 1997) have been high level studies based on expert opinion, and have highlighted the importance of earthquake effects.
The American Lifelines Association fragility relations provide a useful basis for assessment of the damage to water supply pipelines, and recent studies by Opus International Consultants in Wellington provide an example of its application for the New Zealand, and are relevant for the Christchurch study.
Schiff AJ (ed)(1998) provides useful information on the assessment of performance of telecommunication systems, and the Works Consultancy Services (1996) study provides an example of risk assessment to Telecom assets in Wellington.
The HAZUS based assessment of the risk to bridges and the Brabhaharan et al (2001) approach to assessment of the risk to road networks provide a useful basis for road networks, particularly as illustrated by its successful application to the Wellington Road network by Brabhaharan (2004).
Previous risk studies for Christchurch have considered some aspects of damage and loss to the city, but not in a comprehensive manner.
5
Inventory Data
5.1 General Approach
Research into potential sources, availability and nature of data for buildings, engineering lifeline assets and demographic information has been carried out for the Christchurch area. ECan limited the lifeline infrastructure investigations to water, roads, electricity and telecommunications. Other assets such as the rail network, ports and wastewater infrastructure were not investigated but could be included in the earthquake risk study. The research was undertaken by contacting infrastructure managers at the Christchurch City Council (CCC), utility and telecommunications companies. Discussions were also held with people responsible for maintaining and updating information at these organisations.
The information available is predominantly stored in databases, GIS systems, asset management plans and seismic investigation reports. Details of these are included in the sections below.
Another key source of information is the engineering lifelines study for Christchurch that was undertaken in the mid nineties. The results are summarised in the publication “Risks and Realities” (Centre for Advanced Engineering, 1997). This study represents a major collation of lifeline information that was provided by various organisations in a form suitable for risk assessments.
5.2 Buildings
The CCC and commercial organisations such as Quotable Value (QV) hold information on properties and buildings. The council databases have been populated with information from:
Building permits prior to 1992;
Building consent information since 1992;
Property information supplied by the former Government Valuation Department.
Up until 1998, the Government Valuation Department undertook property valuations and maintained detailed records of property information. However since the enactment of the Rating Valuations Act 1998, responsibility for property valuations was transferred to local councils and detailed land and building data held by the Government Valuation Department was transferred to the local councils.
Information is generally available at property level or mesh block level. Mesh blocks are predefined areas that contain information for all properties within the mesh block boundaries. The number of properties within a mesh block can vary from a few up to hundreds of properties. The mesh blocks for Christchurch are shown in Appendix A.
Typical property information that is available from commercial or council databases include :
Residential/commercial/industrial classification;
Building Age (decade of construction);
Wall construction material (wood, brick, concrete etc);
Property use (residential, office, hotel, retail, mixed, storage, education etc);
Numbers of properties;
Land and building valuations.
The three important factors for classifying the earthquake performance of buildings are:
building structure,
age, and
number of storeys.
The age and number of storeys can be readily obtained from commercial or council databases, however the building structure classification (i.e. unreinforced masonry, steel frame, concrete frame) is not generally held on any database. The wall material classification and age of the building can be used to infer the likely building structure with reasonable accuracy. A small random sample of commercial properties could be inspected to verify the validity of the assumptions.
CCC has a register of earthquake risk buildings. The data is stored on a GIS system that is used to prepare LIM reports. The council could supply a spreadsheet file with a property identifier.
Information on seismic upgrades to commercial buildings is not available on the Council databases. Seismic strengthening of earthquake prone buildings will generally improve the structural performance of a building in a seismic event, above the level assessed based on the building classification only.
Access to the CCC database is typically for in-house staff only, and much of the data and GIS information is not available in the public domain. Release of data for the ECan earthquake risk study may require approval by a number of people at the CCC and conditions of use may apply to data that is deemed potentially sensitive in the public domain.
ECan and CCC work closely together on many related projects and regularly exchange information from their databases. Therefore ECan would need to play an active role in assisting the risk study group with obtaining data from CCC through database searches
and GIS layers. Some costs may apply to CCC staff that spend time clarifying information requests and processing data to provide it in a suitable format for risk study use. Some information may already be held by Environment Canterbury, who could provide the data for the study.
Alternatively, property information can be obtained from a commercial organisation, such as QV. QV hold similar information to the council databases (with the exception of the earthquake prone building register). The benefits of using QV are that they will provide the information in a timely manner and reduce the negotiations and approvals necessary to obtain data from the CCC.
5.3 Roads
5.3.1 Local Roads
The road network model can be developed from one of the following two sources:
Topovector data;
RAMM database.
Use of Topovector data requires a software licence. The Topovector data would allow the entire road network in the Christchurch City to be modelled in GIS. The geometry is based on 1:50,000 topographic maps. However, the attributes associated with the data are limited and include such characteristics as the number of road lanes and whether the surface is sealed or unsealed.
RAMM data could be sourced from the CCC. The RAMM data has a mapping layer that can be exported into other GIS systems. The RAMM data contains all attributes that characterise the road including surface width, seal type, traffic volumes and maintenance history.
The RAMM data has several advantages over the Topovector data. One advantage is that the results from the analysis, in the form of GIS layers, can be returned to the council for its own use at a later date, and would be consistent with the data already held by the Council. Another advantage is that the RAMM data contains more attributes that describe the road itself enabling a more robust risk assessment
The RAMM database does not hold any information on bridges, retaining walls and culverts. The majority of data and maintenance history for these structures are in hardcopy format.
Studies into seismic vulnerabilities of bridges have been completed by CCC and would be made available to the risk study group. The detail to which this study has been carried out is not known at this stage. Bridge and retaining wall drawings and specifications would also be available to allow the risk study group to briefly assess and classify the seismic performance if required.
5.3.2 State Highways
State highways 1, 73, 74 and 75 pass through the Christchurch city area. The highways are owned and maintained by Transit New Zealand (Transit).
The RAMM database is used to store information on the highway network. Road attributes can be exported into a GIS system with RAMM mapping software.
Bridge information is held on a separate database. For Transit, Opus has carried out a seismic screening of the state highway bridges in the Christchurch area and the results of this study would be available for the Christchurch risk study.
5.4 Water Supply Networks
The key assets for the water supply network are pipes, pumping stations, valves and reservoirs. The CCC stores information on pipes in a GIS system. Pipe attributes including size, length, age and material are also available. The location of pumping stations, major valves and reservoirs can also be linked into a GIS model.
An overview of the Water Supply Asset Management Plan 2002 is available on the council website. A detailed copy of the asset management and business continuance plan would be made available to the risk study group.
5.5 Telecommunications Assets
Telecom New Zealand Ltd (Telecom) and Telstra Clear Ltd (TelstraClear) have communication networks in Christchurch. Vodafone and Telecom also operate independent cellular phone networks.
5.5.1 Telecom
Telecom uses Small World GIS software to store information on their network assets. Telecom’s main assets are exchange buildings, underground communication cables and cell phone towers.
Telecom has a policy of not releasing drawings showing the complete underground cable network as this information is commercially sensitive. Telecom has released incomplete or disjointed information for previous lifelines studies. Most of the drawings were provided in a CAD format and prepared by in-house Telecom draughtsmen. It may be more difficult to obtain the same quality of information for this risk study as Telecom no longer have the in-house drafting capability to provide such services.
Small World GIS compatibility software is available to convert layers and attribute data into appropriate formats for use in other GIS systems. However the ability to provide incomplete or disjointed cable network information from a GIS system may be difficult. Another alternative would be to trace printed outputs from the Small World GIS system using CAD. The CAD layer could then be imported into the GIS model for Christchurch.
![Figure 1 - Basic Steps in Earthquake Risk Assessment [King and Kiremidjian, 1994]](https://thumb-us.123doks.com/thumbv2/123dok_us/9093438.2401898/10.892.145.763.173.950/figure-basic-steps-earthquake-risk-assessment-king-kiremidjian.webp)
![Figure 3 - GIS Mapping Process for Regional Seismic Risk analysis [King and Kiremidjian, 1994]](https://thumb-us.123doks.com/thumbv2/123dok_us/9093438.2401898/15.892.143.792.318.726/figure-mapping-process-regional-seismic-risk-analysis-kiremidjian.webp)