l
a
i
g
f
a
S
a
i
a
b
l
e
S
l
a
C
"
l
a
i
g
f
a
S
a
i
a
b
l
e
S
l
a
C
"
l
a
i
g
f
a
S
a
i
a
b
l
e
S
l
a
C
"
l
a
i
g
f
a
S
a
i
a
b
l
e
S
l
a
C
"
HOUSING
NEEDS
ASSESSMENT
A p p e n d i xA
TABLE OF CONTENTS
Introduction ... 1Housing Needs Assessment ... 2
Population Characteristics... 2
Special Needs Groups ... 7
Housing Stock Characteristics ... 12
Housing Types ... 12
Assisted Housing Inventory and At-Risk Housing ... 16
Housing Costs and Affordability (Housing Market Conditions) ... 18
Community Profiles ... 20 Homeacres... 21 Starr Subdivision... 21 Sandy Beach ... 22 Old Cordelia ... 22 Green Valley ... 23 Rockville ... 23 Tolenas ... 24 North Vacaville... 25 East Vacaville ... 25 Olive School ... 26 Elmira ... 26
f
a
S
a
i
a
b
l
e
S
l
a
C
"
f
a
S
a
i
a
b
l
e
S
l
a
C
"
f
a
S
a
i
a
b
l
e
S
l
a
C
"
f
a
S
a
i
a
b
l
e
S
l
a
C
"
A p p e n d i x A : H o u s i n g N e e d s A s s e s s m e n t
Governmental and Non-Governmental Constraints ... 27
Non-Governmental Constraints ... 27
Governmental Constraints ... 28
Provisions for a Variety of Housing ... 32
Resources... 45
Regional Housing Needs Allocations (RHNA)... 45
Financial Resources ... 49
Homeless Resources ... 53
Opportunities for Energy Conservation ... 54
Tables
Table 1 Population and Household Growth Trends... 2Table 2 Projected Population and Household Growth... 3
Table 3 Change in County Age Distribution, 2000... 3
Table 4 Race/Ethnicity ... 4
Table 5 Persons per Household 2000–2008 ... 4
Table 6 Household Composition 2000... 4
Table 7 Solano County Maximum Household Income Level by Household Size .. 5
Table 8 Household Income ... 6
Table 9 Vallejo-Fairfield Metropolitan Statistical Area Projections of Employment.. 6
Table 11 2000 Senior Household by Tenure ... 8
Table 12 Senior Households by Housing Cost Burden ... 8
Table 13 Disabilities Tallied, 2000 ... 9
Table 14 Solano County Single-Parent Households, 2000 ... 10
Table 15 Housing Type, 2000–2008 ... 12
Table 16 Household Tenure ... 13
Table 17 Extremely low-Income Household Tenure... 13
Table 18 Overcrowding, 2000 ... 14
Table 19 Age of Housing – Unincorporated Solano County, 2008 ... 15
Table 20 Summary of Housing Conditions Survey Results ... 15
Table 21 Substandard Units by Area... 16
Table 22 Solano County Affordable Housing Cost, 2009... 18
Table 23 Solano County Rental Survey, 2009... 19
Table 24 Solano County Housing Sales Activity, March 2009 ... 20
Table 25 Unincorporated Area Households Overpaying for Housing, 2000 ... 20
Table 26 Solano County Loan Activity, 2005–2007 ... 28
Table 27 Residential Development Standards ... 31
l
a
i
g
f
a
S
a
i
a
b
l
e
S
l
a
C
"
l
a
i
g
f
a
S
a
i
a
b
l
e
S
l
a
C
"
l
a
i
g
f
a
S
a
i
a
b
l
e
S
l
a
C
"
l
a
i
g
f
a
S
a
i
a
b
l
e
S
l
a
C
"
A p p e n d i x A : H o u s i n g N e e d s A s s e s s m e n t
INTRODUCTION
State law requires that in preparing its Housing Element, each California jurisdiction conduct a Housing Needs Assessment that includes analysis of local housing, economic, and demographic conditions and analyzes the governmental and non-governmental constraints that discourage housing development. The Housing Needs Assessment should also assess the demand for housing for households at all income levels and for housing suitable for special needs populations. For Solano County and other counties, the Housing Needs Assessment focuses on the Unincorporated Area. By providing this required information as background for the Housing Element Update, the Housing Needs Assessment will assist Solano County residents, stakeholders, and policy makers in developing rational goals and programs that can effectively address housing problems within the Unincorporated Area.
To facilitate an understanding of how the characteristics of the unincorporated parts of Solano County (“Unincorporated Area”) are similar to or different from other nearby communities, this Housing Needs Assessment presents data for the Unincorporated Area alongside comparable data for all of Solano County (including the Unincorporated Area). According to the County’s Department of Resource Management, the County comprises 909.4 square miles, of which 675.4 square miles are unincorporated.
This Housing Needs Assessment incorporates data from numerous sources, including the United States Census; the Association of Bay Area Governments (ABAG); the California, Department of Finance (DOF); the California Economic Development Department (EDD); and the U.S. Department of Housing and Urban Development, Comprehensive Housing Affordability Strategy (CHAS) Data. The Housing Needs Assessment analyzes population and housing characteristics, identifies special housing needs among certain population groups, evaluates housing conditions, and provides other important information to support the goals, policies, and programs that will meet the needs of current and future Solano County residents.
The Housing Needs Assessment comprises four sections. The first section focuses on demographic information, including population trends, ethnicity, age, household composition, income, employment, and housing characteristics for the unincorporated areas of Solano County and for all of Solano County as a whole.
The second section describes the housing and population characteristics for the eleven communities within the unincorporated areas of Solano County.
The third section centers on the governmental and non-governmental constraints to housing development in Solano County. The County established planning, zoning, and building standards that guide residential development patterns and influence housing availability and affordability. There are also numerous non-governmental constraints, such as environmental and housing market conditions, that affect the location, availability, affordability, and type of housing that is constructed within the County. Non-governmental constraints include such factors as the availability of financing, land cost, and construction costs.
The fourth section describes the County’s resources, future development potential, and energy conservation opportunities.
f
a
S
a
i
a
b
l
e
S
l
a
C
"
f
a
S
a
i
a
b
l
e
S
l
a
C
"
f
a
S
a
i
a
b
l
e
S
l
a
C
"
f
a
S
a
i
a
b
l
e
S
l
a
C
"
A p p e n d i x A : H o u s i n g N e e d s A s s e s s m e n t
HOUSING NEEDS ASSESSMENT
Population Characteristics
This section presents information regarding changes in the population characteristics in the Unincorporated Area since 2000.
Population
According to the State Department of Finance (DOF), as of 2009, the Unincorporated County had a population of 20,156 compared to the total county with a population of 426,729. Table 1
compares the population counts between the Unincorporated Area and Solano County, from ABAG’s 2007 population projections. The Unincorporated Area had a 6 percent population increase from 2000 to 2005, increasing from 19,322 to 20,500 persons. The County overall grew 7 percent from 2000 to 2005.
Households
A household is defined as a person or group of persons living in a housing unit, as opposed to persons living in group quarters, such as dormitories, convalescent homes, or prisons. As shown in
Table 1, the number of households in the Unincorporated Area increased by 7 percent between
2000 and 2005. The County as a whole experienced a 9 percent increase in households between 2000 and 2005. According to the DOF, as of 2009, the Unincorporated County had a approximately 7,530 households compared to the total county with a approximately 152,743 households.
Table 1
Population and Household Growth Trends
Unincorporated Area Solano County
2000 2005 Percentage Change 2000–2005 2000 2005 Percentage Change 2000–2005 Total Population 19,322 20,500 6% 394,542 421,600 7% Total Households 6,558 7,020 7% 130,403 142,040 9%
Source: ABAG, 2007 Projections
Projected Population Growth
As shown in Table 2, ABAG anticipates population growth in the Unincorporated Area to be slightly more than Solano County. The percentage change between 2005 and 2015 for the
l
a
i
g
f
a
S
a
i
a
b
l
e
S
l
a
C
"
l
a
i
g
f
a
S
a
i
a
b
l
e
S
l
a
C
"
l
a
i
g
f
a
S
a
i
a
b
l
e
S
l
a
C
"
l
a
i
g
f
a
S
a
i
a
b
l
e
S
l
a
C
"
A p p e n d i x A : H o u s i n g N e e d s A s s e s s m e n t
Table 2
Projected Population and Household Growth
Unincorporated Area Solano County
2005 2015 Percentage Change 2005–2015 2005 2015 Percentage Change 2005–2015 Total Population 20,500 24,100 18% 421,600 488,400 16% Total Households 7,020 8,180 17% 142,040 162,620 15%
Source: ABAG, 2007 Projections
Age Distribution
The distribution of population in the Unincorporated Area among the age categories shown on
Table 3 is weighted more toward the older age groups than in the County overall. In 2000, the
Unincorporated Area had larger concentrations of persons 45 and older compared to the County, representing approximately 41 percent of the Unincorporated Area’s population compared to 31 percent of the County’s overall population. The Unincorporated Area also had significantly smaller concentrations of persons aged 18 to 34, accounting for less than 18 percent of the Unincorporated Area’s total population compared to 24 percent of Solano County’s total population.
The median age of residents in the Unincorporated Area in 2000 was 40 years, as compared to 34 years for the County as a whole.
Table 3
Change in County Age Distribution, 2000
Unincorporated Area Solano County Age Distribution
Number Percentage Number Percentage
0-17 5,358 27% 106,207 28% 18-24 1,510 7% 34,979 9% 25-34 1,936 10% 52,927 14% 35-44 3,404 17% 66,506 17% 45-54 3,083 16% 51,694 14% 55-64 2,157 11% 27,410 7% 65+ 2,208 11% 35,163 9% Total 19,656 100% 374,886 100%
Source: 2000 U.S. Census
Race and Ethnicity
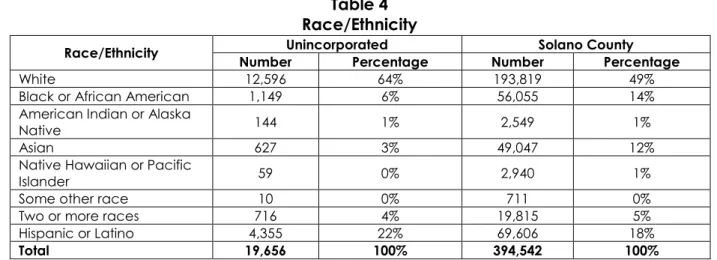
As shown in Table 4, the share of minorities in the Unincorporated Area of the County is 15 percent less than the share of minorities in the County as a whole. The share of minorities in the urban areas is much higher than in the Unincorporated Area of the County, which explains the differences seen between each area in Table 4. The share of the population reporting to be Hispanic/Latino was higher in the Unincorporated Area than in the County as a whole. Those reporting to be of Hispanic/Latino origin and white account for 86 percent of the share of the population in the Unincorporated Area, which is 19 percent lower than the County as a whole.
f
a
S
a
i
a
b
l
e
S
l
a
C
"
f
a
S
a
i
a
b
l
e
S
l
a
C
"
f
a
S
a
i
a
b
l
e
S
l
a
C
"
f
a
S
a
i
a
b
l
e
S
l
a
C
"
A p p e n d i x A : H o u s i n g N e e d s A s s e s s m e n t
Table 4
Race/Ethnicity
Unincorporated Solano County Race/Ethnicity
Number Percentage Number Percentage
White 12,596 64% 193,819 49%
Black or African American 1,149 6% 56,055 14%
American Indian or Alaska
Native 144 1% 2,549 1%
Asian 627 3% 49,047 12%
Native Hawaiian or Pacific
Islander 59 0% 2,940 1%
Some other race 10 0% 711 0%
Two or more races 716 4% 19,815 5%
Hispanic or Latino 4,355 22% 69,606 18%
Total 19,656 100% 394,542 100%
Source: 2000 U.S. Census
Persons per Household
According to the Department of Finance and 2000 Census data, shown in Table 5, from 2000 to 2008 the persons per household decreased in Solano County from 2.9 to 2.82. The Unincorporated Area’s average household increased in size from 2.74 to 2.78 persons per household.
Table 5
Persons per Household 2000–2008
Unincorporated Area Solano County Year 2000 2008 Percentage
Change 2000 2008
Percentage Change
Persons per Household 2.74 2.78 0.2% 2.9 2.82 -0.4%
Source: Department of Finance, 2008, 2000 U.S. Census
Household Type
Households are divided into two different types depending on their composition. Family households are those consisting of two or more related persons living together. Non-family households include persons who live alone or in groups of unrelated individuals. As shown in
Table 6, 92 percent of the population in households, in the Unincorporated Area are family
households, compared to 89 percent of the population in households in all of Solano County. The relative preponderance of family households in the Unincorporated Area is likely a function of the limited supply of multi-family homes in the Unincorporated Area, which tends to have a higher proportion of non-family households. Data on housing stock composition are discussed in detail below.
l
a
i
g
f
a
S
a
i
a
b
l
e
S
l
a
C
"
l
a
i
g
f
a
S
a
i
a
b
l
e
S
l
a
C
"
l
a
i
g
f
a
S
a
i
a
b
l
e
S
l
a
C
"
l
a
i
g
f
a
S
a
i
a
b
l
e
S
l
a
C
"
A p p e n d i x A : H o u s i n g N e e d s A s s e s s m e n t Household Income
Household income is one of the most significant factors affecting housing choice and opportunity. Income largely determines a household’s ability to purchase or rent housing. While higher-income households have more discretionary income to spend on housing, lower- and moderate-income households are limited in the range of housing they can afford. Typically, as the income of a household decreases, the incidence of housing cost burdening and overcrowding increases.
For the purpose of evaluating housing affordability, housing need, and eligibility for housing assistance, income levels are defined by guidelines adopted each year by the California State Department of Housing and Community Development (HCD). For Solano County, the applicable median income for a family of four in 2009 is $79,400.
HCD has defined the following income categories for Solano County, based on the median income for a household of four persons.
Extremely low income: 30 percent and below ($0 to $23,800)
Very low income: 31 to 50 percent of median income ($23,801 to $39,700) Low income: 51 to 80 percent of median income ($39,701 to $63,500) Moderate income: 81 to 120 percent of median income ($63,501 to $95,300)
Above moderate income: 120 percent or more of median income ($95,301 or more)
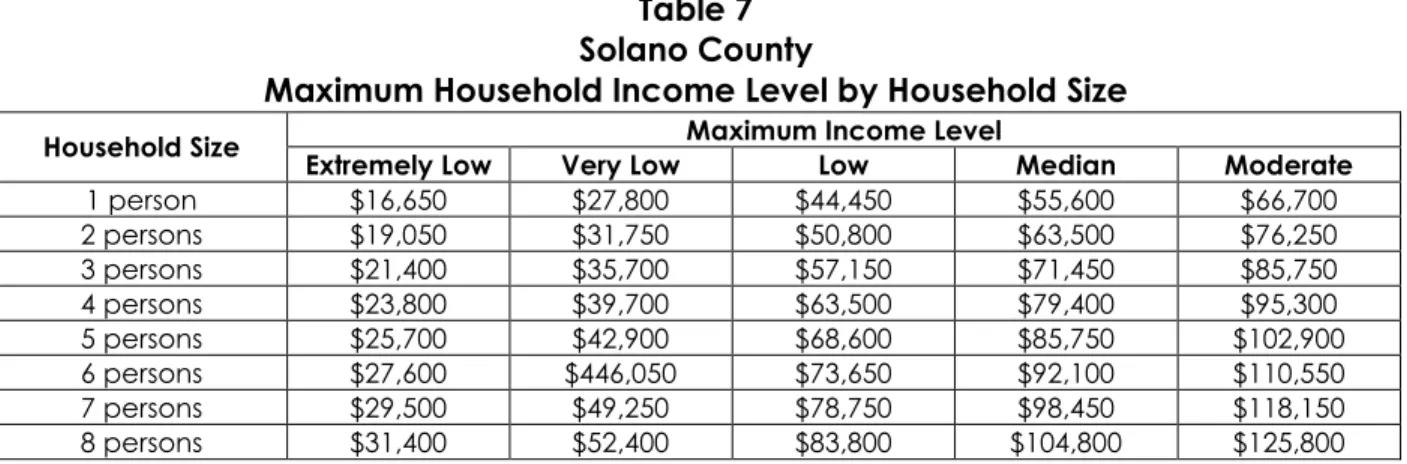
Table 7 shows Solano County’s maximum annual income level for each income group, adjusted
by household size. This data is used when determining a household’s eligibility for federal, state, or local housing assistance and when calculating the maximum affordable housing payment for renters and buyers.
Table 7
Solano County
Maximum Household Income Level by Household Size
Maximum Income Level Household Size
Extremely Low Very Low Low Median Moderate
1 person $16,650 $27,800 $44,450 $55,600 $66,700 2 persons $19,050 $31,750 $50,800 $63,500 $76,250 3 persons $21,400 $35,700 $57,150 $71,450 $85,750 4 persons $23,800 $39,700 $63,500 $79,400 $95,300 5 persons $25,700 $42,900 $68,600 $85,750 $102,900 6 persons $27,600 $446,050 $73,650 $92,100 $110,550 7 persons $29,500 $49,250 $78,750 $98,450 $118,150 8 persons $31,400 $52,400 $83,800 $104,800 $125,800
Source: Department of Housing and Community Development, Income Limits 2009
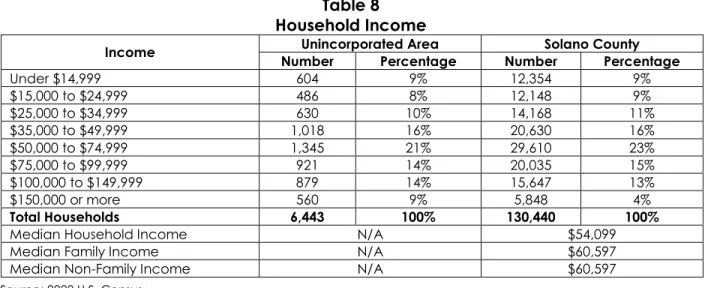
Table 8 shows the distribution of income according to the 2000 Census for the Unincorporated
Area and for all of Solano County. According to the 2000 Census, 43 percent of households in the Unincorporated Area had incomes below $50,000. When comparing the Unincorporated Area with Solano County as a whole, the percentage of households making below $50,000 was the same (43 percent). Median household income was unavailable for the Unincorporated Area but for Solano County as a whole the median household income was $54,099 in 2000.
f
a
S
a
i
a
b
l
e
S
l
a
C
"
f
a
S
a
i
a
b
l
e
S
l
a
C
"
f
a
S
a
i
a
b
l
e
S
l
a
C
"
f
a
S
a
i
a
b
l
e
S
l
a
C
"
A p p e n d i x A : H o u s i n g N e e d s A s s e s s m e n t
Table 8
Household Income
Unincorporated Area Solano County Income
Number Percentage Number Percentage
Under $14,999 604 9% 12,354 9% $15,000 to $24,999 486 8% 12,148 9% $25,000 to $34,999 630 10% 14,168 11% $35,000 to $49,999 1,018 16% 20,630 16% $50,000 to $74,999 1,345 21% 29,610 23% $75,000 to $99,999 921 14% 20,035 15% $100,000 to $149,999 879 14% 15,647 13% $150,000 or more 560 9% 5,848 4% Total Households 6,443 100% 130,440 100%
Median Household Income N/A $54,099
Median Family Income N/A $60,597
Median Non-Family Income N/A $60,597
Source: 2000 U.S. Census
Employment
Employment has an important impact on housing needs. Different jobs and associated income levels determine the type and size of housing a household can afford. Employment growth in the region typically increases housing demand.
The California Employment Development Department (EDD) produces an Occupational Employment and Wage Data spreadsheet by metropolitan statistical area (MSA) yearly. Table 9
shows employment projections from 2006 through 2016 as related to job growth for the Vallejo-Fairfield Metropolitan Statistical Area. During the next six years, the Vallejo-Vallejo-Fairfield Metropolitan Statistical Area expects new employment to be concentrated in a variety of occupations ranging from registered nurses to customer service representatives. When comparing these annual incomes to the median income for 2009 ($79,400), none of the occupational groups are above the median income.
Table 9
Vallejo-Fairfield Metropolitan Statistical Area Projections of Employment
Occupation Group Estimated Employment (2006) Estimated Employment (2016) Numeric Change Annual Salary* Income Group
Registered Nurses 2,890 4,140 1,250 $75,712 Moderate
Personal and Home Care
Aides 2,230 3,010 780 $21,673 Extremely Low
Telecommunications Line
Installers and Repairers 380 760 380 $35,526 Very Low
l
a
i
g
f
a
S
a
i
a
b
l
e
S
l
a
C
"
l
a
i
g
f
a
S
a
i
a
b
l
e
S
l
a
C
"
l
a
i
g
f
a
S
a
i
a
b
l
e
S
l
a
C
"
l
a
i
g
f
a
S
a
i
a
b
l
e
S
l
a
C
"
A p p e n d i x A : H o u s i n g N e e d s A s s e s s m e n t
Table10 identifies some of the major employers throughout Solano County by number of
employees.
Table 10
Major Employers in Solano County
Employer Number of Jobs
Travis Air Force Base 7,260
Kaiser Permanente 3,262
North Bay Medical Center 1,480
Six Flags Discovery Kingdom 1,500
ALZA Corporation 1,000
Genentech 950
Westamerica Bank Corporation 542
Valero Refining Company 480
Anheuser-Busch Brewery 465
Albertson’s Distribution Center 450
CSK Auto Incorporated 400
Jelly Belly 400
TIMEC Co 400
Walmart 349
Sutter Solano Medical Center 67
Source: Solano County, 2009
Special Needs Groups
Certain groups have greater difficulty in finding acceptable, affordable housing due to special circumstances relating to employment and income, household characteristics, and disabilities, among others. These “special needs” groups include seniors, persons with disabilities, large households, single-parent households (female-headed households with children, in particular), homeless persons, and agricultural workers. This section discusses the housing needs facing each group, as well as programs and services available to address the housing needs.
Large Households
Large households are defined as households having five or more persons. According to the 2000 Census, there were approximately 600 large owner-occupied households and 380 large renter-occupied households in the Unincorporated Area, representing 13 percent of total owner households and 19 percent of total renter households.
Elderly
The elderly population often requires special housing to accommodate part-time or full-time care and is also more likely to have lower incomes than the population in general. Simple housing requirements can include modifications to doors and steps to improve accessibility and installation of grab bars to make bathing, toileting, and other daily activities safer. Housing unit types such as apartments or condominiums that do not entail high maintenance requirements can also be beneficial as the elderly continue to age and become less able to perform extensive home maintenance work on their own. The elderly are also commonly on fixed incomes while expending more of their income on medical care, meaning that affordable housing is often needed.
According to the 2000 U.S. Census, there are approximately 2,208 persons 65 years and older, or 11 percent of the total population, living within the Unincorporated Area. From 1990 to 2000, the senior population in the Unincorporated Area grew by a little more than 1 percent annually and 3 percent of the population growth occurred in the cohort of persons 75 years and older. With
f
a
S
a
i
a
b
l
e
S
l
a
C
"
f
a
S
a
i
a
b
l
e
S
l
a
C
"
f
a
S
a
i
a
b
l
e
S
l
a
C
"
f
a
S
a
i
a
b
l
e
S
l
a
C
"
A p p e n d i x A : H o u s i n g N e e d s A s s e s s m e n t
this growth in the upper age groups, increasing needs for supportive housing for the elderly can be expected.
Senior-Headed Households by Tenure
The 2000 Comprehensive Housing Affordability Strategy (CHAS) provides data on the number of senior-headed households by tenure. Senior-headed households are households where the head of household is 65 years or older. As shown in Table 11, there are approximately 1,188 senior-headed owner households and 147 senior-headed renter households, indicating that the vast majority of senior-headed households living in the Unincorporated Area are owners. In addition, a larger proportion of owner households in the Unincorporated Area are senior-headed households compared to the County overall. Approximately 26 percent of owner households in the Unincorporated Area are senior-headed households compared to 20 percent of owners in the County overall.
Table 11
2000 Senior Household by Tenure
Unincorporated Area Solano County Number Percentage Number Percentage
Renter-Occupied Households 147 11% 4,990 22%
Owner-Occupied Households 1,188 89% 17,376 78%
Total Households with Senior Householder 1,335 100% 22,366 100%
Source: 2000 CHAS data
Senior-Headed Households by Income
Rising rents are of concern due to the fact that most seniors are on fixed incomes. As shown in
Table 12 and according to the 2000 Census, there are 45 senior renter households overpaying
and 239 senior owner households overpaying.
Table 12
Senior Households by Housing Cost Burden
Senior Households with Cost Burden Greater than 30%
Number Percentage
Renter-Occupied Households 45 16%
Owner-Occupied Households 239 84%
Total Elderly Households Overpaying 284 100%
Source: 2000 U.S. Census
Persons with Disabilities
Disabilities can take many forms and have numerous implications for housing need. Many disabled people can live in conventional housing without any modifications or with only minor modifications, while some disabled people require substantial modifications and/or on-site care to maintain everyday living, while others may need occasional assistance but do not require
l
a
i
g
f
a
S
a
i
a
b
l
e
S
l
a
C
"
l
a
i
g
f
a
S
a
i
a
b
l
e
S
l
a
C
"
l
a
i
g
f
a
S
a
i
a
b
l
e
S
l
a
C
"
l
a
i
g
f
a
S
a
i
a
b
l
e
S
l
a
C
"
A p p e n d i x A : H o u s i n g N e e d s A s s e s s m e n t
of 3,419 persons identified as having a disability and there were 5,960 disabilities reported, of which 73 percent were reported by those under the age of 65.
The 2000 U.S. Census identified six types of disabilities for Solano County’s non-institutional population: sensory, physical, mental, self-care, go outside home, and employment.
The data in Table 13 contains a count for the total disabilities of residents in the County and does not quantify instances in which persons have multiple disabilities. The 2000 Census organized the disabilities into two categories (long-lasting and more than 6 months) and defines each disability as:
Long-lasting
Sensory – blindness, deafness, or a severe vision or hearing impairment
Physical – a condition that substantially limits one or more basic physical activities, such as walking, climbing stairs, reaching, lifting, or carrying
Lasting 6 months or more
Mental – difficulty learning, remembering, or concentrating
Self-care – difficulty dressing, bathing, or getting around inside the home
Go outside home – difficulty going outside the home alone to shop or visit a doctor’s office Employment – difficulty working at a job or business
According to the 2000 Census, the Unincorporated Area of the County and the County as a whole shared similar proportions of the types of disabilities reported. For example, 38 percent of disabilities reported in the Unincorporated Area for the population under 65 were employment disabilities, which was similar for the County as a whole (36 percent).
Table 13
Disabilities Tallied, 2000
Unincorporated Area Total County Total Disability
Number Percentage Number Percentage
Total Disabilities for Ages 5-64 4,353 73% 87,074 74%
Sensory Disability 354 8% 5,817 7% Physical Disability 897 21% 16,603 19% Mental Disability 574 13% 12,474 14% Self-care Disability 279 6% 4,786 5% Go-outside-home Disability 616 14% 15,976 18% Employment Disability 1,633 38% 31,418 36%
Total Disabilities for Ages 65+ 1,607 27% 30,700 26%
Sensory Disability 354 22% 5,418 18% Physical Disability 532 33% 10,343 34% Mental Disability 216 13% 4,140 13% Self-care Disability 161 10% 3,416 11% Go-outside-home Disability 344 21% 7,383 24% Total 5,960 100% 117,774 100%
f
a
S
a
i
a
b
l
e
S
l
a
C
"
f
a
S
a
i
a
b
l
e
S
l
a
C
"
f
a
S
a
i
a
b
l
e
S
l
a
C
"
f
a
S
a
i
a
b
l
e
S
l
a
C
"
A p p e n d i x A : H o u s i n g N e e d s A s s e s s m e n t Single-Parent-Headed Households
According to the 2000 Census, there were 14,101 single-parent households in Solano County. Ninety-six percent of the single-parent households were located in the incorporated areas of the County. The remaining 4 percent were in the Unincorporated Area, of which 61 percent were headed by a female and 39 percent by a male. As shown in Table 14, the share of female-headed households was 10 percent higher than in the Unincorporated Area. Of the 11,201 households in the Unincorporated Area, 550 (5 percent) are headed by a single parent.
Table 14
Solano County Single-Parent Households, 2000
Unincorporated Area Solano County Single-parent Household Type
Number Percentage Number Percentage
Female-Headed Households 338 61% 9,986 71%
Male-Headed Households 212 39% 4,115 29%
Total Single-Parent-Headed Households 550 100% 14,101 100%
Source: 2000 U.S Census
Farmworkers
Some farmworkers tend to have special housing needs due to the seasonal nature of their work, along with their need to migrate based on seasonal farmworker demand. Solano County has both a large flux of seasonal workers and a substantial base of year-round farmworkers who reside permanently in the County. The 2007 USDA Census of Agriculture reports that there are 280 farms in Solano County, employing a total of 2,813 workers. Of the 2,813 farmworkers in the County, 52 percent work more than 150 days each year. The remaining 48 percent work less than 150 days per year. Larger farms provide the main source of farm employment for farmworkers. According to the Census of Agriculture, 2,171 (77 percent) of farmworkers were employed on farms with 10 or more workers. While these estimates are at the County level and are not specifically for the Unincorporated Area, it is likely the vast majority of farmworkers work within the Unincorporated Area where most of the agricultural production in the County takes place.
Families and Individuals in Need of Emergency Shelter
Community Action Partnership of Solano (CAP Solano) is the designated Community Action Agency for the County and is a Joint Powers Authority between Solano County and the cities of Benicia, Dixon, Fairfield, Rio Vista, Suisun, Vacaville, and Vallejo. CAP Solano completed a count of homeless persons on the evening of January 27, 2009. The count identified a total of 425 persons in the County, of which 66 were from Fairfield. The count did not identify any persons as residents of the Unincorporated Area of the County.
The count did identify that 69 percent were male, 23 percent female, 2 percent children, and 6 percent unknown. In addition to the data from the observation survey, CAP Solano conducted a more in-depth point-in-time survey of 204 homeless individuals. The survey found that 148 of
l
a
i
g
f
a
S
a
i
a
b
l
e
S
l
a
C
"
l
a
i
g
f
a
S
a
i
a
b
l
e
S
l
a
C
"
l
a
i
g
f
a
S
a
i
a
b
l
e
S
l
a
C
"
l
a
i
g
f
a
S
a
i
a
b
l
e
S
l
a
C
"
A p p e n d i x A : H o u s i n g N e e d s A s s e s s m e n t
permanent housing. Even with these 396 beds, Solano County is looking at the need to house over 3,000 homeless persons at any one time in Solano County. Solano County has ten strategies addressing homelessness:
Discharge planning and decrease the number of people of being discharged into homelessness by 25 percent;
Create new permanent housing beds for homeless and chronically homeless persons;
Increase percentage of homeless persons staying in permanent housing over 6 months to 71 percent;
Increase percentage of homeless persons moving from transitional housing into permanent housing by 61 percent;
Increase percentage of homeless persons becoming employed by 11 percent;
Ensure that the Continuum of Care has a functional Homeless Management Information System with 90 percent of the shelters and housing projects actively participating;
Improve access to mainstream resources by 25 percent;
Chronically homeless individuals will be fully engaged in the continuum of services and housing available of them;
Chronically homeless people will be forced to live on the street until permanent housing or affordable housing is available;
Ensure sufficient outreach to homeless, at-risk families and non-chronically homeless individuals and provide for their basic needs;
Further strengthen self-sufficiency supports for homeless people moving out of homelessness.
Additional homeless resources can be found in Section 4, Resources.
Military Workers
Travis Air Force Base (AFB) is located within the City of Fairfield, in the northeast part of the County. The base has a long and proud history of supporting humanitarian airlift operations at home and around the world. Today, the base includes approximately 7,260 active military personnel, 3,770 civilians, and 4,250 reservists. Although the base is located within the City of Fairfield, it is safe to assume that a number of military workers live within the unincorporated areas of the county.
Travis Air Force Base has long been an important factor in the employment in the County. Known as the “Gateway to the Pacific,” Travis Air Force Base handles more cargo and passenger traffic through its airport than any other military air terminal in the United States. Travis AFB has a major impact on the community as a number of military families and retirees have chosen to make Fairfield their permanent home. Travis AFB is one of the largest employers in Solano County as well, and the massive Travis workforce has a local economic impact of more than $1 billion annually. The base also contributes a large number of highly skilled people to the local labor pool. David Grant Medical Center annually supports over 308,000 outpatient visits, 5,100 admissions, 40,500 dental visits, and 116 research protocols with 124 residents and 2,142 staff.
f
a
S
a
i
a
b
l
e
S
l
a
C
"
f
a
S
a
i
a
b
l
e
S
l
a
C
"
f
a
S
a
i
a
b
l
e
S
l
a
C
"
f
a
S
a
i
a
b
l
e
S
l
a
C
"
A p p e n d i x A : H o u s i n g N e e d s A s s e s s m e n t
Because military personnel, by the nature of their employment, are mobile, and the income level of enlisted personnel is relatively low, they need rental housing that is affordable to low- and moderate-income households and that is available on a monthly basis (in contrast to a long-term lease). Military personnel with dependents need affordable family housing, with recreational amenities for children.
HOUSING STOCK CHARACTERISTICS
Housing Types
Table 15 shows the composition of the housing stock in 2000 and 2008 based on data from the
State Department of Finance. In the Unincorporated Area, single-family homes comprised 87 percent of the housing stock in 2000 and 2008. Multi-family units, including both apartments and condominiums, made up 6 percent of all housing in 2000 and 2008. From 2000 to 2008, housing production in the total County averaged 1.5 percent annual growth. Like the Unincorporated Area of the County, the total County comprised mainly single-family homes (76 percent).
Table 15
Housing Type, 2000–2008
2000 2008
Housing Unit Type
Number Percentage Number Percentage
Annual Growth 2000–2008 Unincorporated Area Single-Family Detached 5,859 84% 6,073 81% 0.5% Single-Family Attached 220 3% 452 6% 13% Multi-Family (2-4 Units) 293 4% 306 4% 0.5% Multi-Family (5+ Units) 119 2% 119 2% 0% Mobile Homes 470 7% 541 7% 2.8% Total 6,961 100% 7,491 100% 1.0% Solano County Single-Family Detached 96,064 71% 108,624 71% 1.6% Single-Family Attached 5,573 4% 7,291 5% 3.8% Multi-Family (2-4 Units) 10,247 8% 10,668 7% 0.5% Multi-Family (5+ Units) 19,776 15% 20,782 14% 0.6% Mobile Homes 4,587 3% 4,676 3% 0.2% Total 136,247 100% 152,671 100% 1.5%
l
a
i
g
f
a
S
a
i
a
b
l
e
S
l
a
C
"
l
a
i
g
f
a
S
a
i
a
b
l
e
S
l
a
C
"
l
a
i
g
f
a
S
a
i
a
b
l
e
S
l
a
C
"
l
a
i
g
f
a
S
a
i
a
b
l
e
S
l
a
C
"
A p p e n d i x A : H o u s i n g N e e d s A s s e s s m e n t
Household Tenure
As summarized in Table 16, households in the Unincorporated Area and Solano County were all more likely to own their homes rather than to rent them in 2000. Approximately 70 percent of the households living the Unincorporated Area and 65 percent of population in households in Solano County owned their homes in 2000.
Table 16
Household by Tenure
Unincorporated Area Solano County Household Type
Number Percentage Number Percentage
Owner Occupied 4,496 70% 84,997 65%
Renter Occupied 1,955 30% 45,406 35%
Occupied Housing Units 6,451 100% 130,403 100%
Source: 2000 U.S. Census
Household Tenure of Extremely Low-Income Household Population
An extremely low-income household is defined as a household earning less than 30 percent of the area median income. The 2000 Census is the most readily available database reporting the number of households by household income and tenure for the County. According to the 2000 Census, the median income for Solano County was $54,099, which means that households earning less than $16,299 (30 percent of median income) are considered extremely low income.
Table 17 shows the population in households earning less than $16,299 in both the
Unincorporated Area and the County as a whole. As shown in the table below, 3.7 percent of the population in households in both the Unincorporated Area and the County as a whole were extremely low income. In the unincorporated County, the share of renter- and owner-occupied households considered to be extremely low income were equal as compared to the whole County, in which 37 percent of extremely low-income households were owner occupied and 63 percent were renter occupied.
Table 17
Extremely low-Income Household Population by Tenure
Unincorporated Area Solano County Household Type
Number Percentage Number Percentage
Owner Occupied 355 49.7% 5,323 37.6%
Renter Occupied 359 50.3% 8,818 62.4%
Total Extremely low-income household population 714 3.7% 14,141 3.7% Total Population in households 19,059 100% 378,628 100%
Source: 2000 U.S. Census
Note: The percentage share shown for tenure represents the percentage share of extremely low-income households and the percentage share for total extremely low-income households represents the share of all households.
Overcrowding
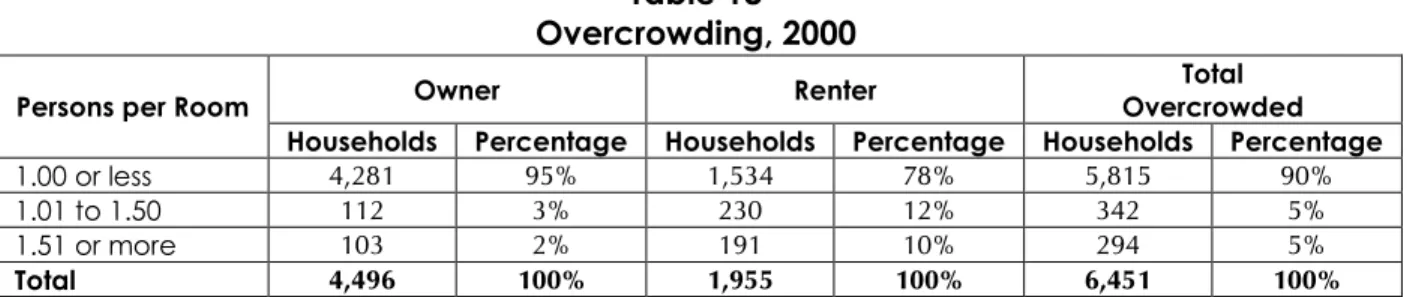
Data on housing overcrowding are available from the 2000 Census in the form of statistics regarding the number of persons per room in occupied housing units. Table 18 compares the data for the Unincorporated Area with data for all of Solano County. Overcrowding occurs when there is more than one occupant per room in a household, and severe overcrowding occurs when there are more than one and a half persons per bedroom in a household.
In 2000, approximately 90 percent of the Unincorporated Area’s housing units had 1.0 or fewer persons per room, meaning only 10 percent would have been considered overcrowded. Of all
f
a
S
a
i
a
b
l
e
S
l
a
C
"
f
a
S
a
i
a
b
l
e
S
l
a
C
"
f
a
S
a
i
a
b
l
e
S
l
a
C
"
f
a
S
a
i
a
b
l
e
S
l
a
C
"
A p p e n d i x A : H o u s i n g N e e d s A s s e s s m e n t
units in the Unincorporated Area, 5 percent had between 1.01 and 1.50 persons per room and 5 percent had 1.51 or more persons per room.
When broken out according to tenure, 12 percent of renter-occupied household were overcrowded and 10 percent were severely overcrowded. Of the owner-occupied households, 3 percent were considered overcrowded and 2 percent were severely overcrowded.
Table 18
Overcrowding, 2000
Owner Renter Total
Overcrowded Persons per Room
Households Percentage Households Percentage Households Percentage
1.00 or less 4,281 95% 1,534 78% 5,815 90%
1.01 to 1.50 112 3% 230 12% 342 5%
1.51 or more 103 2% 191 10% 294 5%
Total 4,496 100% 1,955 100% 6,451 100%
Source: 2000 U.S. Census
Vacancy
According to the Department of Finance, the vacancy rate for the Unincorporated Area of Solano County was 5.88 percent in 2000 and 6.48 percent in 2009. A vacancy rate measures the overall housing availability in a community and is often a good indicator of how efficiently for-sale and rental housing units are meeting the current demand for housing. A vacancy rate of 5 percent for rental housing and 2 percent for ownership housing is generally considered healthy and suggests that there is a balance between the demand and supply of housing. A lower vacancy rate may indicate that households are having difficulty in finding housing that is affordable, leading to overcrowding or households having to pay more than they can afford.
Physical Condition of Housing Stock
Housing age is an important indicator of housing condition within a community. Housing is subject to gradual deterioration over time. As a general rule in the housing industry, structures older than 30 years begin to show signs of deterioration and require reinvestment to maintain their quality. Unless properly maintained, homes older than 50 years require major renovations to remain in good condition. If not properly and regularly maintained, housing can deteriorate and discourage reinvestment, thereby depressing neighboring property values and impacting the quality of life in a neighborhood. Maintaining and improving housing quality is an important goal for the County.
Table 19 displays the age of Solano County’s occupied housing stock by year built as of 2008.
Forty-five (45) percent of the County’s housing stock was constructed before 1970. Between 1970 and 1989, 36 percent of the housing stock was constructed, and since 1990, 20 percent of the County’s housing stock was built.
l
a
i
g
f
a
S
a
i
a
b
l
e
S
l
a
C
"
l
a
i
g
f
a
S
a
i
a
b
l
e
S
l
a
C
"
l
a
i
g
f
a
S
a
i
a
b
l
e
S
l
a
C
"
l
a
i
g
f
a
S
a
i
a
b
l
e
S
l
a
C
"
A p p e n d i x A : H o u s i n g N e e d s A s s e s s m e n t
Table 19
Age of Housing – Unincorporated Solano County, 2008
Year Structure Built Total Housing Built Percentage of Total
Built 2001 to 2008* 496 7% Built 1999 to 2000 125 2% Built 1995 to 1998 249 3% Built 1990 to 1994 576 8% Built 1980 to 1989 1,129 15% Built 1970 to 1979 1,574 21% Built 1960 to 1969 913 12% Built 1950 to 1959 800 11% Built 1940 to 1949 673 9% Built 1939 or earlier 934 13% Total 7,469 100% Source: 2000 Census, *Department of Finance, 2008
Housing Conditions Survey
Conversations with County staff have determined that the housing conditions as of May 2009 are still consistent with the housing survey performed in 2001. There is still approximately 47 percent of the County’s housing stock in need of rehabilitation.
Mercy Housing California (MHC) performed a survey of housing unit conditions within the Unincorporated Area during September and October of 2001. Per the direction of Solano County, MHC performed a housing conditions survey within six unincorporated communities considered to have higher housing rehabilitation needs than the Unincorporated Area overall. These communities were Starr Subdivision, Elmira, Old Cordelia, Maple Street, Midway Road, and Rockville. In total, MHC inspected a sampling of 532 units within these communities, or approximately 8 percent of the Unincorporated Area’s total housing stock. Below is a summary of the results.
The data shown below summarize the overall housing rehabilitation needs of the six communities surveyed in the Unincorporated Area. Based upon the sample survey within the specified communities, 47 percent of the communities’ housing stock is in need of rehabilitation, of which 4 percent are dilapidated. Two hundred and fifty units of those surveyed were considered substandard, with the majority in need of moderate or minor rehabilitation. By extrapolating from the survey results, the six communities’ total housing rehabilitation need is 346 units.
Table 20
Summary of Housing Conditions Survey Results
Condition Number of Units Percentage of Total
Minor 121 23% Moderate 99 19% Substandard 11 2% Dilapidated 19 4% Subtotal Substandard 250 47% Subtotal Standard 282 53% Total Units 532 100%
f
a
S
a
i
a
b
l
e
S
l
a
C
"
f
a
S
a
i
a
b
l
e
S
l
a
C
"
f
a
S
a
i
a
b
l
e
S
l
a
C
"
f
a
S
a
i
a
b
l
e
S
l
a
C
"
A p p e n d i x A : H o u s i n g N e e d s A s s e s s m e n t
Table 21
Substandard Units by Area
Percentage of Total Units
Surveyed in Area Area Substandard Units
Starr Subdivision 137 52% Elmira 36 51% Old Cordelia 18 54% Rockville 27 30% Maple Street 15 40% Midway 17 53%
Total Substandard Units 250 47%
Starr Subdivision, Old Cordelia, and Midway have the largest proportion of units in substandard condition. Midway Road and Starr Subdivision also have the largest supply of dilapidated units, accounting for more than half of all dilapidated units surveyed in the Unincorporated Area. Rockville and Maple Street have the lowest need for housing rehabilitation among the areas surveyed.
Assisted Housing Inventory and At-Risk Housing
California Housing Element law requires all jurisdictions to include a study of all low-income housing units which may at some future time be lost to the affordable inventory by the expiration of some type of affordability restrictions. The law requires that the analysis and study cover a five-year and a ten-year period, coinciding with updates of the Housing Element. Following are some of the programs that may be expiring:
Prepayment of Department of Housing and Urban Development (HUD) mortgages: Section 221(d)(3), Section 236, Section 202, and Section 811, and Farmers Home (RHS) Section 515/516 subsidies to tenants and/or owners.
Low-income use restrictions on Section 236(j)(1) projects are for the full 40-year mortgage term. However, owners have the option to repay the remaining mortgage at the end of the first 20 years.
FHA-insured mortgages under the Section 221(d)(4) program have no binding use restrictions. The affordability of these projects is governed by the Section 8 contracts maintained on the projects which are now approved on a year-to-year basis.
Opt-outs and expirations of project-based Housing Choice contracts – The Housing Choice Voucher program is a federally funded program that provides for subsidies to the owner of a prequalified project for the difference between the tenant’s ability to pay and the contract rent. Opt-outs occur when the owner of the project decides to opt out of the contract with HUD by prepaying the remainder of the mortgage. Usually, the
l
a
i
g
f
a
S
a
i
a
b
l
e
S
l
a
C
"
l
a
i
g
f
a
S
a
i
a
b
l
e
S
l
a
C
"
l
a
i
g
f
a
S
a
i
a
b
l
e
S
l
a
C
"
l
a
i
g
f
a
S
a
i
a
b
l
e
S
l
a
C
"
A p p e n d i x A : H o u s i n g N e e d s A s s e s s m e n t
Inventory of At-Risk Rental Housing Units
According to the California Housing Partnership Corporation, there are no government-assisted rental properties in the Unincorporated Area of Solano County that may be at risk of opting out of programs that keep them affordable to very low- and low-income households over the five-year Housing Element Period (2009–2014).
Preservation Resources
Efforts by the County to retain low-income housing must be able to draw upon two basic types of preservation resources: organizational and financial. Qualified, nonprofit entities need to be made aware of the future possibilities of units becoming “at risk.” Should a property become at risk, the County maintains an active list of resources by which to preserve that property. Below is a list of qualified entities within Solano County:
ACLC, Inc
Affordable Housing Associates
Affordable Housing Foundation
BRIDGE Housing Corporation
C. Sandidge and Associates
Christian Church Homes of Northern California, Inc.
Community Home Builders and Associates
Community Housing Opportunities Corporation
Fairfield Redevelopment Agency, Planning Department
Housing Corporation of America
Mid-Peninsula Housing Coalition
Nehemiah Progressive Housing Development Corp.
O.P.E.N. Inc.
Pacific Community Services, Inc.
Phoenix Programs Inc.
Resources for Community Development
Richmond Neighborhood Housing Service Inc.
Sacramento Valley Organizing Community
Senior Housing Foundation
Solano Affordable Housing Foundation
f
a
S
a
i
a
b
l
e
S
l
a
C
"
f
a
S
a
i
a
b
l
e
S
l
a
C
"
f
a
S
a
i
a
b
l
e
S
l
a
C
"
f
a
S
a
i
a
b
l
e
S
l
a
C
"
A p p e n d i x A : H o u s i n g N e e d s A s s e s s m e n t
Housing Costs and Affordability
This section of the Housing Needs Assessment provides information on the current market conditions for housing in the Unincorporated Area. This information is important, because it reveals the extent to which the private housing market is providing for the needs of various economic segments of the local population.
Affordable Housing Cost
Table 22 displays the maximum rents and sales prices, respectively that are affordable to
extremely low-, very low-, low-, moderate-, and above moderate-income households. Affordability is based on the following assumptions: a household spending 30 percent or less of their total household income for shelter; the maximum household income levels established by HUD and HCD; and maximum affordable sales prices based on 10 percent down, 30-year fixed rate mortgage at 7 percent. The maximum affordable prices are used to determine the affordability of market-rate rental and for-sale housing. For example, a 3-person household with a monthly income of $2,979 ($35,750 annually) is considered a very low-income household. The maximum affordable monthly rent for a very low-income, 3-person household is $893 and the maximum affordable sales price is $97,114.
Table 22
Solano County Affordable Housing Cost, 2009
Income Group 1-Person 2-Person 3-Person 4-Person Extremely Low
Monthly Income $1,388 $1,604 $1,783 $1,983
Monthly Rent $416 $481 $535 $595
Max. Sales Price $40,460 $48,171 $54,561 $67,701
Very Low
Monthly Income $2,317 $2,646 $2,979 $3,308
Monthly Rent $695 $794 $893 $992
Max. Sales Price $73,624 $85,369 $97,114 $109,001
Low
Monthly Income $3,704 $4,233 $4,763 $5,333
Monthly Rent $1,111 $1,270 $1,429 $1,600
Max. Sales Price $123,138 $142,021 $160,941 $181,289
Moderate
Monthly Income $5,558 $6,354 $7,146 $7,942
Monthly Rent $1,667 $1,906 $2,144 $2,383
Max. Sales Price $190,393 $217,737 $246,010 $274,426
Above Moderate
Monthly Income >$5,558 >$6,354 >$7,146 >$7,942
Monthly Rent >$1,667 >$1,906 >$2,144 >$2,383
l
a
i
g
f
a
S
a
i
a
b
l
e
S
l
a
C
"
l
a
i
g
f
a
S
a
i
a
b
l
e
S
l
a
C
"
l
a
i
g
f
a
S
a
i
a
b
l
e
S
l
a
C
"
l
a
i
g
f
a
S
a
i
a
b
l
e
S
l
a
C
"
A p p e n d i x A : H o u s i n g N e e d s A s s e s s m e n t
Rental Rates and Trends
The survey results of rental listings in Solano County are displayed in Table 23. The survey reports the median listing prices for a variety of housing unit sizes in both single-family and multi-family housing types. A total of 30 single-family homes and 17 multi-family units were surveyed. Most units surveyed were located in the incorporated areas of the County as there were few available rental units in the Unincorporated Area.
One-bedroom multi-family units were the most affordable housing type found with a median rental rate of $805. A 2-person household occupying a one-bedroom apartment would not be considered overcrowded. Comparing the median rental rate of a one-bedroom apartment in
Table 23 with the maximum affordable rental rates for a 2-person household in Table 22, all
income categories except the very low- and extremely low-income households can afford the market-rate rent. Comparing the maximum affordable rental costs in Table 22 with the market-rate rents shown in Table 23, it is evident that the very low- and extremely low-income households will likely experience housing cost burdens and possible overcrowding.
Table 23
Solano County Rental Survey, 2009
Single-Family Multi-Family Unit Size
Median Rent Units Surveyed Median Rent Units Surveyed
1 Bedroom $1,055 2 $805 4 2 Bedroom $1,345 9 $1,025 7 3 Bedroom $1,400 13 $1,140 5 4 Bedroom $1,590 6 $1,510 1 Total $1,373 30 $1,083 17 1-2 Bedrooms $1,200 11 $915 11 3-4 Bedrooms $1,495 19 $1,325 6
Source: Solano County Rental Survey, April 2009
Home Sales Prices and Trends
Table 24 displays home sales data for the incorporated portions of the County as reported by
Data Quick and the San Francisco Chronicle. The home sales attributes include the number of units sold in March 2009, the median sales price in March 2009, and the price per square foot in March 2009. In order to describe the significant decline in home values, each attribute shows the percentage change from March 2008. As seen in the table, the number of units sold in each jurisdiction was much higher in March 2009 than the number of units sold in March 2008. The large increase in the number of units sold is explained by the significant decrease in the median price and the price per square foot. The median sold price of homes in the County saw an overall decrease of 39 percent in the County, while the number of units sold increased by 103 percent.
The median sales price of homes ranges from $152,000 (Vallejo) to $311,000 (Benicia). Comparing this range with the maximum affordable purchase price of Solano County residents
in Table 24, households considered low-, very low-, and extremely low-income would have
difficulty purchasing a home that is affordable. The sharp decline in the median sales price from March 2008 to 2009 has made housing affordable to moderate-income households. For example, in March 2008 the median sales price in Suisun City was $253,000, which exceeded the affordable purchase price of moderate-income households. In March 2009 the median sales price in Suisun City declined to $177,250, a price affordable to moderate-income households.
f
a
S
a
i
a
b
l
e
S
l
a
C
"
f
a
S
a
i
a
b
l
e
S
l
a
C
"
f
a
S
a
i
a
b
l
e
S
l
a
C
"
f
a
S
a
i
a
b
l
e
S
l
a
C
"
A p p e n d i x A : H o u s i n g N e e d s A s s e s s m e n t
Table 24
Solano County Housing Sales Activity, March 2009
Jurisdiction Units Sold Percentage Change 1 Median Price Percentage Change 1 Price Per Square Foot Percentage Change 1 Benicia 26 37% $311,000 -27% $183 -29% Dixon 30 233% $258,500 -14% $145 -26% Fairfield 203 73% $213,500 -40% $121 -37% Rio Vista 16 0% $171,500 -39% $124 -23% Suisun City 69 146% $177,250 -43% $114 -39% Vacaville 120 28% $250,000 -37% $152 -28% Vallejo 254 204% $152,000 -52% $108 -48%
Solano County Total 718 103% $213,500 -39% $124 -29%
Source: http://www.dqnews.com/Charts/Monthly-Charts/SF-Chronicle-Charts/ZIPSFC.aspx 1 Percentage Change refers to the change in activity from March 2008 to March 2009.
Estimated Number of Households Overpaying for Housing by Income and
Household Type
A household paying more than 30 percent of gross monthly income is considered to be burdened by housing cost and overpaying. According to the 2000 Census and shown in Table 25, 1,446 (30 percent) overpaid for housing. Of the households that overpaid for housing, 508 (32 percent) households were renter occupied and 938 (29 percent) were owner occupied. A large share of households overpaying for housing were lower-income households (households earning <80 percent median income). Of the households overpaying for housing, 1,275 (88 percent) were lower-income households.
Table 25
Unincorporated Area Households Overpaying for Housing, 2000
Renters Owners
Number Percentage Number Percentage
Estimated Lower Income Households
Overpaying (< 80% Median Income) 487 96% 1 788 84% 1
All Households Overpaying 508 32% 938 29%
Total Households 1,607 100% 3,186 100%
2000 Median Income = $54,099 Source: 2000 Census
1 Percentage share of “All Households Overpaying”