CONCENTRATION OF ADENOVIRUSES AND NOROVIRUSES FROM SEAWATER WITH ARGONIDE NANOCERAM CARTRIDGE FILTERS: METHOD EFFECTIVENESS AND OCCURRENCE IN SOUTHERN CALIFORNIA
RECREATIONAL WATERS
Christopher Gibbons
A thesis submitted to the faculty of the University of North Carolina at Chapel Hill in partial fulfillment of the requirements for the degree of Master of Science in the Department of Environmental Sciences and Engineering, Gillings School of Global Public Health.
Chapel Hill 2008
ii ABSTRACT
Christopher Gibbons
Concentration of Adenoviruses and Noroviruses from Seawater with Argonide Nanoceram Cartridge Filters: Method Effectiveness and Occurrence in Southern California Recreational
Waters
(Under the direction of Dr. Mark D. Sobsey)
iii
ACKNOWLEDGEMENTS
iv
TABLE OF CONTENTS
LIST OF TABLES...vi
LIST OF ABBREVIATIONS...vii
INTRODUCTION...1
STATEMENT OF OBJECTIVES...5
LITERATURE REVIEW...6
Introduction...6
Enteric Viruses in Seawater...6
Concentrating Viruses from Tap, Fresh-, Sea-, and Wastewaters...9
Comparison of Electronegative and Electropositive Filters...10
Elution of Viruses from the Filter...14
Reconcentration...15
Detection of Viruses...17
Summary...20
EXPERIMENTAL DESIGN...21
MATERIALS AND METHODS FOR SEEDED EXPERIMENTS...23
Viruses...23
Cartridge Filters...23
v
PEG Precipitation...25
Viral Nucleic Acid Extraction...26
Quantification of Adenovirus by Real-time PCR...26
Quantification of Norovirus by Real-time PCR...27
MATERIALS AND METHODS FOR FIELD SAMPLES...29
Sample Collection...29
Cartridge Filters...29
Elution...30
PEG Precipitation...30
Viral Nucleic Acid Extraction...31
Detection of Adenovirus by Nested PCR...31
Detection of Norovirus by Nested RT-PCR...33
Statistical Analysis...34
RESULTS FOR SEEDED EXPERIMENTS...35
Adsorption Experiments...35
Elution Experiments...36
PEG Precipitation Experiments...37
RESULTS FOR FIELD SAMPLES...40
Doheny Beach...40
Avalon Beach...41
DISCUSSION...44
CONCLUSIONS...49
vi
LIST OF TABLES
Table 1. Primers and probes used for the detection of adenovirus
and norovirus by real-time PCR...28 Table 2. Primers used for the detection of adenovirus and norovirus
by nested PCR...34 Table 3. Percent adsorption of adenovirus 41 in seawater to Argonide
Nanoceram cartridge filters...36 Table 4. Elution of adenovirus 41 with 3% beef extract using a peristaltic pump...37 Table 5. Percent recovery of adenovirus 41 with a 3-day soak in 3%
beef extract followed by elution with a peristaltic pump...37 Table 6. Elution of norovirus GII.4 with 3% beef extract using a peristaltic pump...37 Table 7. Percent recovery of adenovirus 41 and norovirus GII.4 from
seeded beef extract using PEG precipitation...38 Table 8. Percent recovery of adenovirus 41 and norovirus GII.4 from
actual eluates using PEG precipitation...39 Table 9. Chi-squared tests of independence for the correlation of
vii
LIST OF ABBREVIATIONS
µl microliters µm micrometers BE beef extract bp base pairs
CPE cytopathogenic effects DNA deoxyribonucleic acid
dNTP deoxyribonucleotide triphosphate
E. coli Escherichia coli
EDTA ethylenediaminetetraacetic acid F+ male-specific
g grams
GII.4 genogroup 2, strain 4 GuSCN guanidinium thiocyanate HAV hepatitis A virus
HCl hydrochloric acid
HEPES 4-(2-Hydroxyethyl)piperazine-1-ethanesulfonic acid in. inches
KCl potassium chloride KH2PO4 potassium phosphate
L liters
viii m2 square meters
MEM minimal essential media mg milligrams
MgCl2 magnesium chloride
ml milliliters mM millimolar
MPN most probable number mV millivolts
Na2HPO4 sodium phosphate
NaCl sodium chloride NaOH sodium hydroxide nm nanometers
NTU nephelometric turbidity units PBS phosphate buffered saline PCR polymerase chain reaction PEG polyethylene glycol PPT parts per thousand RNA ribonucleic acid rpm revolutions per minute
RT-PCR reverse transcriptase polymerase chain reaction sec seconds
ix UV ultraviolet
V volts
INTRODUCTION
The presence of human enteric viruses in recreational waters is currently a major public health concern. Viruses such as adenovirus, norovirus, rotavirus and enteroviruses are transmitted via the fecal-oral route, and may be capable of persisting in waters contaminated with fecal material for many days or longer, depending on the initial virus concentration (Fong & Lipp, 2005). These viruses are known to cause acute gastroenteritis in infected individuals, as well as other diseases (Henrickson et al., 2001). Transmission of these viruses can occur when contaminated water is accidentally ingested, or when contaminated shellfish are consumed (Griffin et al., 2003).
In order to reduce the risk of exposure in recreational water users, detection of human enteric viruses in water is crucial. Current water quality assessments are based on bacterial indicators of fecal contamination, which may not accurately predict the presence and concentration of human pathogenic viruses in water (Fong & Lipp, 2005). Therefore, the direct detection of enteric viruses by polymerase chain reaction (PCR) may be a valuable tool for determining the presence of these specific pathogens as well as others, such as bacteria and protozoan parasites.
2
37), and gastroenteritis (types 31, 40, and 41) (Rusin et al., 2000). Infected individuals spread adenoviruses via the respiratory or fecal-oral routes, because the viruses are shed in the respiratory secretions and feces of infected individuals for up to weeks after the onset of infection (Centers for Disease Control and Prevention, 2005). The serotypes that cause gastroenteritis are often found in wastewater and natural waters impacted by wastewater and urban runoff (Griffin et al., 2003; Jiang et al., 2001). Their physical structure makes
adenoviruses exceptionally resistant to disinfection and other water and waste purification procedures. Their resistance is considered to be primarily due to DNA repair, such that a damaged strand of DNA may be repaired by the host cell using the undamaged
complementary strand as a template (Fong & Lipp, 2005). In 1998, adenoviruses were added to the Environmental Protection Agency’s “Candidate Contaminant List” as part of the Safe Drinking Water Act, and are currently one of only four viruses or virus groups included in the list (the others being caliciviruses, coxsackieviruses, and echoviruses).
Noroviruses, previously known as “Norwalk-like viruses,” are small (25-40 nm), non-enveloped, single-stranded RNA viruses. They are members of the Caliciviridae family, and are genetically classified into five different genogroups (GI, GII, GIII, GIV, and GV), which are further divided into genotypes. Of these, only genogroups I, II, and IV are known to contain human strains (Atmar & Estes, 2006). Human noroviruses have traditionally been difficult to study because they cannot easily be propagated in cell cultures or in experimental animals (Estes et al., 2000; Haramoto et al., 2004; Straub et al., 2007). Symptoms of
3
the onset of infection (Rockx et al., 2002). Noroviruses have frequently been found in treated wastewater and natural waters contaminated with fecal material (Beller et al., 1997; da Silva et al., 2007; Griffin et al., 2003; Lodder et al., 1999). This may be due to the fact that these viruses are resistant to some forms of chlorine disinfection, and can withstand freezing, as well as temperatures as high as 60˚ C (Griffin et al., 2003; Thornton et al., 2004).
In order to detect human enteric viruses in water using PCR analysis or other assay methods, the viruses must first be concentrated. This is due to the fact that enteric viruses are present only in low concentrations in recreational waters, and detection is limited by the volume that can be analyzed by PCR or other assay methods. Primary virus concentration from water is often achieved using filter adsorption-elution methods. Under the appropriate conditions, viruses in water will adsorb to positively-charged filters, and the adsorbed viruses may then be eluted using an alkaline solution of organic matter such as beef extract at pH 9.5 (Schwab et al., 1995). The effectiveness of this method depends on the efficiency of
adsorption of the virus particles to the filter, and the efficiency of adsorbed viral particle recovery during elution.
Secondary concentration of the viruses is typically achieved by using a method such as polyethylene glycol (PEG) precipitation or organic flocculation. PEG precipitation creates saturated conditions in which proteins as well as viral particles precipitate from solution (Lewis & Metcalf, 1988). Centrifugation allows separation of the PEG-containing
4
separation of viruses and precipitable proteins from the supernatant (Katzenelson et al., 1976).
In this study, positively-charged Argonide Nanoceram alumina cartridge filters were evaluated for the recovery of adenoviruses and noroviruses from seawater. PEG
STATEMENT OF OBJECTIVES
• Evaluate the use of Argonide Nanoceram positively-charged cartridge filters as a means of primary concentration of adenoviruses and noroviruses in seeded water samples
• Determine the effectiveness of beef extract as an eluent for recovery of viruses adsorbed to Argonide Nanoceram filters under various conditions
• Evaluate the use of PEG as a secondary concentration method for viruses in eluates from Argonide Nanoceram filters
• Determine the presence or absence of adenovirus and norovirus in seawater samples from two fecally contaminated Southern California beaches, Doheny Beach and Avalon Beach, using these methods in conjunction with (RT-)PCR analysis
LITERATURE REVIEW
Introduction
The presence of human enteric viruses in coastal waters represents a serious health risk to swimmers and other recreational water users. By monitoring these areas for the presence of human pathogens, preventative actions can be taken to reduce the risk of human exposure. The studies summarized in this review are related to the concentration and detection of enteric viruses in water, and the practical application of each method under the environmental conditions associated with seawater.
Enteric Viruses in Seawater
7
because enteric viruses generally tend to be more resistant to disinfection procedures than bacteria (Fong & Lipp, 2005).
Some researchers have suggested using coliphages as indicators of fecal
contamination in water. Coliphages are a type of bacteriophage that infects coliform bacteria present in the gut of warm-blooded animals, and are therefore frequently present in waters contaminated with fecal material. Because coliphages are viruses, they are generally more resistant to disinfection procedures than fecal indicator bacteria. Therefore, it has been suggested that their presence may more accurately indicate the presence of enteric viral pathogens, since enteric viruses are also resistant to disinfection. Two types of coliphages that have been considered as potential indicators of viral pathogens in water are somatic coliphages and male-specific (F+) coliphages. Somatic coliphages are a heterogenous group of bacteriophages that infect E. coli bacteria by attaching to a specific receptor site on the cell wall, whereas F+ coliphages are only infectious to “male-specific” bacteria possessing the F-plasmid, as they attach to a specific receptor site of the sex pilus (Leclerc et al., 2000). A number of studies have reported a positive association between human enteric viruses and somatic (Moce-Llivina et al., 2005; Skraber et al., 2004) or F+ coliphages (Colford et al., 2007; Dore et al., 2000; Jiang et al., 2001) in waters contaminated with fecal pollution. However, some uncertainty remains concerning the comparative survival of coliphages and human enteric viruses in natural aquatic environments due to factors such as removal of viruses by microbial predation and inactivation of viruses by solar radiation.
8
untreated sewage will be discharged directly into the receiving waters (Rodriguez, 2007). This phenomenon may also be observed in separate sewer systems if storm water leaks into the sewage system. Seawater may also become contaminated by urban, rural and agricultural runoff and subsurface seepage during storm events, which can carry pathogenic viruses from the land into streams and rivers, which eventually drain into the ocean (Fong & Lipp, 2005).
Once they reach the ocean, pathogenic human viruses may be able to persist for many days or weeks in a marine environment. For example, Enriquez et al. (1995) determined that poliovirus type 1 and adenoviruses 40 and 41 could survive in seawater at 15˚ C for 18, 77 and 85 days, respectively, before 99% reductions were observed. In addition to this survival study, numerous studies have demonstrated the presence of human enteric viruses in coastal waters impacted by wastewater or urban runoff (Goyal et al., 1979; Griffin et al., 1999; Jiang et al., 2001), and in estuaries that discharge directly into the ocean (Lodder & de Roda Husman, 2005; Noble et al., 2006).
The presence of human enteric viruses in seawater represents a serious health risk to recreational water users (Griffin et al., 1999; Griffin et al., 2003; Henrickson et al., 2001; Schaub & Oshiro, 2000). In addition, many studies have shown that certain human enteric viruses become concentrated in the tissues of bivalve mollusks such as oysters and mussels (Goyal et al., 1979; Myrmel et al., 2004; Pina et al., 1998). This phenomenon can lead to human disease following the consumption of contaminated shellfish (Griffin et al., 2003).
9
However, these methods are limited by the volume that can be analyzed, and most viruses are present in relatively low concentrations in environmental waters. Therefore, viruses must be concentrated before detection by these methods is feasible.
Concentrating Viruses from Tap, Fresh-, Sea-, and Wastewaters
The four basic steps often used for detecting viruses in water samples are concentration by filtration, elution or other recovery of viruses from the filter,
reconcentration, and viral detection and assay (Pepper et al., 2000). Because virus particles are very small, filtration is usually dependent upon either ultrafiltration to physically retain viruses by exclusion, or adsorption to microporous filters by electrostatic or hydrophobic interactions between the viruses and the filter medium rather than physical entrapment or size exclusion. The initial volume which must be concentrated is usually dependent upon the anticipated number of virus particles present in the water, which usually depends on the type of water being processed. For example, treated wastewaters are likely to contain more viruses than natural waters, and far more viruses than treated tap water. Therefore, greater volumes of tap or natural waters must be filtered relative to wastewaters in order to
10
Another important consideration when concentrating viruses based on electrostatic interactions is the isoelectric point and charge density or zeta potential of the viruses. Viral capsids contain numerous electrical charges as a result of the amino acid functional groups present in the surface proteins, most notably carboxyl, amino and sulfhydryl groups. Overall, these ionizable functional groups confer a net negative charge to viruses in solutions near neutral pH. However, if the pH of the solution is lowered, these surface proteins undergo protonation, and in some cases a conformational shift that results in a net positive charge (Reynolds & Pepper, 2000). The pH at which this transition between negative and positive charge occurs and there is a zero net charge is known as the isoelectric point. This surface charge-related ionic behavior may be utilized in order to capture viral particles on either negatively- or positively-charged filter materials when concentrating viruses from water.
Comparison of Electronegative and Electropositive Filters
11
viruses and the membrane. At neutral pH, both the viruses and the filter possessed an overall negative charge and would repel one another, but lowering the pH caused the viruses to become positively-charged and therefore adsorb to the negative membrane (Sobsey & Jones, 1979). In addition, it was speculated that by adding multivalent cation salts to the water, the multivalent cations in solution served as a mediator between the negative surfaces and thereby allowed viral adsorption. The use of electronegative filters was expanded when Payment et al. (1976) applied this method to the concentration of polioviruses from seawater. In this study, poliovirus was seeded into 100-gallon samples of highly turbid estuarine water collected from the Gulf of Mexico, and the water was acidified to pH 3.5 and supplemented with 0.0015 M aluminum chloride to promote adsorption to Filterite filters. The adsorbed viruses were eluted with an alkaline solution, and virus recovery rates of 48-58% were reported. Numerous studies were conducted in subsequent years reporting the successful adsorption and recovery of enteric viruses from electronegative filters using large volumes of tap water (Farrah et al., 1976; Gerba et al., 1978), seawater (Farrah et al., 1977; Gerba et al., 1978; Goyal et al., 1979; Goyal & Gerba, 1983; Reynolds et al., 1995), and treated sewage (Gerba et al., 1978). Although most of these studies focused on the concentration of enteroviruses, such as poliovirus, echovirus, and coxsackievirus, Goyal & Gerba (1983) demonstrated that rotaviruses could also be concentrated from seawater using Filterite filters, with an overall recovery of 99% in seeded samples.
12
first suggested by Sobsey & Jones (1979). They hypothesized that viruses, which are
naturally negatively-charged near neutral pH, would adsorb to positively-charged membranes without acidification of the water or the addition of multivalent cation salts. To support this hypothesis, they seeded poliovirus into tap water at ambient pH levels and succeeded in recovering the viruses from Zeta Plus filters with a 66% recovery rate. The concept of using electropositive filters for the recovery of viruses from water was quickly adopted by other researchers. Logan et al. (1981) used Zeta Plus filters to concentrate bacteriophages from seeded samples of natural river water with an estimated recovery of 75%, although the recovery was somewhat lower when the pH of the water was greater than 8. That same year, Chang et al. (1981) used Zeta Plus filters to successfully concentrate naturally-occurring enteroviruses from as much as 30 gallons of wastewater effluent collected from a wastewater treatment plant. Soon after, positively-charged filters were being used to concentrate
rotaviruses from tap water using Zeta Plus and 1MDS filters (Guttman-Bass & Armon, 1983; Toranzos & Gerba, 1989). In addition, adenoviruses were detected by Pina et al. (1998) in 14 out of 15 (93%) raw sewage samples collected in Barcelona, Spain, in 2 out of 3 samples of primary treated wastewater effluent, and in 6 out of 20 river water samples collected near the point of wastewater discharge using Zeta Plus filters.
13
later, Sobsey & Glass (1984) performed another comparative experiment in which enteroviruses, echoviruses and adenoviruses were seeded into raw or treated lake water. They reported that overall, enterovirus recovery was slightly higher with 1MDS filters, but that adenovirus and echovirus recovery was slightly higher with Filterite filters. The major conclusion from this study was that neither filter is superior for all virus types and water conditions. That same year, Rose et al. (1984) tested the efficiency of Filterite, Zeta Plus and 1MDS filters for the recovery of naturally-occurring coliphages from primary (pH 7.4) and secondary (pH 6.8) sewage. They found that the positively-charged filters were superior in recovering these viruses from secondary sewage, and that there was no significant difference in recovery efficiency among different filters for viruses in primary sewage. The following year, Sobsey et al. (1985) conducted a study to determine recovery of hepatitis A virus (HAV) in drinking water at various pH levels. Under optimal conditions (pH 3.5 for Filterite filters, pH 4.5-6.5 for 1MDS filters), both filters adsorbed viruses efficiently (>97% for both). However, adsorption rates to 1MDS filters decreased significantly at higher pH levels (82% at pH 7.5, 43% at pH 8.5). In 1995, Enriquez & Gerba (1995) tested both types of filter for the recovery of human adenoviruses from tap water (pH 7.5), and obtained
14
Based on these comparative studies, it seems that neither type of filter, positively-charged or negatively-positively-charged, is ideal for all viruses, water types, and environmental
conditions. Positively-charged filters are easier to use than negatively-charged filters, and do not require acidification of the water prior to filtration, which may promote inactivation of viral particles. However, electropositive filters may be inefficient when concentrating viral particles at elevated pH levels (>7.5) or in the presence of salts such as sodium chloride and magnesium chloride. Due to these limitations, the development of a new adsorbent filter capable of concentrating different viruses from a variety of water types and pH levels would be greatly advantageous.
Elution of Viruses from the Filter
15
of these two properties, a beef extract solution and alkaline pH conditions (i.e. 0.3-3% beef extract solution containing 0.05 M glycine at pH 9.5) (Abbaszadegan et al., 1993; Enriquez & Gerba, 1995; Sobsey & Glass, 1980; Sobsey & Glass, 1984; Sobsey et al., 1985). Although this method has been proven effective in a number of studies, it is important to realize that successful elution is ultimately dependent on several factors, including the type of virus, the type of filter, and the presence of salts and organic materials which may affect the elution process. Therefore, it is always advisable to test the effectiveness of an eluent for each set of recovery conditions before proceeding with a field experiment.
Reconcentration
Because viruses are often present in the environment in very low numbers, it is frequently necessary to further concentrate the viruses in the filter eluent. Several reconcentration methods have been studied, including a second step of microfilter adsorption-elution, ultrafiltration, organic flocculation, and PEG precipitation.
16
Organic flocculation was first described by Katzenelson et al. (1976). They discovered that lowering the pH of a protein solution (such as beef extract) to 3.5 will produce flocculation of proteins, and the viruses in solution will naturally bond reversibly to these proteins. After lowering the pH, they centrifuged the beef extract solution in order to separate the proteins and viruses from the remaining liquid, and the pellet was resuspended in a sodium phosphate (Na2HPO4) solution. Using this method, they reported nearly a 100%
recovery of poliovirus from 300 ml of a 3% beef extract solution. Since its discovery, this method has been used by many scientists to successfully reconcentrate enteroviruses
(Abbaszadegan et al., 1993; Guttman-Bass & Nasser, 1984; Reynolds et al., 1995; Sobsey & Glass, 1980), rotaviruses (Goyal & Gerba, 1983; Guttman-Bass & Armon, 1983; Toranzos & Gerba, 1989), adenoviruses (Enriquez & Gerba, 1995), noroviruses (Griffin et al., 1999), and HAV (Sobsey et al., 1985) from beef extract solution eluates. Notable drawbacks to this method are that the process of lowering the pH to 3.5 may cause inactivation of acid-sensitive viruses and precipitate other material from solution that can interfere with subsequent steps for virus recovery and assay.
Polyethylene glycol (PEG) precipitation was carefully described as a method of reconcentrating human enteric viruses from eluates by Lewis & Metcalf (1988), but the method has been used for several decades to concentrate and purify a variety of viruses from various aqueous solutions (Adams, 1973; Friedmann and Haas, 1970; McSharry and
17
and the pellet was resuspended in a sodium phosphate (Na2HPO4) solution. For the
freshwater samples, mean recoveries were 93%, 78% and 73% for rotavirus, hepatitis A virus and poliovirus, respectively. For the estuarine samples, mean recoveries were 61%, 95% and 64%, respectively. Optimum virus recovery was dependent on sample type in combination with PEG concentration and sodium chloride (NaCl) concentration. Since then, many other studies have used this method to effectively reconcentrate viruses (Atmar et al., 1993; da Silva et al., 2007; Schwab et al., 1995). PEG precipitation and organic flocculation were directly compared by Enriquez & Gerba (1995) for concentrating adenoviruses from tap water. They reported a 38.6% recovery using organic flocculation, and a 40% recovery using PEG precipitation, and concluded that these results were not significantly different. The combined results of these studies seem to indicate that PEG precipitation is an effective reconcentration step and that it may be performed at ambient pH levels, so inactivation of viruses is less likely to occur than with the organic flocculation method, which requires acidification to a pH of about 3.5.
Detection of Viruses
Cell culture assays have traditionally been used by many researchers to detect
18
cell line and propagate. Depending on the virus being analyzed, this may promote cell lysis, or it may produce visible changes in the cell morphology (Josephson et al., 2000). The limitations of this method are that it is costly and time-consuming, and some viruses, such as hepatitis A virus and human norovirus, are very difficult if not impossible to propagate in any cell lines currently available (Estes et al., 2000; Haramoto et al., 2004). In addition, cell lines are to varying degrees susceptible to toxic compounds present in environmental samples. Such cytotoxicity can potentially lead to false positive results if cytotoxic effects are
interpreted as viral cytopathogenic effects (CPE) or false negative results if cell death occurs prior to virus replication.
19
et al., 2004). In this case, two PCR reactions are performed in succession to generate a more specific and highly amplified final product. Although all these forms of conventional PCR are highly sensitive and accurate, none of them provide quantitative data. The only way to quantify the number of viruses or amount of viral nucleic acid using these methods is by applying PCR or RT-PCR amplification to a dilution series of the sample in order to determine the last (greatest) dilution that yields a positive result. This approach allows for the estimation of virus or viral nucleic acid in the sample by endpoint dilution or Most Probable Number (MPN) quantification.
Another approach for determining the approximate number of virus particles present in the sample is quantitative PCR, otherwise known as real-time PCR. Real-time PCR is similar to conventional PCR, except an internal probe is added to the master mix that releases fluorescent light in proportion to the quantity of genetic material being replicated (Mackay et al., 2002). The real-time PCR instrument detects and quantifies the magnitude of the
fluorescent light emitted by the amplified nucleic acid, and provides data that may be used to generate quantitative results.
20
unable to completely remove them all, which can potentially lead to false negative results (Abbaszadegan et al., 1993).
Summary
No concentration method is ideal or optimal for all viruses, water types, and
EXPERIMENTAL DESIGN
Virus adsorption experiments were performed to test the effectiveness of Argonide Nanoceram cartridge filters for concentrating adenoviruses and noroviruses from seawater. Based on the concentrations of viruses in experimentally seeded test waters applied to filters and in the filtrates, the percent adsorption for each virus was estimated. Next, a series of experiments was conducted to determine the effectiveness of beef extract as an eluent for viruses adsorbed to the Argonide Nanoceram filters. The adsorbed viruses were eluted by continuously circulating a volume of beef extract solution at various pH levels through the filter using a peristaltic pump. For some experiments, a non-ionic detergent (Tween 80) was added to the eluent. PEG precipitation with different concentrations of PEG and sodium chloride (NaCl) was then evaluated as a secondary concentration step for viruses in the filter eluate. The percent recovery of initial viruses in seeded test seawater was determined for each virus under each set of experimental conditions using real-time PCR for adenoviruses and RT-PCR for noroviruses.
22
filter adsorption-elution and then PEG precipitation. The viruses were then detected in the resulting concentrated samples using nested PCR and RT-PCR for adenoviruses and
MATERIALS AND METHODS FOR SEEDED EXPERIMENTS
Viruses
Adenovirus type 41 was propagated in G293 cells provided by the Centers for
Disease Control and Prevention. The cells were grown in a minimal essential media (MEM) containing 1% glutamine and non-essential amino acids, 1% HEPES buffer, 1.5% sodium bicarbonate, and 10% fetal bovine serum. After propagating the virus, the virus suspension was purified by freezing and thawing, followed by chloroform extraction and centrifugation for 20 minutes at 4˚ C and 3000 x g. Norovirus genogroup II strain 4 (GII.4) was isolated from stool samples collected from a 2004 norovirus outbreak at a nursing home in Forsyth County, North Carolina. It was used as a 10-18% stool suspension in PBS that was then centrifuged for 20 minutes at room temperature and 3000 x g. The supernatant was then collected, aliquoted and frozen at -80˚ C.
Cartridge Filters
24
unseeded seawater were passed through each cartridge filter, and the filtrate was discarded. Then, 500 ml of water seeded with adenovirus and norovirus were filtered, followed by an additional 5.5 L of unseeded water. Seawater was collected near Wilmington, North
Carolina. The pH of the seawater was 7.95, the turbidity was 2.4 NTU, and the salinity was 27 PPT. Seawater was passed through the filter at a rate of approximately 25 L per minute using a 0.3 horsepower Emerson self-priming pump (ITT Jabsco, St. Louis, MO) with Nalgene 0.5 inch braided polypropylene tubing (Nalgene, Rochester, NY) and Swagelok stainless steel Quick-Connects (Swagelok Company, Solon, OH). Challenge water influent, filter effluent, and filter eluates were collected and assayed by real-time PCR for the
quantification of adenovirus and norovirus.
Elution
25
peristaltic pump. This experiment was done to model the transport of filters that had been used to process California seawaters, which were supplemented with beef extract and shipped on freezer packs via air express to this University of North Carolina laboratory.
PEG Precipitation
Beef extract solution was prepared as described previously (pH 7.3) and seeded with 108 to 1010 PCR units adenovirus and 106 to 107 RT-PCR units norovirus. The seeded beef extract was sampled for real-time PCR analysis, and then split into 250 ml volumes and placed into Corning 250 ml polypropylene disposable conical bottles (Corning Inc., Corning, NY). Six percent or 9% PEG molecular weight 8000 (Fisher Scientific, Fair Lawn, NJ) and 0.1 M or 0.3 M sodium chloride (NaCl) were added to each bottle, and the bottles were shaken continuously overnight at 200 rpm and 4˚ C using a Lab-Line platform shaker
(Barnstead International, Dubuque, IA). The bottles were then centrifuged for 1 hour at 4˚ C and 5100 x g. One ml of the supernatant was sampled and the rest was discarded, and the pellet was resuspended in 2 ml of phosphate buffered saline (PBS). One liter of PBS contains 8 g sodium chloride (NaCl), 0.2 g potassium chloride (KCl), 0.12 g potassium phosphate (KH2PO4), and 0.91 g anhydrous sodium phosphate (Na2HPO4). The resuspended
PEG precipitate was sampled for real-time PCR analysis, and percent recoveries were determined for each set of experimental conditions by dividing the (RT-)PCR units in the resuspended PEG precipitate by the (RT-)PCR units in the spiked beef extract and
26 Viral Nucleic Acid Extraction
The viral nucleic acid was chemically extracted from 100 µl of each sample using a
guanidinium thiocyanate (GuSCN) extraction method adapted from Boom et al. (1990). DNA and RNA were both extracted simultaneously using this same method. One-hundred
microliters of the sample were mixed with 100 µl of the GuSCN extraction buffer. The
GuSCN extraction buffer contains 120 g of guanidinium thiocyanate, 100 ml of TE Buffer pH 8.0 (Ambion, Austin, TX), 55 mM sodium chloride, 33 mM sodium acetate, and 4.4 mg of polyadenylic acid (5’) potassium salt for a total volume of 240 ml. Each sample was vortexed for 15 seconds and incubated at room temperature for 10 minutes. Then, 0.2 ml of 100% ethanol were added and the mixture was vortexed for 15 seconds. The solution was transferred to a HiBind RNA minicolumn (E.Z.N.A. RNA isolation system, OMEGA Bio-Tek, Doraville, GA) and centrifuged at 16,000 x g for 1 minute. The filtrate was discarded, and the column containing the nucleic acid was washed by loading 0.5 ml of 75% ethanol into the column, centrifuging for 1 minute at 16,000 x g, and then discarding the filtrate. This ethanol wash step was repeated twice more, for a total of three ethanol wash steps. The column was centrifuged for 2 minutes at 16,000 x g to dry the remaining ethanol, and then
the nucleic acids were eluted from the column with 50 µl of nuclease free water and stored at -80˚ C until analyzed.
Quantification of Adenovirus by Real-time PCR
27
Thermocycling conditions for the reaction consisted of 45 cycles of 10 sec at 95˚ C, 30 sec at 58˚ C, and 15 sec at 72˚ C. A series of 10-fold dilutions of the virus stock was analyzed by PCR to generate a series of Ct values and thereby create a dilution curve relating virus concentrations and Ct values. The equation of the curve was log10 VP = -0.2814 * Ct +
12.256, where VP is the estimated viral particles and Ct is the value generated by the real-time PCR machine. The correlation was R2 = 0.9986. For the real-time PCR, the Qiagen Quantitech probe PCR kit (Qiagen, Valencia, CA) was used as described by the manufacturer
for a total volume of 25 µl, including 2 µl of the extracted viral nucleic acid. A Smart Cycler (v. 2.0c, Cepheid, Sunnyvale, CA) was used for running the real-time PCR analysis.
Quantification of Norovirus by Real-time RT-PCR
The primers and real-time RT-PCR conditions used to detect norovirus genogroup II strain 4 (GII.4) were obtained from Jothikumar et al. (2005b). The primers and probe used for norovirus are summarized in Table 1. The viral RNA was held at 50˚ C for 30 minutes to initiate reverse transcription, and then incubated at 95˚ C for 15 minutes to activate the polymerase. Thermocycling conditions for the reaction consisted of 45 cycles of 10 sec at 95˚ C, 20 sec at 55˚ C, and 15 sec at 72˚ C. A series of 10-fold dilutions of the 10-18% norovirus stool suspension was analyzed by RT-PCR to generate a series of Ct values and thereby create a dilution curve relating virus concentrations and Ct values. The equation of the curve was log10 VP = -0.2726 * Ct + 10.362, where VP is the estimated viral particles and
28
was used as described by the manufacturer for a total volume of 25 µl, including 2 µl of the
extracted viral nucleic acid.
Table 1. Primers and probes used for the detection of adenovirus and norovirus by real-time PCR
Virus Primer/Probe
Working
Conc. Name Sequence (5′ - 3′) Position
Adenovirus 41 Forward Primer 1 µM JTVXF GGA CGC CTC GGA GTA CCT GAG 271-291 Reverse Primer 1 µM JTVXR ACI GTG GGG TTT CTG AAC TTG TT 344-366
Probe 0.1 µM JTVXP CTG GTG CAG TTC GCC CGT GCC A 299-320
Norovirus II.4 Forward Primer 1 µM JJGII CAA GAG TCA ATG TTT AGG TGG ATG AG 5003-5028 Reverse Primer 1 µM COG2R TCG ACG CCA TCT TCA TTC ACA 5080-5100
MATERIALS AND METHODS FOR FIELD SAMPLES
Sample Collection
Forty-liter volumes of seawater were collected from the waters of Doheny Beach, and Avalon Beach, California. Samples were labeled according to the collection site (5 sites for Doheny Beach, 3 sites for Avalon Beach), collection date, and collection time (7 AM, 1 PM or 3 PM for Doheny Beach, 8 AM, 12 PM or 3 PM for Avalon Beach). For Doheny Beach, 93 samples were collected from June through July, 2007. For Avalon Beach, 286 samples were collected from July through September, 2007.
Cartridge Filters
30
on ice overnight to the University of North Carolina laboratory (Chapel Hill, North Carolina).
Elution
A 3% beef extract solution in reagent water (BBL Beef Extract Powder, catalog number 212303, Becton, Dickinson and Company, Sparks, MD) containing 0.1 M glycine (pH 7.3) was used for all field samples. Viruses were eluted using a peristaltic pump as described for the seeded water samples. Five hundred milliliters of beef extract were used to elute each filter, including the 350 ml shipped in each cartridge housing, and 150 ml added at the North Carolina laboratory. The pH of the beef extract was adjusted to approximately 9.7 using a 5 M NaOH solution at the beginning of the elution, and declined naturally to
approximately 9.5 by the end of the elution period. At the end of the elution period, the pH of the eluent was adjusted to 7.3 using a 5 M HCl solution. The pH meter probe was
sterilized between samples by submerging the probe in 0.1 M HCl for 2 minutes. The eluent was then stored at -20˚ C for further processing.
PEG Precipitation
31
g. The supernatant was discarded, and the pellet was resuspended in 2 ml of PBS per bottle. The resuspended pellet was collected and stored at -80˚ C.
Viral Nucleic Acid Extraction
The viral nucleic acid was chemically extracted from 1.2 ml of the concentrate from the Doheny Beach, California samples and from 0.2 ml of the concentrate from the Avalon Beach, California samples. In both cases the nucleic acid (both DNA and RNA) was extracted using the guanidinium thiocyanate (GuSCN) extraction method previously described, except that two or three HiBind RNA minicolumns (E.Z.N.A. RNA isolation system, OMEGA Bio-Tek, Doraville, GA) were used for each sample due to the larger volumes. For the Doheny Beach samples, 1.2 ml of the sample were mixed with 1.2 ml of the GuSCN extraction buffer, and incubated at room temperature for 10 minutes. Then, 2.4 ml of 100% ethanol were added and the mixture was vortexed for 15 seconds, and then divided evenly into 3 minicolumns. For the Avalon Beach samples, 200 µl of the sample were mixed with 200 µl of the GuSCN extraction buffer, and incubated at room temperature for 10 minutes. Then, 400 µl of 100% ethanol were added and the mixture was vortexed for 15 seconds, and then divided evenly into 2 minicolumns.
Detection of Adenovirus by Nested PCR
32
reaction, 15 µl of the extracted viral nucleic acid were mixed with 5 µl 10X PCR buffer with
15 mM MgCl2, 10 µl 5X Q solution, 0.5 µl 25 mM MgCl2, 1 µl of 10 mM each dNTP, 1 µl
each of 50 µM Hex1 and Hex2, 0.2 µl of 5 units/µL Hot Star Taq, and 16.3 µl water, for a
total volume of 50 µl. For the second reaction, 2 µl of the product from the first reaction were mixed with 5 µl 10X PCR buffer with 15 mM MgCl2, 0.5 µl 25 mM MgCl2, 1 µl of 10
mM each dNTP, 1 µl each of 50 µM Hex1 and Hex3, 0.2 µl of 5 units/µl Hot Star Taq, and 39.3 µl water, for a total volume of 50 µl. The PCR conditions for adenovirus were identical for the first and second reactions. The reaction mixture was incubated at 94˚ C for 10
minutes to activate the Taq polymerase. Thermocycling conditions for the reaction consisted of 40 cycles of 15 sec at 94˚ C, 15 sec at 50˚ C, and 30 sec at 72˚ C, with a final extension step of 72˚ C for 7 minutes. A Peltier Thermal Cycler (MJ Research, Waltham, MA) was used for performing the nested PCR analysis.
33 Detection of Norovirus by Nested RT-PCR
The primers and nested PCR conditions used to detect norovirus were obtained from Vinje et al. (2004) for the first reaction and from Maloney (2006) for the second reaction. The primers used for both reactions are summarized in Table 2. A Qiagen One-Step RT-PCR Kit and a Qiagen Hot Star Taq DNA Polymerase kit (Qiagen, Valencia, CA) were used as described by the manufacturer. For the first reaction, 5 µl of the extracted viral nucleic acid were mixed with 5 µl 5X Qiagen One-Step RT-PCR buffer, 5 µl 5X Q solution, 1 µl of 10 mM each dNTP, 1 µl each of 50 µM MJV12 and RegA, 1 µl Qiagen enzyme mix
(provided in the kit), 0.25 µl Rnasin (RNase inhibitor), and 5.75 µl water, for a total volume of 25 µl. The viral RNA was held at 50˚ C for 30 minutes to initiate reverse transcription, and then incubated at 94˚ C for 15 minutes to activate the polymerase. Thermocycling conditions for the reaction consisted of 40 cycles of 15 sec at 94˚ C, 15 sec at 50˚ C, and 30 sec at 72˚ C, with a final extension step of 72˚ C for 7 minutes. For the second reaction, 2 µl of the product from the first reaction were mixed with 5 µl 10X PCR buffer with 15 mM MgCl2, 1 µl of 25 mM magnesium chloride (MgCl2), 1 µl of 10 mM each dNTP, 1 µl each of
34 Statistical Analysis
Chi-squared tests of independence were performed using Minitab Statistical Software (Minitab Inc., State College, PA) to determine whether or not the presence of adenovirus was associated with the presence of norovirus in the samples, and whether the presence of these human enteric viruses was associated with the presence of somatic or male-specific (F+) coliphages. The presence of these coliphages was determined in a 1 L volume by overnight enrichment in a multiple volume format of 3 x 300 ml, 3 x 30 ml and 3 x 3 ml (EPA method 1601). These data were then used to determine whether or not somatic or F+ coliphages were predictors of human enteric viruses in the samples collected, and the likelihood that the enteric viruses found in the samples originated from the same source of contamination.
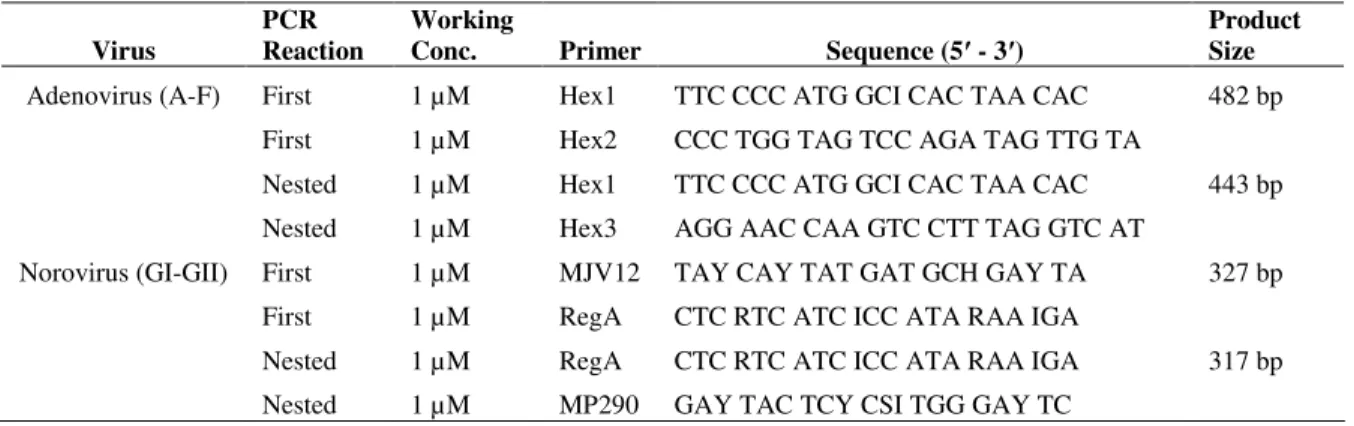
Table 2. Primers used for the detection of adenovirus and norovirus by nested PCR
Virus
PCR Reaction
Working
Conc. Primer Sequence (5′ - 3′)
Product Size
Adenovirus (A-F) First 1 µM Hex1 TTC CCC ATG GCI CAC TAA CAC 482 bp
First 1 µM Hex2 CCC TGG TAG TCC AGA TAG TTG TA
Nested 1 µM Hex1 TTC CCC ATG GCI CAC TAA CAC 443 bp
Nested 1 µM Hex3 AGG AAC CAA GTC CTT TAG GTC AT
Norovirus (GI-GII) First 1 µM MJV12 TAY CAY TAT GAT GCH GAY TA 327 bp
First 1 µM RegA CTC RTC ATC ICC ATA RAA IGA
Nested 1 µM RegA CTC RTC ATC ICC ATA RAA IGA 317 bp
RESULTS FOR SEEDED EXPERIMENTS
Adsorption Experiments
36
Table 3. Percent adsorption of adenovirus 41 in seawater to Argonide Nanoceram cartridge filters
Elution Experiments
The results of the elution experiments are shown in Table 4 and Table 5 for
adenovirus 41, and in Table 6 for norovirus GII.4. The concentration of each virus in PCR or RT-PCR units in the seeded seawater was estimated using the Ct value of the viral stock solution, and the eluent was sampled for quantitative analysis by real-time PCR or RT-PCR. The concentration of viruses in the 20-40 L of spiked seawater was below the detection limit of the PCR assay. Average percent recoveries for adenovirus with immediate elution were 3.2% (± 2.3%), 1.0% (± 0.30%) and 0.69% (± 0.40%) using beef extract, beef extract with 0.1% Tween 80 and beef extract with 0.01% Tween 80, respectively. The average percent recovery for adenovirus with a 3-day soak in beef extract prior to elution was 0.69% (± 0.17%). Average norovirus percent recoveries with immediate elution were 111% (± 29%), 119% (± 26%) and 88% (± 24%) using beef extract, beef extract with 0.1% Tween 80 and beef extract with 0.01% Tween 80, respectively. Norovirus recovery could not be
determined for the 3-day soak experiments because the virus stock used in previous
experiments was exhausted and the titer of the new norovirus stock solution was too low for detection in the eluate by real-time RT-PCR. The addition of Tween 80 did not improve elution of either virus from the filter.
Trial Virus in Influent (500 ml) Virus in Filtrate (6 L) Percent Adsorption
1 2.3x10⁹ 3.8x10⁷ 98.3%
2 2.2x10⁹ 6.5x10⁷ 97.0%
3 2.6x10⁹ 6.5x10⁷ 97.5%
37
Table 4. Elution of adenovirus 41 with 3% beef extract using a peristaltic pump
a
3% BE = 3% beef extract – 0.1M glycine eluent at pH 9.5 with and without 0.1% - 0.01% Tween 80
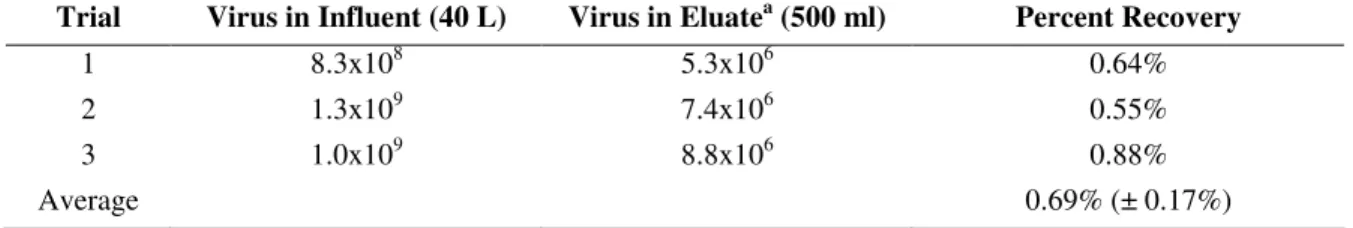
Table 5. Percent recovery of adenovirus 41 with a 3-day soak in 3% beef extract followed by elution with a peristaltic pump
Trial Virus in Influent (40 L) Virus in Eluatea (500 ml) Percent Recovery
1 8.3x10⁸ 5.3x10⁶ 0.64%
2 1.3x10⁹ 7.4x10⁶ 0.55%
3 1.0x10⁹ 8.8x10⁶ 0.88%
Average 0.69% (± 0.17%)
a
Eluate = 3% beef extract with 0.1M glycine
Table 6. Elution of norovirus GII.4 with 3% beef extract using a peristaltic pump
a
3% BE = 3% beef extract – 0.1M glycine eluent at pH 9.5 with and without 0.1% - 0.01% Tween 80
PEG Precipitation Experiments
The results of the PEG precipitation experiments are shown in Table 7. For
adenovirus, average percent recoveries were 10% (± 3.6%), 36% (± 14%), 42% (± 13%), and 89% (± 20%) using 6% PEG - 0.1 M NaCl, 6% PEG - 0.3 M NaCl, 9% PEG - 0.1 M NaCl,
Elution replicates - % recovered Eluent a
Estimated Adenovirus
input
(PCR units) 1 2 3 4
Average adenovirus %
recovered (± st dev)
3% BE 1.0x10⁹ 4.6% 1.9% 5.7% 0.65% 3.2% (± 2.3%)
3% BE, 0.1% Tween 80 1.0x10⁹ 1.0% 0.61% 1.2% 1.3% 1.0% (± 0.30%)
3% BE, 0.01% Tween 80 1.0x10⁹ 1.3% 0.46% 0.58% 0.43% 0.69% (± 0.40%)
Elution replicates - % recovered Eluent a
Estimated Norovirus input
(PCR units) 1 2 3 4
Average norovirus %
recovered (± st dev)
3% BE 3.5x10⁶ 86% 88% 133% 139% 111% (± 29%)
3% BE, 0.1% Tween 80 3.5x10⁶ 95% 140% 99% 141% 119% (± 26%)
38
and 9% PEG - 0.3 M NaCl, respectively. For norovirus, average percent recoveries were 38% (± 3.7%), 43% (± 7.3%), 51%, and 69% (± 4.0%) using 6% PEG - 0.1 M NaCl, 6% PEG - 0.3 M NaCl, 9% PEG - 0.1 M NaCl, and 9% PEG - 0.3 M NaCl, respectively. The standard deviation is not given for one experiment because a bottle broke in the centrifuge, resulting in only two experimental replicates. The highest recoveries for both viruses were observed using 9% PEG and 0.3 M NaCl (unpaired t-test, p < 0.05).
Table 7. Percent recovery of adenovirus 41 and norovirus GII.4 from seeded beef extract using PEG precipitation
6% PEG 9% PEG
0.1 M NaCl 0.3 M NaCl 0.1 M NaCl 0.3 M NaCl
Adenovirus 41 (n=4) 10% (± 3.6%)* 36% (± 14%) 42% (± 13%)** 89% (± 20%)
Norovirus GII.4 (n=3) 38% (± 3.7%) 43% (± 7.3%) 51%*** 69% (± 4.0%) * percent recovery (± st dev)
** n=3 *** n=2
39
9% PEG rather than 6% PEG (unpaired t-test, p < 0.05). However, no significant difference in average percent recoveries was observed between 0.1 M NaCl and 0.3 M NaCl when combined with 9% PEG for either adenovirus (unpaired t-test, p = 0.325) or norovirus (unpaired t-test, p = 0.122).
Table 8. Percent recovery of adenovirus 41 and norovirus GII.4 from actual eluates using PEG precipitation
6% PEG 9% PEG
0.1 M NaCl 0.3 M NaCl 0.1 M NaCl 0.3 M NaCl
Adenovirus 41 (n=4) 1.9% (± 0.48%)* 3.7% (± 1.7%) 29% (± 14%) 34% (± 12%)
RESULTS FOR FIELD SAMPLES
Doheny Beach
Of the 93 samples collected from the waters of Doheny Beach, California, 24 samples (26%) were positive for the presence of adenovirus, and 21 samples (23%) were positive for the presence of norovirus. The equivalent volume analyzed for adenovirus was 2.1 L, and the equivalent volume analyzed for norovirus was 0.7 L. Assuming that 1 PCR or RT-PCR unit is detectable in the assayed volume of the extracted viral nucleic acid, optimal detection limits were calculated as 18 PCR units per 40 L of seawater for adenovirus, and 55 RT-PCR units per 40 L of seawater for norovirus. Actual detection limits were then calculated using the average percent recoveries of the viruses from the seeded experiments. The actual detection limits were estimated at 1472 PCR units per 40 L (37 PCR units per L) for
41
The data were then stratified into subsets in order to test for potential associations between viruses at specific collection times or sampling sites. Separate Chi-squared tests of independence were used to test for associations between virus groups in the samples
collected at 7 AM, followed by the samples collected at 1 PM, and then the samples collected at 3 PM. The same procedure was used to test for virus associations in samples collected at each of the five different sampling sites. No association was found between adenovirus and norovirus, or between the enteric viruses and the somatic or F+ coliphages in any of these data subsets. However, the percentage of samples positive for both F+ coliphages and somatic coliphages was highest in the morning samples, and was lower in samples collected progressively later in the day. F+ coliphages were detected in 16 (46%) of the samples collected at 7 AM, 7 (23%) of the samples collected at 1 PM, and 1 (4%) of the samples collected at 3 PM. Somatic coliphages were detected in 33 (94%) of the samples collected at 7 AM, 25 (81%) of the samples collected at 1 PM, and 20 (74%) of the samples collected at 3 PM. The frequency of adenovirus and norovirus presence in samples did not appear to be affected by the sampling time. Adenovirus was detected in 9 (26%) of the samples collected at 7 AM, 6 (19%) of the samples collected at 1 PM, and 9 (33%) of the samples collected at 3 PM. Norovirus was detected in 4 (11%) of the samples collected at 7 AM, 9 (29%) of the samples collected at 1 PM, and 8 (30%) of the samples collected at 3 PM.
Avalon Beach
42
240 ml, and the equivalent volume analyzed for norovirus was 80 ml. The equivalent volumes analyzed for Avalon Beach were smaller than the equivalent volumes analyzed for Doheny Beach because at the higher equivalent volumes, most of the Avalon Beach samples analyzed were negative for both viruses. Samples were re-analyzed at the smaller equivalent volumes in order to reduce any effects of sample-related inhibition. The optimal detection limits were calculated as 100 PCR units per 40 L of seawater for adenovirus, and 300 RT-PCR units per 40 L of seawater for norovirus. The actual detection limits were estimated at 8029 PCR units per 40 L (200 PCR units per L) for adenovirus, and 507 RT-PCR units per 40 L (13 RT-PCR units per L) for norovirus. Somatic and F+ coliphages were detected in 127 (44%) and 159 (56%) of the samples, respectively. These data were analyzed using Chi-squared tests of independence, but no statistically significant association was found between adenovirus and norovirus, or between the enteric viruses and the coliphages (p > 0.05).
The data were then stratified into subsets in order to test for potential associations between viruses at specific collection times or sampling sites. Separate Chi-squared tests of independence were used to test for associations between virus groups in the samples
43
coliphages were detected in 69 (86%) of the samples collected at 8 AM, 45 (32%) of the samples collected at 12 PM, and 13 (20%) of the samples collected at 3 PM. The frequency of adenovirus and norovirus presence in samples did not appear to be affected by the
sampling time. Adenovirus was detected in 8 (10%) of the samples collected at 8 AM, 14 (10%) of the samples collected at 12 PM, and 4 (6%) of the samples collected at 3 PM. Norovirus was detected in 1 (1%) of the samples collected at 8 AM, 1 (<1%) of the samples collected at 12 PM, and was not detected in any of the samples collected at 3 PM.
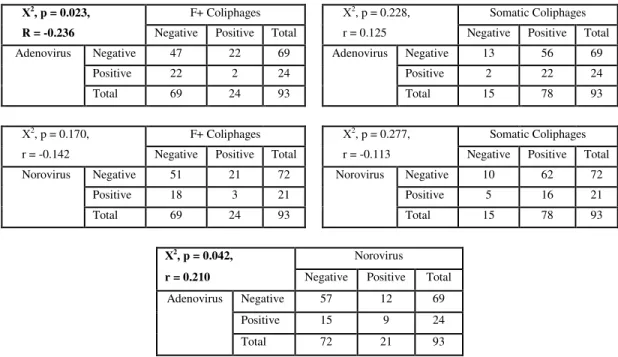
Table 9. Chi-squared tests of independence for the correlation of enteric viruses and coliphages in samples from Doheny Beach, California
Χ2, p = 0.023, F+ Coliphages
Χ2, p = 0.228, Somatic Coliphages
R = -0.236 Negative Positive Total r = 0.125 Negative Positive Total
Negative 47 22 69 Negative 13 56 69
Positive 22 2 24 Positive 2 22 24
Adenovirus
Total 69 24 93
Adenovirus
Total 15 78 93
Χ2, p = 0.170, F+ Coliphages Χ2, p = 0.277, Somatic Coliphages
r = -0.142 Negative Positive Total r = -0.113 Negative Positive Total
Negative 51 21 72 Negative 10 62 72
Positive 18 3 21 Positive 5 16 21
Norovirus
Total 69 24 93
Norovirus
Total 15 78 93
Χ2, p = 0.042, Norovirus
r = 0.210 Negative Positive Total
Adenovirus Negative 57 12 69
Positive 15 9 24
DISCUSSION
According to the manufacturer, the nano alumina fibers that are used to create Argonide Nanoceram cartridge filters are 2 nm in diameter and 0.3 µm in length (Tepper & Kaledin, 2007). This corresponds to an external surface area of approximately 500 m2 per gram of material, which provides a large area for the adsorption of electronegative particles. In addition, the zeta potential of the Nanoceram filters is approximately 50 mV at neutral pH, and the isoelectric point is approximately pH 9.4. Therefore, the filters are highly
electropositive throughout the recommended pH range of 5 through 9. We demonstrated that the adsorption of adenoviruses to the filter in seeded seawater was very high (>96%).
Norovirus adsorption was difficult to determine because of the low virus concentration achievable in seeded samples. Unfortunately, the titer of the virus stock suspension was not high enough to seed sufficient quantities of the virus into the influent to reliably quantify adsorption efficiency. Using the lower detection limit of the virus assay as a reference, norovirus adsorption was calculated to be at least 43%. The high norovirus recovery rates overall at least suggest that norovirus adsorption rates were also high.
Some studies have suggested that 1MDS electropositive filters may not be efficient at adsorbing certain viruses from water at pH levels greater than 7.5 or containing salts such as sodium chloride (NaCl) and magnesium chloride (MgCl2). Sobsey and Jones (1979) reported
45
membrane. Near neutral pH, 1MDS filters possess an overall net positive charge, and the viruses possess an overall net negative charge, which promotes adsorption of the viruses to the filter. However, at elevated pH levels the filter becomes less electropositive, and adsorption of the negatively-charged viruses is diminished. Sobsey et al. (1985) conducted an experiment in which adsorption rates of HAV in tap water to 1MDS filters were 97%, 82% and 43%, for pH levels of 6.5, 7.5 and 8.5, respectively. Lukasik et al. (2000) reported a 79% adsorption rate of poliovirus to 1MDS filters in de-ionized water at pH 7, but when 0.1 M NaCl or 0.1 M MgCl2 was added, adsorption dropped to 7% or 9%, respectively. In
the current study, adenovirus adsorption was not adversely affected by the pH conditions and salt concentrations found in natural seawater. This could be due to the relatively large surface area and strong electropositive charge of the Nanoceram filters. More work is needed to determine if these filters are capable of efficiently adsorbing other enteric viruses from seawater.
46
physically interacting with the alumina fiber matrix. If this is true, adenovirus elution by interruption of electrostatic binding could still be hindered by physical entrapment within the filter matrix, while norovirus elution would be unaffected due to its smaller, nearly spherical size and lack of the long protruding surface fibers possessed by adenoviruses.
PEG precipitation yielded lower recoveries for both viruses when using actual eluates versus seeded beef extract solution. Lewis & Metcalf (1988) reported a similar reduction in performance when PEG precipitation was used to concentrate human rotaviruses from freshwater and estuarine samples. In their study, rotavirus recovery was 93% from
freshwater eluates, but only 61% from estuarine water eluates. The reduced virus recovery with actual filter eluates was not specifically attributable to PCR inhibitors in their
experiments. This is because infectivity assays, rather than nucleic acid assays, were used to detect the virus in these previous experiments. However, some substance(s) could have been concentrated during filtration and elution and subsequently interfered with PEG precipitation of the viruses.
47
experiment by Kohn and Nelson (2007) showed that MS2 coliphages may be inactivated directly by sunlight, or indirectly by sunlight-mediated production of highly reactive singlet oxygen in natural waters.
It has also been suggested that human enteric viruses such as adenovirus may be able to persist for many days in seawater due to their relatively high resistance to inactivation by solar radiation and UV radiation in general (Jiang et al., 2001). The data of this present study documented a marked decline in the presence of both somatic and F+ coliphages throughout the day, which could be the result of inactivation by solar radiation. However, adenovirus and norovirus presence was relatively constant at different time periods throughout the day. If enteric viruses are able to survive for longer periods of time in natural waters than
coliphages, this could explain why the two virus types were not positively associated. It is also possible that the lack of association of adenovirus and norovirus presence in samples with time of day is due to the unit of measure, which is either presence or absence. The actual concentrations of these viruses were not examined in samples collected at different times of the day. Therefore, it is possible that virus concentrations differ among samples collected at different times of the day, but human enteric virus concentrations were not measured in this study.
48
The lack of association could also be due to the different methods used to detect enteric viruses and coliphages in the field samples. Enteric viruses were detected by PCR assay, which is capable of detecting viral genomes of both infectious and non-infectious viruses, but coliphages were detected by cell infectivity assay, which only detects infectious virus particles. Gantzer et al. (1998) compared the two methods for the detection of
coxsackievirus in PBS, and reported that viral genomes survived twice as long as infectious viruses. Choi & Jiang (2005) conducted a study in which adenoviruses were isolated from river water, and found that most of the viruses detected by PCR were non-infectious. Another comparative experiment was performed by Wetz et al. (2004), in which poliovirus was seeded into four different water types (de-ionized water, artificial seawater, filtered seawater, and unfiltered seawater). Their results indicated that viral genomes persisted longer than infectious viruses in all types of water except unfiltered seawater. They concluded that viral genomes probably do not persist for long periods of time in natural seawater due to factors such as microbial predation, nucleases, and solar radiation.
CONCLUSIONS
Overall, Argonide Nanoceram filters appear to offer certain distinct advantages over other electropositive filters for the recovery of adenoviruses and noroviruses from seawater. Specifically, the pH conditions and salt concentrations of the seawater did not seem to adversely affect virus adsorption to this filter. However, adsorbed adenoviruses could not be efficiently eluted using the beef extract solution described. Future research should be
directed towards the improvement of adenovirus elution by disrupting both electrostatic interactions and potential physical adsorption or entrapment in the filter matrix.
PEG precipitation was shown to be an effective secondary concentration procedure, although further work is recommended to identify and remove or otherwise overcome the inhibitory compounds present in virus filter concentrates from seawater. When applied to seawater samples impacted by non-point sources of fecal contamination, Argonide filter adsorption followed by beef extract elution and PEG precipitation resulted in adenovirus and norovirus detection by PCR in 50/379 (13%) and 23/379 (6%) of the samples analyzed, respectively.
Finally, the results of the field studies suggest that somatic and F+ coliphages may not be reliable indicators of human adenovirus and norovirus in natural seawater
contaminated with non-point sources of fecal contamination. It would be beneficial to
50
51
REFERENCES
Abbaszadegan, M., Huber, M. S., Gerba, C. P., & Pepper, I. L. (1993). Detection of enteroviruses in groundwater with the polymerase chain reaction. Applied and Environmental Microbiology, 59(5), 1318-1324.
Adams, A. (1973). Concentration of epstein-barr virus from cell culture fluids with polyethylene glycol. The Journal of General Virology, 20(3), 391-394.
Arnal, C., Ferre-Aubineau, V., Besse, B., Mignotte, B., Schwartzbrod, L., & Billaudel, S. (1999). Comparison of seven RNA extraction methods on stool and shellfish samples prior to hepatitis A virus amplification. Journal of Virological Methods, 77(1), 17-26. Atmar, R. L., & Estes, M. K. (2006). The epidemiologic and clinical importance of norovirus
infection. Gastroenterology Clinics of North America, 35(2), 275-90, viii.
Atmar, R. L., Metcalf, T. G., Neill, F. H., & Estes, M. K. (1993). Detection of enteric viruses in oysters by using the polymerase chain reaction. Applied and Environmental
Microbiology, 59(2), 631-635.
Beller, M., Ellis, A., Lee, S. H., Drebot, M. A., Jenkerson, S. A., Funk, E., et al. (1997). Outbreak of viral gastroenteritis due to a contaminated well. International consequences.
JAMA : The Journal of the American Medical Association, 278(7), 563-568.
Boom, R., Sol, C. J., Salimans, M. M., Jansen, C. L., Wertheim-van Dillen, P. M., & van der Noordaa, J. (1990). Rapid and simple method for purification of nucleic acids. Journal of Clinical Microbiology, 28(3), 495-503.
Centers for Disease Control and Prevention (2005). Adenoviruses. Retrieved August 2, 2008, from http://www.cdc.gov/ncidod/dvrd/revb/respiratory/eadfeat.htm
Centers for Disease Control and Prevention (2006). Norovirus: Technical fact sheet.
Retrieved July 15, 2008, from http://www.cdc.gov/ncidod/dvrd/revb/gastro/norovirus-factsheet.htm
Chang, L. T., Farrah, S. R., & Bitton, G. (1981). Positively charged filters for virus recovery from wastewater treatment plant effluents. Applied and Environmental Microbiology, 42(5), 921-924.
Choi, S., & Jiang, S. C. (2005). Real-time PCR quantification of human adenoviruses in urban rivers indicates genome prevalence but low infectivity. Applied and
52
Colford, J. M.,Jr, Wade, T. J., Schiff, K. C., Wright, C. C., Griffith, J. F., Sandhu, S. K., et al. (2007). Water quality indicators and the risk of illness at beaches with nonpoint sources of fecal contamination. Epidemiology (Cambridge, Mass.), 18(1), 27-35.
da Silva, A. K., Le Saux, J. C., Parnaudeau, S., Pommepuy, M., Elimelech, M., & Le Guyader, F. S. (2007). Evaluation of removal of noroviruses during wastewater
treatment, using real-time reverse transcription-PCR: Different behaviors of genogroups I and II. Applied and Environmental Microbiology, 73(24), 7891-7897.
Dore, W. J., Henshilwood, K., & Lees, D. N. (2000). Evaluation of F-specific RNA bacteriophage as a candidate human enteric virus indicator for bivalve molluscan shellfish. Applied and Environmental Microbiology, 66(4), 1280-1285.
Enriquez, C. E., & Gerba, C. P. (1995). Concentration of enteric adenovirus 40 from tap, sea and waste water. Water Research, 29(11), 2554-2560.
Enriquez, C. E., Hurst, C. J., & Gerba, C. P. (1995). Survival of the enteric adenoviruses 40 and 41 in tap, sea, and waste water. Water Research, 29(11), 2548-2553.
Estes, M. K., Ball, J. M., Guerrero, R. A., Opekun, A. R., Gilger, M. A., Pacheco, S. S., et al. (2000). Norwalk virus vaccines: Challenges and progress. The Journal of Infectious Diseases, 181 Suppl 2, S367-73.
Farrah, S. R., Gerba, C. P., Wallis, C., & Melnick, J. L. (1976). Concentration of viruses from large volumes of tap water using pleated membrane filters. Applied and Environmental Microbiology, 31(2), 221-226.
Farrah, S. R., Goyal, S. M., Gerba, C. P., Wallis, C., & Melnick, J. L. (1977). Concentration of enteroviruses from estuarine water. Applied and Environmental Microbiology, 33(5), 1192-1196.
Fong, T. T., & Lipp, E. K. (2005). Enteric viruses of humans and animals in aquatic environments: Health risks, detection, and potential water quality assessment tools.
Microbiology and Molecular Biology Reviews : MMBR, 69(2), 357-371.
Friedmann, T., & Haas, M. (1970). Rapid concentration and purification of polyoma virus and SV40 with polyethylene glycol. Virology, 42(1), 248-250.
Gantzer, C. A., Maul, A., Levi, Y., & Schwartzbrod, L. (1998). Fate of the genome and infectious units of coxsackie B3 virus in phosphate buffered saline. Water Research, 32, 1329-1333.
53
Goyal, S. M., & Gerba, C. P. (1983). Viradel method for detection of rotavirus from seawater. Journal of Virological Methods, 7(5-6), 279-285.
Goyal, S. M., Gerba, C. P., & Melnick, J. L. (1979). Human enteroviruses in oysters and their overlying waters. Applied and Environmental Microbiology, 37(3), 572-581.
Griffin, D. W., Donaldson, K. A., Paul, J. H., & Rose, J. B. (2003). Pathogenic human viruses in coastal waters. Clinical Microbiology Reviews, 16(1), 129-143.
Griffin, D. W., Gibson, C. J.,3rd, Lipp, E. K., Riley, K., Paul, J. H.,3rd, & Rose, J. B. (1999). Detection of viral pathogens by reverse transcriptase PCR and of microbial indicators by standard methods in the canals of the florida keys. Applied and Environmental
Microbiology, 65(9), 4118-4125.
Guttman-Bass, N., & Armon, R. (1983). Concentration of simian rotavirus SA-11 from tap water by membrane filtration and organic flocculation. Applied and Environmental Microbiology, 45(3), 850-855.
Guttman-Bass, N., & Nasser, A. (1984). Simultaneous concentration of four enteroviruses from tap, waste, and natural waters. Applied and Environmental Microbiology, 47(6), 1311-1315.
Hafliger, D., Gilgen, M., Luthy, J., & Hubner, P. (1997). Seminested RT-PCR systems for small round structured viruses and detection of enteric viruses in seafood. International Journal of Food Microbiology, 37(1), 27-36.
Haramoto, E., Katayama, H., & Ohgaki, S. (2004). Detection of noroviruses in tap water in japan by means of a new method for concentrating enteric viruses in large volumes of freshwater. Applied and Environmental Microbiology, 70(4), 2154-2160.
Henrickson, S. E., Wong, T., Allen, P., Ford, T., & Epstein, P. R. (2001). Marine swimming-related illness: Implications for monitoring and environmental policy. Environmental Health Perspectives, 109(7), 645-650.
Jiang, S., Noble, R., & Chu, W. (2001). Human adenoviruses and coliphages in urban runoff-impacted coastal waters of southern california. Applied and Environmental
Microbiology, 67(1), 179-184.
Josephson, K. L., Gerba, C. P., & Pepper, I. L. (2000). Cultural methods. In R. M. Maier, I. L. Pepper & C. P. Gerba (Eds.), Environmental microbiology (pp. 213-233). San Diego: Academic Press.