Genetic architecture of atherosclerosis
dissected by QTL analyses in three F2
intercrosses of apolipoprotein E-null mice on
C57BL6/J, DBA/2J and 129S6/SvEvTac
backgrounds
Natalia Makhanova1, Andrew P. Morgan2, Yukako Kayashima1, Andrei Makhanov3, Sylvia Hiller1, Svetlana Zhilicheva1, Longquan Xu1, Fernando Pardo-Manuel de Villena2, Nobuyo Maeda1*
1 Department of Pathology and Laboratory Medicine, University of North Carolina at Chapel Hill, Chapel Hill,
United States of America, 2 Department of Genetics and the Lineberger Comprehensive Cancer Center, University of North Carolina at Chapel Hill, Chapel Hill, United States of America, 3 College of Computing, Georgia Institute of Technology, Atlanta, United States of America
Abstract
Quantitative trait locus (QTL) analyses of intercross populations between widely used mouse inbred strains provide a powerful approach for uncovering genetic factors that influence susceptibility to atherosclerosis. Epistatic interactions are common in complex phenotypes and depend on genetic backgrounds. To dissect genetic architecture of ath-erosclerosis, we analyzed F2 progeny from a cross between apolipoprotein E-null mice on DBA/2J (DBA-apoE) and C57BL/6J (B6-apoE) genetic backgrounds and compared the results with those from two previous F2 crosses of apolipoprotein E-null mice on 129S6/SvEvTac (129-apoE) and DBA-apoE backgrounds, and B6-apoE and 129-apoE backgrounds. In these round-robin crosses, in which each parental strain was crossed with two others, large-effect QTLs are expected to be detectable at least in two crosses. On the other hand, observation of QTLs in one cross only may indicate epistasis and/or absence of statistical power. For atherosclerosis at the aortic arch, Aath4 on chromosome (Chr)2:66 cM follows the first pattern, with significant QTL peaks in (DBAx129)F2 and (B6xDBA)F2 mice but not in (B6x129)F2 mice. We conclude that genetic variants unique to DBA/2J at Aath4 confer susceptibility to atherosclerosis at the aortic arch. A similar pat-tern was observed for Aath5 on chr10:35 cM, verifying that the variants unique to DBA/2J at this locus protect against arch plaque development. However, multiple loci, including
Aath1 (Chr1:49 cM), and Aath2 (Chr1:70 cM) follow the second type of pattern, showing
significant peaks in only one of the three crosses (B6-apoE x 129-apoE). As for athero-sclerosis at aortic root, the majority of QTLs, including Ath29 (Chr9:33 cM), Ath44
(Chr1:68 cM) and Ath45 (Chr2:83 cM), was also inconsistent, being significant in only one of the three crosses. Only the QTL on Chr7:37 cM was consistently suggestive in two of a1111111111 a1111111111 a1111111111 a1111111111 a1111111111 OPEN ACCESS
Citation: Makhanova N, Morgan AP, Kayashima Y,
Makhanov A, Hiller S, Zhilicheva S, et al. (2017) Genetic architecture of atherosclerosis dissected by QTL analyses in three F2 intercrosses of apolipoprotein E-null mice on C57BL6/J, DBA/2J and 129S6/SvEvTac backgrounds. PLoS ONE 12 (8): e0182882.https://doi.org/10.1371/journal. pone.0182882
Editor: Xianwu Cheng, Nagoya University, JAPAN Received: April 10, 2017
Accepted: July 26, 2017 Published: August 24, 2017
Copyright:©2017 Makhanova et al. This is an open access article distributed under the terms of theCreative Commons Attribution License, which permits unrestricted use, distribution, and reproduction in any medium, provided the original author and source are credited.
Data Availability Statement: All relevant data are
within the paper and its Supporting Information files. QTL data were deposited to QTL Archive at The Jackson Laboratory:https://phenome.jax.org/ projects/Maeda1.
Funding: This research was supported by a
the three crosses. Thus QTL analysis of round-robin crosses revealed the genetic archi-tecture of atherosclerosis.
Introduction
Atherosclerosis is the major cause of morbidity and mortality in North America. It is an inflammatory disease of arteries, characterized by the development of lipid-laden plaques affecting multiple vascular beds. Genetic factors play a crucial role in the pathogenesis of ath-erosclerosis, and genome-wide association studies (GWAS) in humans have yielded multiple loci and insights into their relevance to the disease [1]. However, the precise role of these loci is not fully understood, with the exception of a few genes such asLdlr(low-density lipoprotein receptor) andApoe(apolipoprotein E). This is because atherogenesis is a highly complex pro-cess on which each gene often has only small effects, and certain lifestyle characteristics, such as smoking, diet, and stress, have an impact on the development of this disease. Genetic analy-sis in animal models is a valuable tool to complement human GWAS since environmental fac-tors can be carefully controlled. A large number of genetic loci affecting plaque development have yielded results utilizing hyperlipidemicApoe-null mice,Ldlr-null mice or atherogenic diet-fed wild type mice [2], although defining causative variants/gene(s) within any QTL regions remains a challenge.
Apoe-null mice on different strain backgrounds show differences in susceptibility to athero-sclerosis in a vascular location-specific manner [3]. Thus,Apoe-null mice on a C57BL/6J (B6) background (B6-apoE), develop atherosclerotic plaques initially at their aortic root and later, as they age, at other locations, including in the innercurve of aortic arch. In contrast,Apoe -null mice on a 129S6/SvEvTac (129) background (129-apoE) develop plaques earlier in the aortic arch and later in the aortic root than B6-apoE. Furthermore,Apoe-null mice on DBA/2J (DBA) background (DBA-apoE) are highly susceptible to atherosclerosis and develop exten-sive plaques early at both locations [4]. Our previous analyses of F2 mice derived from an intercross between B6-apoE and 129-apoE mice and an intercross between DBA-apoE and 129-apoE mice demonstrate that most loci that determine susceptibility to atherosclerosis in aortic arch and in aortic roots in these populations are distinct [4,5,6]. While QTL identiti-fication in these two crosses provides a list of candidate genes contributing to formation of atherosclerotic lesions, the well known presence of epistatic effects dependent on genetic back-ground in complex phenotypes such as atherosclerosis can not be ignored.
With the aim to ascertain and narrow the candidate intervals of the QTLs influencing ath-erosclerosis susceptibility in a vascular location dependent manner, we generated, phenotyped and genotyped a F2 population between B6-apoE and DBA-apoE that closes the loop of genetic crosses among three commonly used strains. Comparison of the QTLs mapped in these three crosses confirmed the presence of QTLs that influence atherosclerosis in the aortic arch on chromosome (Chr)2 and on Chr10, and the presence of multiple suggestive QTLs affecting atherosclerosis in the aortic root including QTL on Chr7. Our analyses also revealed that the effects of multiple QTLs appears to depend on the other loci.
Materials and methods
Mice
Apoe-null mice on DBA and B6 backgrounds were obtained from the Jackson Laboratory (Bar Harbor, ME, USA).Apoe-null mice were originally generated in our Laboratory using
Competing interests: The authors have declared
129P2/Ola embryonic stem cells [7] and were backcrossed to B6 and subsequently to DBA backgrounds. Male DBA-apoE mice were mated to female B6-apoE mice to generate F1 prog-eny. F1 hybrids were intercrossed to generate the F2 population. F2 mice (136 females and 96 males) aged 4.5 months were used for analyses in this study. At this age,Apoe-null mice on normal chow develop early stage atheromas ranging from monolayers of foam cells to raised plaques with fibrous cap and cholesterol clefts. Plaque sizes rapidly increase and are appropri-ate for comparison.
Mice were fed regular chow (Prolab IsoProRMH 3000; Agway Inc.) and maintained and handled in accordance with the National Institutes of Health Guide for the Care and the Use of Laboratory Animals under protocols approved by the Institutional Animal Care and Use Committee of the University of North Carolina.
Quantification of atherosclerotic lesion
Sizes of atherosclerotic plaques in the aortic root and the aortic arch were measured as described previously [5,8]. Briefly, mice were euthanized with a lethal dose of 2,2,2-tribro-moethanol followed by cervical dislocation, and perfused with 4% paraformaldehyde through the left ventricle of the heart. The plaque areas in the defined locations of the aortic arch (S1 Fig) were measured using images captured with Image J software [5]. The plaques at the inner-curve of the aortic arch were used to represent “arch plaque size”.
Plasma lipid analysis
Mice were fasted for 4 h in the morning. Plasma levels of total cholesterol were measured using a commercial kit “Cholesterol E” (Wako Chemicals USA, Richmond, VA). HDL choles-terol levels were measured after removing with magnesium/dextran sulfate apoB containing lipoproteins [9]. Measurements of plasma triglycerides were made using a kit from Stanbio Laboratory (Boerne, TX).
SNP genotyping
Genomic DNA was isolated from livers of F2 mice using DNeasy Tissue kit (Qiagen, Hilden, German). Genome-wide SNP genotyping was performed with a Mouse Universal Genotyping Array (MUGA) [10]. Samples were processed at the Systems Genetics Core at the University of North Carolina, Chapel Hill and array hybridization was performed by Neogen/Geneseek, Inc (Lincoln, NE).
QTL analysis
The significance thresholds for LOD scores were determined by 1000 permutations. QTL were considered significant if LOD scores exceeded 95% (p<0.05) of the permutation distribu-tion. They were considered suggestive if the scores exceed 37% (p<0.63) distribution as rec-ommended by the Complex Trait Consortium [11]. Credible interval (CI) was determined from the Bayesian 95% credible interval. For each QTL, mode of inheritance was determined according to allelic effect at the nearest marker of a QTL by performing Haley-Knott regres-sion using the additive and dominant/recessive models as described previously [12,13]. Per-centage of variance was calculated using “fitqtl” function. Potential interactions between two chromosomal loci were examined by “scantwo” function. Pairs with interaction LOD scores
>3 represent putative epistatic interactions that were further evaluated by fitting a multiple-QTL model with additive and epistatic terms using “fitqtl”, and then performing model selec-tion by backward eliminaselec-tion with “stepwiseqtl”. Penalties (3.52-additive penalty, 4.28-heavy penalty, 2.69-light interaction penalty) were applied in the “stepwiseqtl” analysis according to recommendations based on simulation from Broman and Sen [14]. QTL data were deposited to QTL Archive at The Jackson Laboratory (https://phenome.jax.org/projects/Maeda1). The physical (Mb) positions (GRCm38) were calculated using Mouse Map Converter tool of the Jackson Laboratory. Haplotype analyses were performed as described [4,6]. SNPs and nucleo-tide sequence comparisons of mouse strains were obtained from publicly available resources (http://www.sanger.ac.uk/resources/mouse/genomes/). Estimations of statistical power to determine QTLs and effect size were done using QTL Design Program (http://www.biostat. ucsf.edu/sen/software.html/) [15].
The current cross between B6-apoE and DBA-apoE closes the loop of round-robin crosses, in which each mouse parental strain was crossed with two other strains (129-apoE x B6-apoE, 129-apoE x DBA-apoE, B6-apoE x DBA-apoE). Therefore, we compared the findings of this QTL analysis with results from two previous F2 crosses of 129-apoE x DBA-apoE and B6-apoE x 129-apoE.
Haplotype analysis
The haplotype patterns of genomes in the QTL interval were analyzed using the Mouse Phy-logeny Viewer (http://msub.csbio.unc.edu/) [16]. The likelihood that an amino acid change is detrimental to a protein was examined by Sorting Intolerant From Tolerant (SIFT) program (http://sift.jcvi.org/) [17] and PROVEAN (http://provean.jcvi.org/) [18]. Gene expression in the aorta of wild type B6, DBA and 129 were previously published (GEO accession number -GSE53006) [4]. RNA from three aortic arch samples per strain, each pooled from 3–5 mice, were hybridized on a Mouse Gene 2.1 ST 24- Array plate (Affymetrix). For eQTL analysis, aor-tic gene expression in the Hybrid Mouse Diversity Panel (HMDP) was used (GSE38120, Ben-nett BJ et al, 2010) [19]. SNPs were picked from the eQTL data of the HMDP according to the following criteria: (1) location within and near the QTL interval; (2) being associated with genes at p<1.0×10⁻⁶.
Statistical analysis
Results
The correlation between lesion size and plasma lipid levels is low in
B6-apoE x DBA-apoE F2 mice
Size of atherosclerotic lesions at age 4.5 months at the aortic root and the aortic arch, plasma lipid concentrations in parental and F2 mice are summarized inTable 1. Parental DBA-apoE mice develop significantly larger atherosclerotic plaques at both the aortic root and the inner-curve of aortic arch than B6-apoE mice. Briefly, the mean root lesion in DBA-apoE mice was 17 times larger in males and four times larger in females compared with gender and age-matched B6-apoE mice. Similarly, arch lesion size in DBA-apoE mice was 26 times greater in males and 14 times greater in females compared with B6-apoE mice. Notably, while DBA-apoE mice did not show significant sex differences in plaque size at either location, B6-DBA-apoE females had significantly larger plaques than B6-apoE males at the aortic root, but not at the aortic arch, that are consistent with our previous study [5].
At the aortic root, both male and female F2 mice had intermediate lesion size between the parental strains, and female F2 mice showed about twice larger plaque size than male F2 mice. Plaques at the aortic arch of of F2 mice were also intermediate between the parental strains, but no sex difference was observed. On a per animal basis, there was no correlation between the size of the aortic lesions at the root and the arch (r = 0.12, p = 0.07).
Hyperlipidemia is a well-known cause of the development of atherosclerosis. DBA-apoE mice had significantly higher plasma total cholesterol (p<0.00001), HDL-cholesterol
(p<0.0001 in female) and triglycerides (p<0.001 in male, p<0.00001 in female) concentrations than B6-apoE mice. Average plasma total cholesterol and triglycerides in F2 mice were similar to those in the parental DBA-apoE mice (Table 1). When we examined the relationship between plasma lipid concentrations and plaque size at two vascular locations, only the total cholesterol level in males significantly correlated with root lesion size (r = 0.32, p = 0.002) (S2 andS3Figs). Thus, plasma lipid level does not appear to be a strong determinant of atheroscle-rotic plaque size in this F2 population ofApoe-null mice.
Table 1. Atherosclerotic lesion sizes and plasma lipid levels in the parental mice and F2 from intercross between DBA-apoE and B6-apoE mice.
Sex B6-apoE (n) DBA-apoE (n) F2(n)
Root lesion (104μm2) Male 2.6±0.4 (10) 43.7±2.4 (13)c 19.0±1.3 (91)
Female 12.8±2.3 (8)d 51.9±3.1 (13)c 33.6±1.4 (129)e
Arch lesion (104μm2) Male 5.2±1.0 (10) 133.0±6.8 (16)c 76.6±3.8 (96) Female 9.1±2.8 (10) 129.3±6.1 (16)c 71.2±2.7 (134)
Cholesterol (mg/dl) Male 200±12(10) 671±29 (18)c 705±16 (96)
Female 189±9 (10) 665±48 (18)c 573±11 (136)e
HDL-Cholesterol (mg/dl) Male 45.9±6.7 (10) 61.4±6.0 (18) 48.8±1.9 (96)
Female 39.2±2.1(10) 57.8±3.3 (18)b 38.6±1.7 (134)e
Triglycerides (mg/dl) Male 82±12(10) 186±22 (18)a 179±10 (96)
Female 63±6 (8) 166±19 (18)c 76±3 (135)e
Data are shown as the mean±SE. Data of the DBA-apoE mice are from our previous papers [4,6]. The number of mice is shown in parentheses. Statistical comparisons between groups were performed using Student’s t test.
ap<0.001, bp<0.0001,
cp<0.00001 vs B6-apoE within each sex; dp<0.001 B6-apoE female vs B6-apoE male; ep<0.0001 F2 female vs F2 male.
Analysis of B6-apoE x DBA-apoE F2 population reveals a significant
QTL on Chr2 and a suggestive QTL on Chr10 which influence aortic arch
lesion size
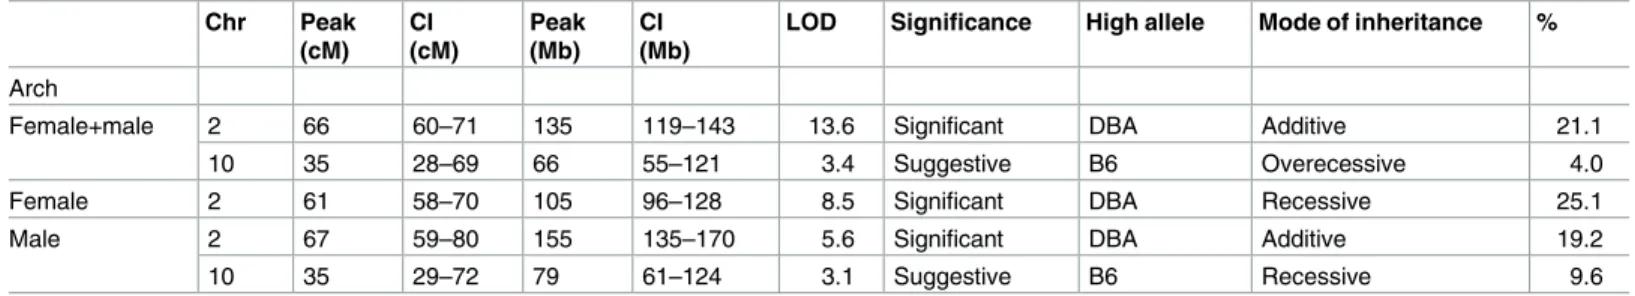
A genome-wide QTL scan for atherosclerotic lesions at the aortic arch was performed in 232 F2 mice, using sex as an additive (Fig 1A,S4A and S4B Fig,Table 2,S1 Table) or interactive covariates (S4A and S4C Fig). A scan in sex-additive model identified a highly significant QTL for aortic arch lesion on Chr2 (peak 66 cM, CI = 60–71 cM, LOD = 13.6) accounting for 21.1% of the variance. At the QTL peak, the DBA allele was associated with bigger arch lesion size than the B6 allele, and had an additive effect (Fig 1B). The QTL on Chr2 influenced plaque sizes at all locations of the aortic arch as shown in theS1 Table. The sex-additive scan also detected a suggestive QTL on Chr10 (peak 35 cM, CI = 28–69 cM, LOD = 3.4), which accounts
Fig 1. LOD curves and allelic distribution of QTLs for arch plaque lesion. (A) LOD curve for arch lesion size with sex as additive covariate in F2
mice from a cross B6-apoE x DBA-apoE. The horizontal dashed line represents a threshold for a suggestive (p = 0.63) QTL and a dotted line represents a threshold for a significant QTL (p = 0.05). The significance thresholds for LOD scores were determined by 1000 permutations using R/qtl software. (B) Allelic distribution of the QTL on Chr2 for plaque lesion size at the arch at the nearest marker to the peak in F2 mice from the cross B6-apoE x DBA-apoE. Data represent mean±SE. Lesion size comparison was performed by one-way analysis of variance (ANOVA) (p<0.0001) followed by Tukey-Kramer’s HSD-test.****p<0.0001 (C) Allelic distribution of QTL on Chr10 for plaque lesion size at the arch at the nearest marker to the peak in F2 mice from the cross B6-apoE x DBA-apoE. Data represent mean±SE. Lesion size comparison was performed by one-way analysis of variance (ANOVA) (p<0.001) followed by Tukey-Kramer’s HSD-test. p = 0.06 between B6/B6 and DBA/DBA genotypes,****p<0.0001 between B6/ B6 and B6/DBA genotypes (D) Allelic distribution of the main effect QTL for plaque lesion size at the arch in Chr 4 and Chr 6 in both sexes in F2 mice from the cross B6-apoE x DBA-apoE. Data represent mean±SE. Only mice homozygous for B6 allele at both Chr4 and Chr6 have increased plaque size by one-way ANOVA (p = 0.001), followed by Tukey-Kramer’s HSD-test:*p<0.05- B6/B6 genotype vs DBA/DBA genotype, ### p<0.001- B6/B6 genotype vs B6/DBA genotype.
for 4.0% of the variance. The B6 allele at the Chr10 QTL was associated with an increased pla-que size at the aortic arch and was recessive with respect to the DBA allele (Fig 1C). The QTL at Chr10 was also suggestive for plaque size at the branching point of the innominate artery but not other branches (S1 Table). These features are consistent with the assignment of QTLs on Chr2 and Chr10 asAath4andAath5respectively, that we previously identified in the F2 population from DBA-apoE x 129-apoE [6] as discussed below.
We next assessed the potential interactions among different chromosomal regions by per-forming a two-dimensional genome scan. One of the epistatic interactions identified in this scan was an interaction between Chr4 at 58 cM and Chr6 at 66 cM (Fig 1D). The phenotype of mice that are homozygous for the B6 allele on Chr4 depends on their genotype on Chr6: only mice homozygous for B6 at both Chr4 and Chr6 have increased plaque size, while mice with opposite homozygous combinations have decreased plaque size. However, this interaction did not meet the genome-wide threshold for significance in F2 cross of this size, after accounting for multiple testing.
Comparison of QTLs for arch atherosclerosis from three F2 intercrosses
of Apoe-null mice on B6, DBA and 129 backgrounds
We next compared QTLs for arch atherosclerosis that were significant at least in one of the F2 populations (Table 3). Since a cross between B6-apoE x DBA-apoE mice, a cross between
Table 2. QTLs for atherosclerosis at the aortic arch in F2 mice from intercross between DBA-apoE and B6-apoE.
Chr Peak
(cM) CI (cM)
Peak (Mb)
CI (Mb)
LOD Significance High allele Mode of inheritance %
Arch
Female+male 2 66 60–71 135 119–143 13.6 Significant DBA Additive 21.1
10 35 28–69 66 55–121 3.4 Suggestive B6 Overecessive 4.0
Female 2 61 58–70 105 96–128 8.5 Significant DBA Recessive 25.1
Male 2 67 59–80 155 135–170 5.6 Significant DBA Additive 19.2
10 35 29–72 79 61–124 3.1 Suggestive B6 Recessive 9.6
CI, 95% credible interval; LOD score for sex-combined scan shown in Table 2 was determined in a single locus scan using sex as additive; the significance thresholds for LOD scores were determined by 1000 permutations using R/qtl software; for each QTL, a model of inheritance was determined according to allelic effect at the nearest marker of a QTL by performing Haley-Knott regression using the additive and dominant/recessive models; % Variance indicates the percentage of the total F2 phenotypic variance.
https://doi.org/10.1371/journal.pone.0182882.t002
Table 3. QTLs for atherosclerotic lesions at arch in three F2 intercrosses of Apoe-null mice on B6, DBA and 129 backgrounds.
QTL Chr Peak (CI), cM B6-apoE x DBA-apoE DBA-apoE x 129-apoE B6-apoE x 129-apoE Consistency
Aath1 1 49 (41–63) - - 129>B6, add No
Aath2 1 69 (63–79) - - 129>B6, add No
Aath3 15 46 (38–57) - - 129>B6, add, F No
Aath4 2 72 (61–73) DBA>B6, add DBA>129, add - 129=B66¼DBA
Aath5 10 26 (17–52) B6>DBA, ovr 129>DBA, dom - 129=B66¼DBA
12 34 (26–43) - - B6>129, dom, M No
13 17 (6–23) - - 129>B6, add, F No
19 34 (17–39) 129>DBA, rec, M No
QTL, quatitative trait locus: Chr, chromosome; CI, 95% credible interval; add, additive; dom, dominant; rec, recessive; ovr, overrecessive: F-female only scan; M- male only scan; significant QTLs are shown in bold, other QTLs are suggestive.>shows allelic relationship. For example, 129>B6 indicates that F2 mice homozygous for 129 allele at the locus develop larger plaque than those with B6 allele.
B6-apoE and 129-apoE mice and a cross between DBA-apoE and 129-apoE mice were made from mice on three inbred backgrounds in a round-robin fashion, given large-effect QTLs are expected in a simple case to be detected at least in two crosses, because every genetic variant was brought at least twice. This pattern was observed in two of the three significant QTLs for arch plaque sizes. Thus the significant QTL at Chr2:66 cM (CI = 60–71 cM) in the current B6-apoE x DBA-apoE (red line) overlaps withAath4, a significant QTL at Chr2:68 cM (CI = 61–73 cM) identified in the DBA-apoE x 129-apoE cross (blue line) (Fig 2A). No peak was present in the same region of Chr2 in the F2 population from the B6-apoE x 129-apoE
Fig 2. LOD curves and allelic distribution of QTLs for plaque lesion at arch. (A-C) LOD curves of QTL for plaque lesion size at arch in
sex-combined scan with sex as additive covariate of a cross between B6-apoE and DBA-apoE (red lines), a cross between B6-apoE and 129-apoE mice (black lines) and a cross between DBA-apoE and 129-apoE mice (blue lines) on chromosome Chr2 (A), Chr10 (B) and Chr1 (C). The horizontal dashed and dotted lines represent thresholds for suggestive QTL (p = 0.63) and significant QTL (p = 0.05) determined in single locus scan of the cross between B6-apoE x DBA-apoE mice. The significance thresholds for LOD scores were determined by 1000 permutations using R/qtl software. (D) Allelic distribution of the QTLs for plaque lesion sizes at arch at the nearest marker to the peaks in Chr1 and Chr14 in both sexes in the cross between B6-apoE and 129-apoE mice. Data represent mean±SE. Comparison of lesion sizes were done by one-way analysis of variance (ANOVA), followed by Tukey-Kramer’s HSD-test. Only mice homozygous for 129 allele at both Chr1 and Chr14 have significantly larger plaques compared to those with other combinations of the loci by one-way ANOVA (p = 0.001), followed by Tukey-Kramer’s HSD-test:***p<0.001–129/129 genotype vs B6/B6 genotype,##p<0.01–129/129 vs 129/B6 genotype genotype.****p<0.0001–129/129 genotype vs B6/B6 genotype,####p<0.0001–129/129 genotype
vs B6/129 genotype; (E) Allelic distribution of the QTLs for plaque lesion sizes at arch at the nearest marker to the peaks in Chr1 and Chr8 in both sexes in the cross between B6-apoE and 129-apoE mice. If Chr8:13 cM is homozygous for the 129 allele, genotype effects were not present, but that if at least one allele of Chr8;13cM derived from B6, a strong effect of genotypes is revealed. Data represent mean±SE. Comparison of lesion sizes were done by one-way analysis of variance (ANOVA), followed by Tukey-Kramer’s HSD-test.*p<0.05–129/129 genotype vs B6/B6 genotype;#p<0.05–
129/129 genotype vs B6/129 genotype,****p<0.0001–129/129 genotype vs B6/B6 genotype;####p<0.0001–129/129 genotype vs B6/129 genotype; § p<0.05- B6/B6 genotype vs B6/129 genotype. (F) Allelic distribution of the QTLs for plaque lesion sizes at arch at the nearest marker to the peaks Chr10 and Chr12 in both sexes in the cross between B6-apoE and 129-apoE mice. Data represent mean±SE. 129 allele of the Chr12 has significant protective effect only when Chr10 is homozygous for B6 allele Comparison of lesion sizes were done by one-way analysis of variance (ANOVA), followed by Tukey-Kramer’s HSD-test.*p<0.05- B6/B6 genotype vs 129/129 genotype;#p<0.05- B6/B6 genotype vs B6/129 genotype;**p<0.01- B6/ B6 genotype vs 129/129 genotype;##p<0.01- B6/B6 genotype vs B6/129 genotype.
cross (black line). This relationship confirms that the DBA allele ofAath4contributes to ath-erosclerosis susceptibility, and that the genomic features that are unique in DBA, but are shared in 129 and B6, are responsible for this susceptibility. We previously reported genes hav-ing this feature asAath4candidates, includingMertkthat is important for the clearance of apo-ptotic cells andSiglec1that is involved in mediating cell-cell interactions [6].
Similarly, the QTL at Chr10:35 cM (CI = 28–69 cM) of the current B6-apoE x DBA-apoE cross overlaps withAath5at 26 cM (CI = 17–52 cM) which was significant in the DBA-apoE x 129-apoE cross (Fig 2B). The peak was not detected in the B6-apoE x 129-apoE cross, confirm-ing that the genomic features that are common in 129 and B6, but differ from DBA in this QTL region, confer susceptibility to arch atherosclerosis. While CIs of both QTLs are wide and the presence of more than two loci cannot be eliminated completely, atherosclerosis suscepti-bility loci likely reside within the range of 28–52 cM on this chromosome. Candidate genes of
Aath5, including a scavenger receptor,Stab2, were previously discussed [6].
In contrast, significant QTLs for arch atherosclerosis,Aath1,Aath2andAath3, found in the B6-apoE x 129-apoE cross, showed no corresponding peaks in either of the other two crosses (Fig 2C,Table 3), suggesting that some other chromosomal loci are interacting with these QTLs. We therefore examined possible interactions in the B6-apoE x 129-apoE cross. Scan-two analysis detected thatAath1on Chr1 probably interacts with Chr14. Thus, mice homozy-gous for the 129 alleles of both Chr1 at 50 cM and Chr14 at 25 cM have significantly larger pla-ques compared to those with other combinations of the loci (Fig 2D).
Scan-two analysis also showed thatAath2at Chr1:67 cM interacts with Chr8 at 13 cM in such a way that when Chr8 is homozygous for the 129 allele, noAath1genotype effects were present, but that if at least one allele of Chr8:13 cM is derived from B6, a strong effect ofAath2
genotype is revealed (Fig 2E). SinceAath2peak is present in the B6-apoE x 129-apoE cross, its candidates must be where 129 sequences differ from that of B6. If theAath2allele of DBA shares sequence with B6, the Chr8:13 cM sequence must be shared between 129 and DBA to explain the absence of the peak in the DBA-apoE x 129-apoE cross. If DBA and 129 share the same allele atAath2, then 129 and DBA are likely to share alleles at Chr8:13 cM to explain the absence of the peak in the B6-apoE x DBA-apoE cross. Thus although our round-robin crosses do not narrow theAath2interval, its potential interaction with Chr8:13 cM could help identify the causative variants underlyingAath2. Interestingly, Chr10:10 cM interacts with Chr12:40 cM significantly, and that 129 allele of the Chr12 has significant protective effect only when Chr10 is homozygous for B6 allele (Fig 2F). To further evaluate loci interactions, we performed genome-wide scans allowing for pair-wise interactions. “Stepwiseqtl” search algorithm con-firmed significant interaction between Chr12 and Chr10 (pLOD = 4.6).
The suggestive QTLs for root plaque sizes were detected in the B6-apoE
x DBA-apoE F2 population
A single locus scan for QTLs for atherosclerotic lesions at the aortic root using sex as an addi-tive covariate detected suggesaddi-tive QTLs on Chr2 (peak 74 cM, CI = 58–103 cM, LOD = 2.9,), Chr7 (peak 37 cM, CI = 23–48 cM, LOD = 3.0)) and Chr14 (peak 22 cM, CI = 7–32 cM, LOD = 2.6), contributing 6.8, 5.0 and 4.9% to the variance, respectively (Fig 3A,S5A and S5B
Fig,Table 4). Single-QTL genome scan for root plaque size with sex as an interactive covariate
Fig 3. LOD curves and allelic effect of QTL for root plaque size. (A) LOD curve for root lesion size with sex as additive
(Fig 3B,Table 4). Male only analysis revealed a suggestive QTL on Chr2 (peak 102 cM, CI = 57–103 cM, LOD = 2.9), accounting for 13.4% of the variance in root plaque size. The QTL scan among females only, on the other hand, revealed suggestive QTLs on Chr7 (peak 42 cM, CI = 23–52 cM, LOD = 2.8) and on Chr16 (peak 58 cM, CI = 3–58 cM, LOD = 2.7) which accounts for 8.0 and 7.6% of variance in root plaque size, respectively. The B6-allele on Chr7 is associated with a larger root plaque size compared with DBA allele, and has an additive effect (Fig 3C).
A search for two-locus interactions identified a putative interaction between Chr2 at 66 cM and chr10 at 48 cM contributing to 7.3% of the phenotypic variance (LOD-interaction = 3.8). This relationship suggests the DBA allele at Chr10 has divergent effects depending on genotype at Chr2 (Fig 3D). However, as for plaque size at the aortic arch, the Chr2-Chr10 interaction did not reach the threshold for genome-wide significance after accounting for multiple testing.
Comparisons of three crosses verify suggestive QTLs on Chr7 for aortic
root plaque size
Surprisingly, strong QTLs for aortic root plaques were identified only in one of the three round-robin crosses. Thus, highly significant QTL peak,Ath44, on Chr1 at 68 cM was present only in the DBA-apoE x 129-apoE F2 population (Fig 4A,Table 5). Similarly, the root plaque QTL on Chr9 at 33 cM was highly significant in the B6-apoE x 129-apoE F2, but was not detected either in the B6-apoE x DBA-apoE or in the DBA-apoE x 129-apoE F2 populations (Fig 4B). No significant interactions with these loci or other chromosomal locations were evi-dent.Ath45on Chr2 also appears complex, since it was highly significant in the DBA-apoE x 129-apoE F2 population, but suggestive peaks were present in the other two crosses (Fig 4C, Table 5). Multiple genetic variants may be affecting atherosclerosis in this chromosomal location.
using R/qtl software. (C) Allelic distribution of the main QTLs for plaque lesion size at root at the nearest marker to the peak at Chr 7 in female F2 mice from a cross B6-apoE X DBA-apoE. Data represent mean±SE. Comparison of lesion sizes were done by one-way analysis of variance (ANOVA) (p<0.01) followed by Tukey-Kramer’s HSD-test,**p<0.01 (D) Allelic distribution of the main effect QTLs for plaque size (μm2) subjected to square root transformation (sqrt) at the root in Chr 4 and Chr 6 in both
sexes in F2 mice from cross B6-apoE X DBA-apoE. Data represent mean±SE. Comparison of lesion sizes were done by one-way analysis of variance (ANOVA), followed by Tukey-Kramer’s HSD-test.***p = 0.001- B6/B6 genotype vs DBA/DBA genotype; # p<0.05- B6/B6 genotype vs B6/DBA genotype, ## p<0.01- B6/B6 genotype vs B6/DBA genotype.
https://doi.org/10.1371/journal.pone.0182882.g003
Table 4. QTLs for atherosclerosis at the aortic root in F2 mice from intercross between DBA2-apoE and B6-apoE.
Chr Peak
(cM) CI (cM)
Peak (Mb)
CI (Mb)
LOD Significance High allele Mode of inheritance %
Root
Female+male 2 74 58–103 149 114–181 2.9 Suggestive DBA Dominant 6.8
7 37 23–48 68 37–84 3.0 Suggestive B6 Additive 5.0
14 22 7–32 40 16–61 2.6 Suggestive B6 Recessive 4.9
Female 7 42 23–52 71 37–89 2.8 Suggestive B6 Dominant 8.0
16 58 3–58 94 56–94 2.7 Suggestive DBA Additive 7.6
Male 2 102 57–103 189 131–193 2.9 Suggestive DBA Additive 13.4
CI, 95% credible interval; LOD, logarithm of odds; LOD score for sex-combined scan shown in Table 4 was determined in single locus scan using sex as additive; the significance thresholds for LOD scores were determined by 1000 permutations using R/qtl software; for each QTL, model of inheritance was determined according to allelic effect at the nearest marker of a QTL by performing Haley-Knott regression using the additive and dominant/recessive models; % Variance indicates the percentage of the total F2 phenotypic variance.
Among the QTLs for root plaques, however, a QTL on Chr7 was suggestive in B6-apoE x DBA-apoE F2 population in both sex-combined (peak at 37 cM) and female-only (peak at 42 cM) scans. This QTL overlaps with a suggestive QTL on Chr7 found in DBA-apoE x 129-apoE F2 mice (Table 5). The peak was absent at the corresponding location in B6-apoE x 129-apoE F2 mice (Fig 4D). This suggests that the DBA allele of the QTL within 31–48 cM of Chr7 is athero-protective over the allele shared by B6 and 129. Further analysis showed that there are 51 genes at which B6 mice share a haplotype with 129, but differ from DBA mice. Twenty five genes contain amino acid substitutions, of which 10 are predicted as potentially damaging by SIFT and/or PROVEAN prediction programs (S3 Table). In addition to qualitative changes in
Fig 4. LOD curves of QTLs for plaque lesion size at root. (A-D) LOD curves of QTL for plaque lesion size at root in
sex-combined (A,B, C) scans on Chr1 (A), Chr9 (B), Chr2 (C) and female-only (D) scan on Chr7 (D) cross between B6-apoE and DBA-apoE (red lines), cross between B6-DBA-apoE and 129-DBA-apoE mice (black lines) and cross between DBA-DBA-apoE and 129-DBA-apoE mice (blue lines). The horizontal dashed and dotted lines represent thresholds for suggestive QTL (p = 0.63) and significant QTL (p = 0.05) determined in single locus scan of crosses between B6-apoE x DBA-apoE mice. The significance thresholds for LOD scores were determined by 1000 permutations using R/qtl software.
the protein structure, genetic variants could also affect quantitatively the amount of gene prod-ucts. Analysis of our previous microarray data of gene expression in the aortas of wild type B6, 129 and DBA mice (GEO accession number- GSE53006) [6] found several genes whose expression in DBA aortas are either higher or lower than in 129 and B6 (S4 Table). Chr7: 62.5– 65 Mb is also remarkable that the SNPs in this region are associated significantly with the expression of multiple genes in trans. Together, we narrowed down the list of candidate genes on Chr7 that may contribute to formation of atherosclerotic plaques, which includeAtp10a,
Pcsk6andMctp2. SNPs in or near these genes are associated with cardiovascular diseases in humans [20,21,22].
Discussion
To determine the genetic factors that affect susceptibility to atherosclerosis in a vascular loca-tion-dependent manner, we performed genome wide scans for QTLs in F2 progeny from an intercross ofApoe-null mice on B6 and DBA backgrounds. Our study revealed a significant QTL on Chr2 (peak 66 cM) and a suggestive QTL on Chr10 (peak 35 cM) that influence aortic arch lesion. These QTLs respectively overlap withAath4andAath5that were previously found in the F2 population from a cross ofApoe-null mice on DBA and 129 backgrounds. For the plaques at the aortic roots, we identified only suggestive QTLs. Among them a QTL on Chr7 at 37 cM also overlaps with a suggestive QTL found in the cross between theApoe-null mice on DBA and 129 backgrounds. Since none of these QTLs were found in the cross between B6-apoE and 129-apoE, our data confirms that DBA specific sequences in these QTLs influ-ence atherosclerosis susceptibility positively or negatively over the 129 and B6 sequinflu-ences.
The current cross closes the circle of F2 populations generated using round-robin design fromApoe-null mice on three genetic backgrounds, 129, B6 and DBA (129-apoE x B6-apoE, 129-apoE x DBA-apoE, B6-apoE x DBA-apoE). Genetic analysis of round-robin crosses helps to validate some QTLs, identify epistaticaly interacting loci and narrow the list of candidate genes. Using round-robin design in our three crosses, we expected QTLs with large additive effects and strong penetrance to be detectable in two out of the three crosses, because every genetic variant was brought at least two times. Indeed, confirmation of the three QTLs above assures that the inheritance of these loci is likely to be simple, and provides an important step towards our goal of identifying genetic variants that influence atherosclerosis susceptibility dif-ferently at different aortic locations. In our earlier study, we have predicted that the DBA spe-cific variants ofAath4on Chr2 andAath5on Chr10 are likely responsible for the susceptibility and protection, respectively, for the aortic arch plaques [6]. Our current study fully supports these predictions.
Table 5. QTLs for atherosclerotic lesions at root in three F2 intercrosses of Apoe-null mice on B6, DBA and 129 backgrounds.
QTL Chr Peak (CI), cM B6-apoE x DBA-apoE DBA-apoE x 129-apoE B6-apoE x 129-apoE Consistency Overlap
Ath44 1 68 (64–74) - DBA>129, rec - No Ath1
Ath45 2 83 (78–85) DBA>B6, add DBA>129, add B6>129, dom, M ? Athla1
Ath29 9 33 (25–39) - - B6>129, add, M No Ath29
Ath31 7 41 (31–50) B6>DBA, dom, F 129>DBA, dom, F - 129=B66¼DBA Ath3, Aorls2
Ath31
QTL, quatitative trait locus: Chr, chromosome; CI, 95% credible interval., add, additive; dom, dominant, rec, recessive; F-female only scan, M- male only scan; significant QTLs are shown in bold, other QTLs are suggestive.>shows allelic relationship. For example, DBA>129 indicates that F2 mice homozygous for DBA allele at the locus develop larger plaque than those with 129 allele.
Surprisingly, however, many of the QTLs were significant only in one of the crosses and lacked even suggestive peaks in the other two crosses. Observation of QTL in one cross only can be explained by absence of statistical power, epistasis or others factors [23]. Certainly, sta-tistical power to determine QTLs is affected by a sample size (number of animals in F2 popula-tion) and effect size. Using QTL Design Program, we estimated that for effect size 20X104μm2 statistical power to determine QTLs for atherosclerosis at aortic arch in our cross B6-apoE x DBA-apoE (n = 232) is about 0.99 if genetic variance is modest. However, minimum detectable effect size (power = 0.8) for atherosclerotic lesion at arch in this cross is about 15X104μm2if mode inheritance is additive. Therefore, relatively small sample size of F2 population (232 mice) in our study may result in our failure to determine QTLs with small effect size (>15X104
μm2for arch lesion) and overestimation of effect size of detected QTLs (“Beavis effect”) [24, 25]. Another explanation for the background effect is the presence of gene-gene interaction (epistasis).Aath1andAath2on Chr1 for aortic arch plaques may represent such an example, since we have detected possible interactions, including,Aath1with Chr14, andAath2with Chr8. This could explain our failure to detect the particular QTLs in other crosses than in B6-apoE x 129-apoE. These interactions were, however, not significant in “stepwise” analysis. Furthermore, there were no suggestive interactions revealed involvingAath3on Chr15, a female specific aortic arch lesion QTL [5]. Similarly, no interactions were found involving root plaque significant QTLs on Chr9 in cross between B6-apoE and 129-apoE or on Chr1 in B6-apoE x DBA-apoE cross [4,5]. Interactions between more than two loci are also possible but were not examined since the numbers of samples used in these studies severely limits the power of scans for multiple epistasis.
The presence of multiple loci affecting atherosclerosis development could result in non-detectable QTL peak at a certain locus in some crosses when their combined effects become negligible. This is likely, since each QTL has a broad credible interval that can contain genomic regions with mixed haplotype sharing patterns. It could also explain theAth45on Chr2 (peak 83 cM, CI = 77–86 cM, DBA high) found in the DBA-apoE x 129-apoE cross [4] that overlaps with a suggestive QTL (peak 74 cM, CI = 58–103 cM, DBA high) in the B6-apoE x DBA-apoE cross as well as a suggestive QTL (peak 76 cM, CI = 57–85 cM, B6 high) in the B6-apoE x 129-apoE cross.
Finally, we note that the design of crosses may have influenced the outcome of our experi-ments. Thus in previous crosses to generate F2 population we mated 129-apoE males with B6-apoE or DBA-apoE females, while in the current cross DBA-apoE males were mated with B6-apoE females. A parent-of-origin effect on atherosclerosis susceptibility was evident in the study by Breslow and colleagues [26], in which the authors observed striking differences in LOD scores for QTL peaks on Chr3 and Chr12 when B6-Ldlr-null males were mated with FVB-Ldrl-null females versus when FVB-Ldrl-null males were mated with B6-Ldrl-null females. Effects of sex chromosomes and mitochondrial DNA on the development of athero-sclerosis have not been adequately addressed. Overall, inheritance of atheroathero-sclerosis risk may be complicated by the involvement of multiple genes, gene-by-gene interaction or different epistatic interactions dependent on genetic background and gender. Understanding the mech-anisms for these phenomena will be challenging, although important.
Most QTL studies on atherosclerosis in mice have focused on lesion development at the aortic root, and multiple overlapping QTLs identified in these experiments could also help the analysis of our three crosses. Thus, the QTL on Chr7 (peak 37 cM, CI = 23–48 cM), DBA allele which is protective for B6 root atherosclerosis, co-localizes with the female-specificAth31
DBA cross with wild-typeApoe[29]. If the same causative variants underlie all these QTLs, the variants are likely shared by 129 and B6 but differ from DBA, A/J and C3H. However, no DNA variant with such sharing pattern was found on Chr7 in the 23–48 cM range. Indeed the haplotype comparison of the region indicates that 129 and C3H are identical by descent over the entire range, and only a few unique variants were found by Sanger sequence analysis. We note that the region spans a cluster of imprinted genes and is homologous to human Chr15 that contains the genes causing Prader-Willi and Angelman syndromes and that imprinting of some of our candidate genes, includingAtp10a, in mice have been described [30]. Further-more, a high-fat, high-cholesterol diet was used to provoke atherosclerosis in the cross between B6-apoE-and C3H-apoE [31], while mice in our three crosses were maintained on normal chow, and the diet might have subtly influenced the results. A cross between 129-apoE and C3H-apoE mice could help dissect the basis for this conflict.
In summary, our study of three F2 populations generated from circular crosses ofApoe-null mice on three genetic backgrounds have validated three QTLs contributing to the develop-ment of atherosclerosis that are specific for particular vascular beds and suggested some candi-date genes. Further analysis would shed new light on understanding the role of genetic factors in the progression of atherosclerosis.
Supporting information
S1 Fig. Image of the plaque areas in the different vascular locations. (A) Innercurve of aor-tic arch (aoraor-tic arch). (B) Innominate artery. (C) Left common carotid artery. (D) Subclavian artery plus upper wall.
(TIF)
S2 Fig. Correlations between plaque sizes at root and plasma lipids. (A, B) Correlations of root plaque sizes with total cholesterol in F2 males (A) and females (B) of a cross between B6-apoE and DBA-apoE mice. (C, D) Correlations of root plaque sizes with HDL-cholesterol in F2 males (C) and females (D) of the cross between B6-apoE and DBA-apoE mice. (E, F) Correlations of root plaque sizes with triglycerides in F2 males (E) and females (F) of the cross between B6-apoE and DBA-apoE mice. A multivariate regression model was used to deter-mine correlations between root plaque sizes and plasma lipids.
(TIF)
S3 Fig. Correlations between plaque sizes at arch and plasma lipids. (A, B) Correlations of arch plaque sizes with total cholesterol in F2 males (A) and females (B) of a cross between B6-apoE and DBA-apoE mice. (C, D) Correlations of arch plaque sizes with HDL-cholesterol in F2 males (C) and females (D) the of cross between B6-apoE and DBA-apoE mice. (E, F) Correlations of arch plaque sizes with triglycerides in F2 males (E) and females (F) of the cross between B6-apoE and DBA-apoE mice. A multivariate regression model was used to deter-mine correlations between arch plaque sizes and plasma lipids.
(TIF)
line represents a threshold for a significant QTL (p = 0.05) in the sex-additive model. The sig-nificance thresholds for LOD scores were determined by 1000 permutations using R/qtl soft-ware. (C) LOD curve for arch lesion size with sex as an interactive (magenta line) covariate in F2 mice from a cross B6-apoE x DBA-apoE. The horizontal dashed line represents a threshold for a suggestive (p = 0.63) QTL and a dotted line represents a threshold for a significant QTL (p = 0.05) in the sex-interactive model. The significance thresholds for LOD scores were deter-mined by 1000 permutations using R/qtl software.
(TIF)
S5 Fig. LOD curves and allelic distribution of QTLs for root plaque size. (A) LOD curve for root lesion size with sex as an additive (red line) and an interactive (magenta line) covariates in F2 mice from a cross B6-apoE x DBA-apoE. The horizontal dashed line represents a threshold for a suggestive (p = 0.63) QTL and a dotted line represents a threshold for a significant QTL (p = 0.05) in the sex-additive model. The significance thresholds for LOD scores were deter-mined by 1000 permutations using R/qtl software. (B) LOD curve for root lesion size with sex as an additive (red line) covariate in F2 mice from a cross B6-apoE x DBA-apoE. The horizon-tal dashed line represents a threshold for a suggestive (p = 0.63) QTL and a dotted line repre-sents a threshold for a significant QTL (p = 0.05) in the sex-additive model. The significance thresholds for LOD scores were determined by 1000 permutations using R/qtl software. (C) LOD curve for root lesion size with sex as an interactive (magenta line) covariate in F2 mice from a cross B6-apoE x DBA-apoE. The horizontal dashed line represents a threshold for a suggestive (p = 0.63) QTL and a dotted line represents a threshold for a significant QTL (p = 0.05) in the sex-interactive model. The significance thresholds for LOD scores were deter-mined by 1000 permutations using R/qtl software.
(TIF)
S1 Table. QTLs for atherosclerosis at the aortic arch in F2 mice from intercross between DBA-apoE and B6-apoE mice. F, female; M, male; Chr, chromosome; CI, 95% credible inter-val; LOD, logarithm of odds; LOD score for sex-combined scan shown in Table was deter-mined in single locus scan using sex as additive; for each QTL, model of inheritance was determined according to allelic effect at the nearest marker of a QTL by performing Haley-Knott regression using the additive and dominant/recessive models; ratio (d/a) was used to determine mode of inheritance [12,13]: 0.5<|d/a|<1.5 –dominant or recessive;d/a= 0
−pure additive; |d/a|0.5-additive; |d/a|1.5—overdominant or overrecessive; % variance indicates the percentage of the total F2 phenotypic variance.
(DOCX)
S2 Table. QTLs for atherosclerosis at the aortic root in F2 Mice from intercross between DBA-apoE and B6-apoE mice. F, female; M, male; Chr, chromosome; CI, 95% credible inter-val; LOD, logarithm of odds; LOD score for sex-combined scan shown in Table was deter-mined in single locus scan using sex as additive; for each QTL, model of inheritance was determined according to allelic effect at the nearest marker of a QTL by performing Haley-Knott regression using the additive and dominant/recessive models; ratio (d/a) was used to determine mode of inheritance [12,13]: 0.5<|d/a|<1.5 –dominant or recessive;d/a= 0
−pure additive; |d/a|0.5-additive; |d/a|1.5—overdominant or overrecessive; % variance indicates the percentage of the total F2 phenotypic variance.
(DOCX)
[6] are shown. Values are mean±SE of the intensity values from three samples pooled from 5 aortic arches per strain, and statistical analysis was carried out using one-way ANOVA; Chr, chromosome; CI, 95% credible interval.
(DOCX)
S4 Table. Aortic arch expression of genes near Chr 7, CI = 23-48cM (37-84Mb) that differs between B6 and DBA mice. Expression levels of the genes in the aortic arch were estimated by the microarray analyses of the wild-type C57BL/6J (B6), DBA/2J (DBA) and 129S6/SvEvTac (129) strains [6] are shown. Values are mean±SE of the intensity values from three samples pooled from 5 aortic arches per strain, and statistical analysis was carried out using one-way ANOVA; Chr, chromosome; CI, 95% credible interval.
(DOCX)
Acknowledgments
We thank Dr. Marlon Lawrence and Dr, Feng Li for critical reading of the manuscript, and Dr Oliver Smithies for his encouragement.
Author Contributions
Conceptualization: Natalia Makhanova, Andrew P. Morgan, Fernando Pardo-Manuel de Vil-lena, Nobuyo Maeda.
Data curation: Andrew P. Morgan, Yukako Kayashima, Nobuyo Maeda.
Formal analysis: Natalia Makhanova, Andrew P. Morgan, Andrei Makhanov.
Funding acquisition: Nobuyo Maeda.
Investigation: Natalia Makhanova, Svetlana Zhilicheva, Nobuyo Maeda.
Methodology: Natalia Makhanova, Andrew P. Morgan, Sylvia Hiller, Longquan Xu, Fernando Pardo-Manuel de Villena.
Project administration: Nobuyo Maeda.
Resources: Svetlana Zhilicheva, Longquan Xu.
Software: Andrew P. Morgan, Yukako Kayashima, Andrei Makhanov.
Supervision: Nobuyo Maeda.
Validation: Yukako Kayashima, Sylvia Hiller, Svetlana Zhilicheva, Longquan Xu.
Visualization: Andrei Makhanov, Sylvia Hiller, Svetlana Zhilicheva, Longquan Xu.
Writing – original draft: Natalia Makhanova, Andrew P. Morgan, Yukako Kayashima, Sylvia Hiller, Fernando Pardo-Manuel de Villena, Nobuyo Maeda.
Writing – review & editing: Natalia Makhanova, Nobuyo Maeda.
References
1. Kessler T, Vilne B, Schunkert H. The impact of genome-wide association studies on the pathophysiol-ogy and therapy of cardiovascular disease. EMBO Mol Med. 2016; 8(7): 688–701.https://doi.org/10. 15252/emmm.201506174PMID:27189168
3. Maeda N, Johnson L, Kim S, Hagaman J, Friedman M, Reddick R. Anatomical differences and ath-erosclerosis in apolipoprotein E-deficient mice with 129/SvEv and C57BL/6 genetic backgrounds. Atherosclerosis. 2007; 195: 75–82.https://doi.org/10.1016/j.atherosclerosis.2006.12.006PMID: 17275002
4. Kayashima Y, Tomita H, Zhilicheva S, Kim S, Kim HS, Bennett BJ, et al. Quantitative trait loci affecting atherosclerosis at the aortic root identified in an intercross between DBA2J and 129S6 apolipoprotein E-null mice. PLoS One. 2014; 9: e88274.https://doi.org/10.1371/journal.pone.0088274PMID: 24586312
5. Tomita H, Zhilicheva S, Kim S, Maeda N. Aortic arch curvature and atherosclerosis have overlapping quantitative trait loci in a cross between 129S6/SvEvTac and C57BL/6J apolipoprotein E-null mice. Circ Res. 2010; 106: 1052–1060.https://doi.org/10.1161/CIRCRESAHA.109.207175PMID:20133902
6. Kayashima Y, Makhanova NA, Matsuki K, Tomita H, Bennett BJ, Maeda N. Identification of aortic arch-specific quantitative trait loci for atherosclerosis by an intercross of DBA/2J and 129S6 apolipoprotein E-deficient mice. PLoS One. 2015; 10(2): e0117478.https://doi.org/10.1371/journal.pone.0117478 PMID:25689165
7. Piedrahita JA, Zhang SH, Hagaman JR, Oliver PM, Maeda N. Generation of mice carrying a mutant apolipoprotein E gene inactivated by gene targeting in embryonic stem cells. Proc Natl Acad Sci U S A. 1992; 89(10): 4471–4475. PMID:1584779
8. Zhang SH, Reddick RL, Piedrahita JA, Maeda N. Spontaneous hypercholesterolemia and arterial lesions in mice lacking apolipoprotein E. Science. 1992; 258: 468–471. PMID:1411543
9. Warnick GR, Nguyen T, Albers AA. Comparison of improved precipitation methods for quantification of high-density lipoprotein cholesterol. Clin Chem. 1985; 31: 217–222. PMID:2578337
10. Morgan AP, Holt JM, McMullan RC, Bell TA, Clayshulte AM, Didion JP, et al. The Evolutionary Fates of a Large Segmental Duplication in Mouse. Genetics. 2016; 204: 267–285.https://doi.org/10.1534/ genetics.116.191007PMID:27371833
11. Abiola O, Angel JM, Avner P, Bachmanov AA, Belknap JK, Bennett B, et al. Complex Trait Consortium The nature and identification of quantitative trait loci: a community’s view. Nat Rev Genet. 2003; 4: 911– 916.https://doi.org/10.1038/nrg1206PMID:14634638
12. Kenney-Hunt JP, Vaughn TT, Pletscher LS, Peripato A, Routman E, Cothran K, et al. Quantitative trait loci for body size components in mice. Mamm Genome. 2006; 17: 526–537.https://doi.org/10.1007/ s00335-005-0160-6PMID:16783635
13. Kenney-Hunt JP, Wang B, Norgard EA, Fawcett G, Falk D, Pletscher LS, et al. Pleiotropic patterns of quantitative trait loci for 70 murine skeletal traits. Genetics. 2008; 178: 2275–2288.https://doi.org/10. 1534/genetics.107.084434PMID:18430949
14. Broman K., Sen S. A Guide to QTL Mapping with R/qtl. New York: Springer; 2009.
15. Sen S, Satagopan JM, Broman KW, Churchill GA. R/qtl Design: inbred line cross experimental design. Mamm Genome. 2007; 18(2): 87–93.https://doi.org/10.1007/s00335-006-0090-yPMID:17347894
16. Wang JR, de Villena FP, McMillan L. Comparative analysis and visualization of multiple collinear genomes. BMC Bioinformatics. 2012; 13: S13.
17. Kumar P, Henikoff S, Ng PC. Predicting the effects of coding non-synonymous variants on protein func-tion using the SIFT algorithm. Nat Protoc. 2009; 4: 1073–1081.https://doi.org/10.1038/nprot.2009.86 PMID:19561590
18. Choi Y, Chan AP. PROVEAN web server: a tool to predict the functional effect of amino acid substitu-tions and indels. Bioinformatics. 2015; 31(16): 2745–2747.https://doi.org/10.1093/bioinformatics/ btv195PMID:25851949
19. Bennett BJ, Farber CR, Orozco L, Kang HM, Ghazalpour A, Siemers N, et al. A high-resolution associa-tion mapping panel for the dissecassocia-tion of complex traits in mice. Genome Res. 2010; 20: 281–290. https://doi.org/10.1101/gr.099234.109PMID:20054062
20. Irvin MR, Wineinger NE, Rice TK, Pajewski NM, Kabagambe EK, Gu CC, et al. Genome-wide detection of allele specific copy number variation associated with insulin resistance in African Americans from the HyperGEN study. PLoS One. 2011; 6(8): e24052.https://doi.org/10.1371/journal.pone.0024052PMID: 21901158
21. Ganesh SK, Tragante V, Guo W, Guo Y, Lanktree MB, Smith EN, et al. Loci influencing blood pressure identified using a cardiovascular gene-centric array. Hum Mol Genet. 2013; 22(8): 1663–1678.https:// doi.org/10.1093/hmg/dds555PMID:23303523
23. Treusch S, Albert FW, Bloom JS, Kotenko IE, Kruglyak L. Genetic mapping of MAPK-mediated com-plex traits Across S. cerevisiae. PLoS Genet. 2015; 11(1): e1004913.https://doi.org/10.1371/journal. pgen.1004913PMID:25569670
24. Beavis WD. The power and deceit of QTL experiments: Lessons from comparative QTL studies. In: Wil-kinson DB, editor. 49th Annual Corn and Sorghum Industry Research Conference. Chicago: American Seed Trade Assoc; 1994. pp. 250–266.
25. Beavis WD. QTL analyses: power, precision and accuracy. In: Paterson A.H, editor. Molecular dissec-tion of complex traits. Boca Raton: CRC Press; 1998. pp.145–162.
26. Teupser D, Tan M, Persky AD, Breslow JL. Atherosclerosis quantitative trait loci are sex- and lineage-dependent in an intercross of C57BL/6 and FVB/N low-density lipoprotein receptor-/- mice. Proc Natl Acad Sci USA. 2006; 103: 123–128.https://doi.org/10.1073/pnas.0509570102PMID:16380418
27. Wang SS, Shi W, Wang X, Velky L, Greenlee S, Wang MT, et al. Mapping, genetic isolation, and char-acterization of genetic loci that determine resistance to atherosclerosis in C3H mice. Arterioscler Thromb Vasc Biol. 2007; 27: 2671–2676.https://doi.org/10.1161/ATVBAHA.107.148106PMID: 17916774
28. Stewart-Phillips JL, Lough J, Skamene E. ATH-3, a new gene for atherosclerosis in the mouse. Clin Invest Med. 1989; 12: 121–126. PMID:2706836
29. Colinayo VV, Qiao JH, Wang X, Krass KL, Schadt E, Lusis AJ, et al. Genetic loci for diet-induced athero-sclerotic lesions and plasma lipids in mice. Mamm Genome. 2003; 14: 464–471.https://doi.org/10. 1007/s00335-002-2187-2PMID:12925895
30. Mann MR, Bartolomei MS. Towards a molecular understanding of Prader-Willi and Angelman syn-dromes. Hum Mol Genet. 1999; 8: 1867–1873. PMID:10469839