The genetics of blood pressure regulation and its target organs
from association studies in 342,415 individuals
A full list of authors and affiliations appears at the end of the article.
# These authors contributed equally to this work.
Abstract
To dissect the genetic architecture of blood pressure and assess effects on target-organ damage, we analyzed 128,272 SNPs from targeted and genome-wide arrays in 201,529 individuals of
European ancestry and genotypes from an additional 140,886 individuals were used for validation. We identified 66 blood pressure loci, of which 17 were novel and 15 harbored multiple distinct association signals. The 66 index SNPs were enriched for cis-regulatory elements, particularly in vascular endothelial cells, consistent with a primary role in blood pressure control through modulation of vascular tone across multiple tissues. The 66 index SNPs combined in a risk score showed comparable effects in 64,421 individuals of non-European descent. The 66-SNP blood pressure risk score was significantly associated with target-organ damage in multiple tissues, with minor effects in the kidney. Our findings expand current knowledge of blood pressure pathways and highlight tissues beyond the classic renal system in blood pressure regulation.
INTRODUCTION
There are considerable physiological, clinical and genetic data that point to the kidney as the major regulator of blood pressure (BP) and to renal damage as a consequence of long-term BP elevation. However, alternative hypotheses, such as increasing systemic vascular resistance, are also serious contenders to explain the rise of BP with increasing age, but with limited genetic support. The genetic basis of elevated blood pressure or hypertension (HTN)
involves many loci that have been identified using large-scale analyses of candidate genes1,2,
linkage studies, and genome-wide association studies (GWAS)3-12. The genes underlying BP
regulation can help resolve many of the open questions regarding BP (patho-) physiology.
Users may view, print, copy, and download text and data-mine the content in such documents, for the purposes of academic research, subject always to the full Conditions of use:http://www.nature.com/authors/editorial_policies/license.html#terms
Corresponding authors: Christopher Newton-Cheh ([email protected]) and Patricia B. Munroe ([email protected]).
#These authors jointly supervised this work.
57A list of members and affiliations appears in the Supplementary Note SUPPLEMENTARY NOTE
Supplementary Note is available in the online version of the paper. URLs
http://hgdownload.cse.ucsc.edu/goldenPath/hg19/encodeDCC/wgEncodeUwDnase for enrichment analyses. Accessed 3/13/2013.
http://www.genome.gov/gwastudies for enrichment analyses. Accessed 3/13/2013.
http://genome.ucsc.edu/ENCODE/cellTypes.html for enrichment analyses. Accessed 3/13/2013.
HHS Public Access
Author manuscript
Nat Genet
. Author manuscript; available in PMC 2017 March 12.Published in final edited form as:
Nat Genet. 2016 October ; 48(10): 1171–1184. doi:10.1038/ng.3667.
A
uthor Man
uscr
ipt
A
uthor Man
uscr
ipt
A
uthor Man
uscr
ipt
A
uthor Man
uscr
While ~40-50% of BP variability is heritable13,14, the genetic variation identified to date
explains only ~2%1-12.
The Cardio-MetaboChip is a custom genotyping microarray designed to facilitate cost-effective follow-up of nominal associations for metabolic and cardiovascular traits, including BP. This array comprises 196,725 variants, including ~5,000 SNPs with nominal (P <0.016)
evidence of BP association in our previous GWAS meta-analysis5. Furthermore, the array
includes several dense scaffolds for fine mapping of selected loci spanning, on average,
genomic regions of 350 kilobases5,16, of which 24 include genome-wide significant BP
association in the current study5,16.
RESULTS
Novel genetic loci associated with systolic and diastolic BP
We performed meta-analyses of association summary statistics from a total of 201,529 individuals of European (EUR) ancestry from 74 studies: (i) 109,096 individuals from 46 studies genotyped on Cardio-MetaboChip; and (ii) 92,433 individuals from 28 studies with imputed genotype data from genome-wide genotyping at variants included on the Cardio-MetaboChip. Twenty-four of the 28 studies with genome-wide genotyping data had
contributed to previous analyses (Supplementary Tables 1-3)5,7.
BP was measured using standardized protocols in all studies5,17 (Supplementary Table 1,
Online methods). Association statistics for systolic and diastolic BP (SBP and DBP) in
models adjusting for age, age2, sex, and body mass index (BMI), were obtained for each
study separately, with study-specific genomic control applied to correct for possible population structure. Fixed-effects meta-analysis proceeded in 4 stages, separately for the following SNP associations: Stage 1, using results based on 46 studies using Cardio-MetaboChip genotypes of 109,096 participants; Stage 2, using additional results based on imputed genotypes from genome-wide genotyping arrays in 4 previously unpublished studies; Stage 3 using imputed genotypes from genome-wide genotyping arrays in 24
previously published studies5; and Stage 4, the joint meta-analysis of Stages 1-3 including a
total of 201,529 independent individuals (Supplementary Figure 1, Supplementary Tables 2-3, Supplementary Note). To account for population structure between studies in Stages 1-3 of our meta-analysis, genomic control correction was applied to meta-analysis results from each of these stages in an approach aggregating summary statistics from GWAS and
Cardio-MetaboChip studies18,19.
After stage 4, 67 loci attained genome-wide significance (P < 5 × 10⁻⁸), 18 of which were
not previously reported in the literature (Supplementary Table 4). Quantile-quantile plots of the stage 4 meta-analysis showed an excess of small P values, with an elevated genomic control lambda estimate that was persistent, albeit attenuated, after excluding all 66 loci (Supplementary Figure 2). This observation is compatible with either residual uncorrected population stratification or the presence of a large number of variants that are truly
associated with BP but fail to achieve genome-wide significance in the current
meta-analysis. The Cardio-MetaboChip array's inclusion of SNPs from a prior BP GWAS5 does
not appear to be the sole explanation, as we did not observe a significant decrease of the
A
uthor Man
uscr
ipt
A
uthor Man
uscr
ipt
A
uthor Man
uscr
ipt
A
uthor Man
uscr
excess of small P values after exclusion of all SNPs that were included on the Cardio-MetaboChip based on nominal BP association (Supplementary Figures 3 and 4). Since the quantile-quantile plots continued to show deviation from the null expectation, we sought additional validation for 18 variants attaining genome-wide significance, but without prior support in the literature, in up to 140,886 individuals of European ancestry from UK
Biobank20. For these SNPs, we performed a stage 5 meta-analysis combining the association
summary statistics from stage 4 and UK Biobank, in a total of up to 342,415 individuals (Supplementary Table 5).
Upon stage 5 meta-analysis, 17 of 18 variants retained genome-wide significance for the primary trait (SBP or DBP result with the lower P value). The one variant that was not
genome-wide significant had a borderline P value of 4.49 × 10⁻⁸ at stage 4. These findings
are consistent with appropriate calibration of the association test statistics at stage 4 such that observing one failure among 18 validation tests is consistent with the use of a threshold
(P < 5 × 10⁻⁸) designed to have a 1 in 20 chance of a result as or more extreme solely due to
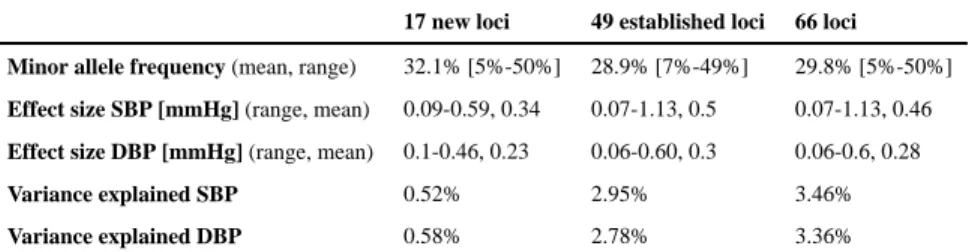
chance. In total, 66 loci attained genome-wide significance: 13 loci for SBP only, 12 loci for DBP only, and 41 loci for both traits. Of these, 17 BP loci were novel, while 49 were previously reported at genome-wide significance (Table 1 and Figure 1).
Compared with previously reported BP variants5,7,21, the average absolute effect size of the
newly discovered variants is smaller, with comparable minor allele frequency (MAF), presumably owing to the increased power of a larger sample size (Table 2). As expected from the high correlation between SBP and DBP effects, the observed directions of effects for the two traits were generally concordant (Supplementary Figure 5), and the absolute effect sizes were inversely correlated with MAF (Table 1 and Supplementary Figure 6). The 66 BP SNPs explained 3.46% and 3.36% of SBP and DBP variance, respectively, a modest increase from 2.95% and 2.78% for SBP and DBP, respectively, for the 49 previously reported SNPs (Supplementary Note). The low percent variance explained is consistent with estimates that large numbers of common variants with weak effects at a large
number of loci influence BP5.
Signal refinement at the 66 BP loci
To identify distinct signals of association at the 66 BP loci and the variants most likely to be causal for each, we started with an approximate conditional analysis using a model selection
procedure implemented in the GCTA-COJO package22,23 as well as a detailed literature
review of all published BP association studies. GCTA-COJO analysis was performed using the association summary statistics for SBP and DBP from the Stage 4 EUR ancestry meta-analyses, with the linkage disequilibrium (LD) between variants estimated on the basis of Cardio-MetaboChip genotype data from 7,006 individuals of EUR ancestry from the
GoDARTS cohort24. More than one distinct BP association signal was identified at 13 loci at
P < 5 × 10⁻⁸ (Supplementary Table 6, Supplementary Figures 7, and Supplementary
Note). At six loci, the distinct signals were identified for both SBP and DBP analyzed separately; these trait-specific associations were represented by the same or highly
correlated (r2 > 0.8) SNPs at 5 of the 6 loci (Supplementary Tables 7 and 8). We repeated
GCTA-COJO analyses using the same summary association results, but with a different
A
uthor Man
uscr
ipt
A
uthor Man
uscr
ipt
A
uthor Man
uscr
ipt
A
uthor Man
uscr
reference sample for LD estimates (WTCCC1-T2D/58BC, N = 2,947, Supplementary Note) and observed minimal differences arising from minor fluctuations in the association P value in the joint regression models (Supplementary Tables 7 and 8). LD-based
comparisons of published association signals at established BP loci, and the current study's findings suggested that at 10 loci, the signals identified by the single-SNP and the GCTA-COJO analyses were distinct from those reported in the literature (Supplementary Table 9).
We then performed multivariable regression modeling in a single large cohort (Women's Genome Health Study, WGHS, N = 23,047) with simultaneous adjustment for both 1) all combinations of putative index SNPs for each distinct signal from the GCTA-COJO conditional analyses, and 2) all index SNPs for all potential distinct signals identified by our literature review (Supplementary Table 9, Supplementary Note). Although WGHS is very large as a single study, power is reduced in a single sample compared to that in the overall meta-analysis (23k vs. 342k individuals) and consequently the failure to reach significance does not represent non-replication for individual SNPs. The WGHS analysis supported two distinct association signals at eight of 13 loci identified in the GCTA-COJO analysis, but could not provide support for the remaining five (Supplementary Table 10). The joint SNP modeling in WGHS additionally supported two distinct signals of association at three other loci (GUCY1A3-GUCY1B3, SYNPO2L and TBX5-TBX3), at which the SNP identified in
the current study is distinct from that previously reported in the literature5,11.
We sought to refine the localization of likely functional variants at loci with high-density coverage on the Cardio-MetaboChip. We followed a Bayesian approach to define, for each signal, credible sets of variants that have 99% probability of containing or tagging the causal variant (Supplementary Note). To improve the resolution of the method, the analyses were restricted to 24 regions selected to fine map (FM) genetic associations, and that included at least one SNP reaching genome-wide significance in the current meta-analyses
(Supplementary Table 11). Twenty-one of the Cardio-MetaboChip FM regions were BP loci in the original design, with three of the newly discovered BP loci in FM regions that were originally selected for other non-BP traits. We observed that the 99% credible SNP sets at five BP loci spanned <20kb. The greatest refinement was observed at the SLC39A8 locus for SBP and DBP, and at the ZC3HC1 and PLCE1 loci for DBP, where the 99% credible sets included only the index variants (Supplementary Table 12). Although SNPs in credible sets were primarily non-coding, they included one synonymous and seven non-synonymous variants that attained high posterior probability of driving seven distinct association signals at six BP loci (Supplementary Table 12). Of these, three variants alone account for more than 95% of the posterior probability of driving the association signal observed at each of three loci (Supplementary Table 12 and 13). Despite reduced statistical power, the analyses restricted to the samples with Cardio-MetaboChip genotypes only (N = 109,096) identified the majority of SNPs identified in the GWAS+Cardio-MetaboChip data (Supplementary Table 12). The full list of SNPs in the 99% credible sets are listed in Supplementary Table 13.
A
uthor Man
uscr
ipt
A
uthor Man
uscr
ipt
A
uthor Man
uscr
ipt
A
uthor Man
uscr
What do the BP variants do?
Index SNPs or their proxies (r2 > 0.8) altered amino acid sequence at 11 of 66 BP loci
(Table 1). Thus, the majority of BP-association signals are likely driven by non-coding variants hypothesized to regulate expression of some nearby gene in cis. To characterize their effects, we first sought SNPs associated with gene expression (eSNPs) from a range of available expression data which included hypertension target end organs and cells of the circulatory system (heart tissue, kidney tissue, brain tissue, aortic endothelial cells, blood
vessels) and other tissue/cell types (CD4+ macrophages, monocytes lymphoblastoid cell
lines, skin tissue, fat tissue, and liver tissue). Fourteen BP-associated SNPs at the MTHFR-NPPB, MDM4, ULK4, CYP1A1-ULK3, ADM, FURIN-FES, FIGN, and PSMD5 loci were eSNPs across different tissues (Supplementary Table 14). Of these 14 eSNPs, three were also predicted to alter the amino acid sequence at the MTHFR-NPPB, MAP4 and ULK4 loci, providing two potential mechanisms to explore in functional studies. Second, we used gene expression levels measured in whole blood in two different samples each including >5,000 individuals of EUR descent. We tested whether the lead BP SNP was associated with expression of any transcript in cis (<1Mb from the lead SNP at each locus) at a false
discovery rate (FDR) of < 0.05, accounting for all possible cis-transcript association tests genome-wide. It is likely that we did not genotype the causal genetic variant underlying each BP association signal; a nearby SNP-transcript association, due to LD, may therefore reflect an independent genetic effect on expression that is unrelated to the BP effect. Consequently, we assumed that the lead BP SNP and the most significant eSNP for a given transcript
should be highly correlated (r2 > 0.7). Furthermore, we assumed that the significance of the
transcript association with the lead BP SNP should be substantially reduced in a conditional model adjusting for the best eSNP for a given transcript. Eighteen SNPs at 15 loci were associated with 22 different transcripts, with a total of 23 independent SNP-transcript associations (three SNPs were associated with two transcripts each, Supplementary Table 15, Supplementary Note). The genes expressed in a BP SNP allele-specific manner are clearly high-priority candidates to mediate the BP association. In whole blood, these genes included obvious biological candidates such as GUCY1A3, encoding the alpha subunit of the soluble guanylate cyclase protein, and ADM, encoding adrenomedullin, both of which
are known to induce vasodilation25,26. There was some overlap of eSNPs between the whole
blood and other tissue datasets at the MTHFR-NPPB, MDM4, PSMD5, ULK4 and CYP1A1-ULK3 loci, illustrating additional potentially causal genes for further study.
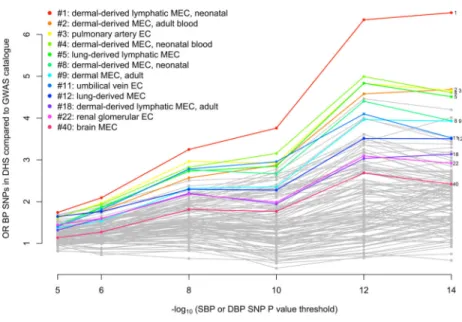
An alternative method for understanding the effect on BP of non-coding variants is to determine whether they fall within DNaseI hypersensitivity sites (DHSs). We performed two
analyses to investigate whether BP SNPs or their LD proxies (r2 > 0.8) were enriched in
DHSs in a cell-type-specific manner (Supplementary Note). First, we used Epigenomics
Roadmap and ENCODE DHS data from 123 adult cell lines or tissues27-29 to estimate the
fold increase in the proportion of BP SNPs mapping to DHSs compared to SNPs associated
at genome-wide significance with non-BP phenotypes from the NHGRI GWAS catalog30.
We observed that 7 out of the 10 cell types with the greatest relative enrichment of BP SNPs mapping to DHSs were from blood vessels (vascular or micro-vascular endothelial cell-lines or cells) and 11 of the 12 endothelial cells were among the top quarter most enriched among the 123 cell types (Figure 2 and Supplementary Table 16). In a second analysis of an
A
uthor Man
uscr
ipt
A
uthor Man
uscr
ipt
A
uthor Man
uscr
ipt
A
uthor Man
uscr
expanded set of tissues and cell lines, in which cell types were grouped into tissues (Supplementary Table 17), BP-associated SNP enrichment in DHSs in blood vessels was
again observed (P = 1.2 × 10⁻⁹), as well as in heart samples (P = 5.3 × 10⁻⁸;
Supplementary Table 18).
We next tested whether there was enrichment of BP SNPs in H3K4me331 sites, a
methylation mark associated with both promoter and enhancer DNA. We observed significant enrichment in a range of cell types including CD34 primary cells, adult kidney cells, and muscle satellite cultured cells(Supplementary Table 19). Enrichment of BP SNPs
in predicted strong and weak enhancer states and in active promoters32 in a range of cell
types was also observed (Supplementary Table 20, Supplementary Figure 8).
We used Meta-Analysis Gene-set Enrichment of variaNT Associations (MAGENTA)33 to
attempt to identify pathways over-represented in the BP association results. No gene sets meeting experiment-wide significance for enrichment for BP association were identified by MAGENTA after correction for multiple testing, although some attained nominal
significance (Supplementary Table 21, Supplementary Note). We also adapted the
DEPICT34 pathway analysis tool (Data-driven Expression Prioritized Integration for
Complex Traits) to identify assembled gene-sets that are enriched for genes near associated variants, and to assess whether genes from associated loci were highly expressed in particular tissues or cell types. Using the extended BP locus list based on genome-wide significant loci from this analysis and previously published SNPs that may not have reached genome-wide significance in the current analysis (Supplementary Table 9), we identified five significant (FDR ≤ 5%) gene sets: abnormal cardiovascular system physiology, G Alpha 1213 signaling events, embryonic growth retardation, prolonged QT interval, and abnormal vitelline vasculature morphology. We also found that suggestive SBP and DBP associations
(P < 1 × 10⁻⁵) were enriched for reconstituted gene-sets at DBP loci (mainly related to
developmental pathways), but not at SBP loci (Supplementary Table 22, Supplementary Note). In a final analysis, we assessed Cardio-MetaboChip SNPs at the fine-mapping loci using formaldehyde-assisted isolation of regulatory elements (FAIRE-gen) in
lymphoblastoid cell lines35. Our results provided support for two SNPs, one of which SNP
(rs7961796 at the TBX5-TBX3 locus) was located in a regulatory site. Although the other SNP (rs3184504 at the SH2B3 locus) is a non-synonymous variant, there was also a
regulatory site indicated by DNaseI and H3K4me1 signatures at the locus, making the SNP a
potential regulatory variant (Supplementary Table 23)36. Both SNPs were included in the
list of 99% credible SNPs at each locus.
Asian- and African ancestry BP SNP association
We tested the 66 lead SNPs at the established and novel loci for association with BP in up to 20,875 individuals of South Asian (SAS) ancestry (PROMIS and RACE studies), 9,637 individuals of East Asian (EAS) ancestry (HEXA, HALST, CLHNS, DRAGON, and TUDR studies), and 33,909 individuals of African (AFR) ancestry (COGENT-BP consortium, Jupiter, SPT, Seychelles, GXE, and TANDEM studies). As expected, the effect allele frequencies are very similar across studies of the same ethnicity, but markedly different across different ancestry groups (Supplementary Figure 9). Many associations of
A
uthor Man
uscr
ipt
A
uthor Man
uscr
ipt
A
uthor Man
uscr
ipt
A
uthor Man
uscr
individual SNPs failed to reach P < 0.05 for the BP trait with the lower P value
(Supplementary Table 24), which could potentially be due to the much lower statistical power at the sample sizes available, different patterns of LD at each locus across ancestries, variability in allele frequency, or true lack of association in individuals of a given non-European ancestry. The low statistical power for the great majority of SNPs tested is visible considering SNP-by-SNP power calculations using European ancestry effect sizes
(Supplementary Table 24). However, concordant directions of allelic effects for both SBP and DBP were observed for 45/66 SNPs in SAS, 36/60 SNPs in EAS, and 42/66 SNPs in AFR samples: the strongest concordance with SAS may not be surprising because South Asians are more closely related to Europeans than are East Asians or Africans. Moreover, strong correlation of effect sizes was observed between EUR samples with SAS, EAS, or AFR samples (r = 0.55, 0.60, and 0.48, respectively). A 66-SNP SBP or DBP risk score were significant predictors of SBP and DBP in all samples. A 1 mm Hg higher SBP or DBP risk score in EUR samples was associated with a 0.58/0.50 mm Hg higher SBP/DBP in SAS
samples (SBP P = 1.5 × 10⁻¹⁹, DBP P = 3.2 × 10⁻¹⁵), 0.49/0.50 mm Hg higher SBP/DBP in
EAS samples (SBP P = 1.9 × 10⁻¹⁰, DBP P = 1.3 × 10⁻⁷), and 0.51/0.47 mm Hg higher
SBP/DBP in AFR samples (SBP P = 2.2 × 10⁻²¹, DBP P = 6.5 × 10⁻¹⁹). The attenuation of
the genetic risk score estimates in non-European ancestries is presumably due to inclusion of a subset of variants that lack association in the non-European or admixed samples.
We subsequently performed a trans-ethnic meta-analysis of the 66 SNPs in all 64,421 samples across the three non-European ancestries. After correcting for 66 tests, 12/66 SNPs
were significantly associated with either SBP or DBP (P < 7.6 × 10⁻⁴), with a correlation of
EUR and non-EUR effect estimates of 0.77 for SBP and 0.67 for DBP; the European-ancestry SBP or DBP risk score was associated with 0.53/0.48 mm Hg higher BP per
predicted mm Hg SBP/DBP respectively (SBP P < 6.6 × 10−48, DBP P < 1.3 × 10−38). For 7
of the 12 significant SNPs, no association has previously been reported in genome-wide studies of non-European ancestry. Some heterogeneity of effects was observed between European and non-European effect estimates (Supplementary Table 24). Taken together, these findings suggest that, in aggregate, BP loci identified using data from individuals of EUR ancestry are also predictive of BP in non-EUR samples, but larger non-European sample sizes will be needed to establish precisely which individual SNPs are associated in a given ethnic group.
Impact on hypertensive target organ damage
Long-term elevated BP causes target organ damage, especially in the heart, kidney, brain,
large blood vessels, and the retinal vessels37. Consequently, the genetic effect of the 66 SBP
and DBP SNPs on end-organ outcomes can be directly tested using the risk score, although some outcomes lacked results for a small number of SNPs. Interestingly, BP risk scores significantly predicted (Supplementary Note) coronary artery disease risk, left ventricular mass and wall thickness, stroke, urinary albumin/creatinine ratio, carotid intima-medial thickness and central retinal artery caliber, but not heart failure or other kidney phenotypes, after accounting for the number of outcomes examined (Table 3). Because outlier effects can affect risk scores, we repeated the risk score analysis removing iteratively SNPs that
contributed to statistical heterogeneity (SNP-trait effects relative to SNP-BP effects).
A
uthor Man
uscr
ipt
A
uthor Man
uscr
ipt
A
uthor Man
uscr
ipt
A
uthor Man
uscr
Heterogeneity was defined based on a multiple testing adjusted significance threshold for Cochran's Q test of homogeneity of effects (Supplementary Note). The risk score analyses restricted to the subset of SNPs showing no heterogeneity of effect revealed essentially identical results, with the exception that urinary albumin/creatinine ratio was no longer significant. The per-SNP results are provided in Supplementary Table 25 and
Supplementary Figures 10. Because large-scale GWAS of non-BP cardiovascular risk factors are available, we examined the BP risk scores as predictors of other cardiovascular risk factors: LDL-cholesterol, HDL-cholesterol, triglycerides, type 2 diabetes, BMI, and height. We observed nominal (P <0.05) associations of the BP risk scores with risk factors, although mostly in the opposite direction to the risk factor-CVD association
(Supplementary Table 26). The failure to demonstrate an effect of BP risk scores on heart failure may reflect limited power from a modest sample size, but the lack of significant effects on renal measures suggests that the epidemiologic relationship of higher BP and worse renal function may not reflect direct consequences of BP elevation.
DISCUSSION
The study reported here is the largest to date to investigate the genomics of BP in multiple continental ancestries. Our results highlight four major features of inter-individual variation in BP: (1) we identified 66 (17 novel) genome-wide significant loci for SBP and DBP by targeted genotyping in up to 342,415 individuals of European ancestry that cumulatively explain ~3.5% of the trait; (2) the variants were enriched for cis-regulatory elements, particularly in vascular endothelial cells; (3) the variants had broadly comparable BP effects in South Asians, East Asian and Africans, albeit in smaller sample sizes; and, (4) a 66 SNP risk-score predicted target organ damage in the heart, cerebral vessels, carotid artery and the eye with little evidence for an effect in kidneys. Overall, there was no enrichment of a single genetic pathway in our data; rather, our results are consistent with the effects of BP arising from multiple tissues and organs.
Genetic and molecular analyses of Mendelian syndromes of hypertension and hypotension point largely to a renal origin, involving multiple rare deleterious mutations in proteins that
regulate salt-water balance38. This is strong support for Guyton's hypothesis that the
regulation of sodium excretion by the kidney and its effects on extracellular volume are a
prime pathway determining intra-arterial pressure39. However, our genetic data from
unselected individuals in the general community argues against a single dominant renal effect. The 66 SNPs we identified are not chance effects, but have a global distribution and impact on BP that are consistent as measured by their effects across the many studies meta-analyzed. That they are polymorphic across all continental ancestries argues for their origin and functional effects prior to human continental differentiation.
However several of the 17 novel loci contain strong positional biological candidates, these are described in greater detail in Supplementary Table 27 and the Supplementary Note. The single most common feature we identified was the enrichment of regulatory elements for gene expression in vascular endothelial cells. The broad distribution of these cells across both large and small vessels and across all tissues and organs suggest that functional variation in these cells affects endothelial permeability or vascular smooth muscle cell
A
uthor Man
uscr
ipt
A
uthor Man
uscr
ipt
A
uthor Man
uscr
ipt
A
uthor Man
uscr
contractility via multiple pathways. These hypotheses will need to be rigorously tested in appropriate models, to assess the contribution of these pathways to BP control, and these pathways could also be targets for systemic anti-hypertensive therapy as they are for the
pulmonary circulation42.
In summary, these genetic observations may contribute to an improved understanding of BP biology and a re-evaluation of the pathways considered relevant for therapeutic BP control.
ONLINE METHODS
Cohorts contributing to systolic (SBP) and diastolic blood pressure (DBP) analyses
Studies contributing to BP association discovery including community- and population-based collections as well as studies of non-BP traits, analyzed as case and control samples separately. Details on each of the studies including study design and BP measurement are provided in Supplementary Table 1, genotyping information in Supplementary Table 2, and participant characteristics in Supplementary Table 3. All participants provided written informed consent and the studies were approved by local Research Ethics Committees and/or Institutional Review Boards.
European ancestry meta-analysis
BP was measured using standardized protocols in all studies regardless of whether the primary focus was BP or another trait. We initially analyzed affected and unaffected individuals from samples selected as cases (e.g. type 2 diabetes) or controls, separately. However, because sensitivity analyses did not reveal any significant difference in BP effect size estimates between case and control samples (data not shown), we analyzed all samples combined. When available, the average of two BP measurements was used for association analyses (Supplementary Table 1). If an individual was taking a BP-lowering treatment, the underlying systolic BP (SBP) and diastolic BP (DBP) were estimated by adding 15 mmHg and 10 mmHg, respectively, to the measured values, as done in prior analyses.
A meta-analysis of 340,934 individuals of European descent was undertaken in four stages with subsequent validation in an independent cohort. Because stage 1 Cardio-MetaboChip samples included many SNPs selected on the basis of association with BP in earlier GWAS, we performed genomic control using a set of putative null SNPs based on P > 0.10 in earlier GWAS of SBP and DBP or both. Stage 2 samples with genome-wide genotyping used the entire genome-wide set of SNPs for genomic control given the lack of ascertainment. The study design is summarized in Supplementary Figure 1, and further details are provided in Supplementary Tables 2-5 and the Supplementary Note.
Systematic PubMed search +/− 100kb of each newly discovered index SNP
All genes with any overlap with a 200kb region centered around each of the 17 newly discovered lead SNPs were identified using the UCSC Genome Browser. A search term was constructed for each gene including the short and long gene name and the terms “blood pressure” and “hypertension” (e.g. for NPPA on chr 1: “NPPA OR natriuretic peptide A
A
uthor Man
uscr
ipt
A
uthor Man
uscr
ipt
A
uthor Man
uscr
ipt
A
uthor Man
uscr
AND (blood pressure OR hypertension)”) and the search results of each search term from PubMed were individually reviewed.
Trait variance explained
The trait variance explained by 66 lead SNPs at novel and known loci was evaluated in one study that contributed to the discovery effort: the Atherosclerosis Risk in Communities (ARIC) study. We constructed a linear regression model with all 66 or the subset of 49 known SNPs as a set of predictors of the BP residual after adjustment for covariates of the
adjusted treatment-corrected BP phenotype (SBP or DBP). The r2 from the regression model
was used as the estimate of trait variance explained.
European ancestry GCTA-COJO analysis
To identify multiple distinct association signals at any given BP locus, we undertook approximate conditional analyses using a model selection procedure implemented in the
GCTA-COJO software package44,45. To evaluate the robustness of the GCTA-COJO results
to the choice of reference data set, model selection was performed using the LD between variants in separate analyses from two datasets of European descent, both with individuals from the UK with Cardio-MetaboChip genotype data: GoDARTS with 7,006 individuals and WTCCC1-T2D/58BC with 2,947 individuals. Assuming that the LD between SNPs more than 10 Mb away or on different chromosomes is zero, we undertook the GCTA-COJO step wise model selection to select SNPs that were conditionally-independently associated with
SBP and DBP, in turn, at a genome-wide significance, given by P < 5×10⁻⁸
(Supplementary Tables 6-8) using the stage 4 combined European GWAS+ Cardio-MetaboChip meta-analysis.
Conditional analyses in the Women's Genome Health Study (WGHS)
Multivariable regression modeling was performed for each possible combination of putative independent SNPs from a) model selection implemented in GCTA-COJO and b) a
comprehensive manual review of the literature (Supplementary Table 9). Any SNP with P
< 5×10⁻⁸ in a previous reported BP GWAS was considered. A total of 46 SNPs were
examined (Supplementary Table 10). Genome-wide genotyping data imputed to 1000 Genomes in the WGHS (N = 23,047) were used. Regression modeling was performed in the R statistical language (Supplementary Table 10).
Fine mapping and determination of credible sets of causal SNPs
The GCTA-COJO and WGHS conditional analyses identified multiple distinct signals of association at multiple loci (Supplementary Tables 6 and 10). Of the 24 loci considered in fine-mapping analyses, 16 had no evidence for the existence of multiple distinct association signals, so it is reasonable to assume that there is a single causal SNP and therefore the credible sets of variants could be constructed using the association summary statistics from the unconditional meta-analyses. However, in the remaining eight loci, where evidence of secondary signals was observed from GCTA-COJO, we performed approximate conditional analyses across the region by conditioning on each index SNP (Supplementary Table 11). By adjusting for the other index SNPs at the locus, we can therefore assume a single variant
A
uthor Man
uscr
ipt
A
uthor Man
uscr
ipt
A
uthor Man
uscr
ipt
A
uthor Man
uscr
is driving each “conditionally-independent” association signal, and we can construct the 99% credible set of variants on the basis of the approximate conditional analysis from GCTA-COJO (Supplementary Tables 12-13). At five of the eight loci with multiple distinct signals of association, one index SNP mapped outside of the fine-mapping region, so a credible set could not be constructed.
eQTL analysis: Whole Blood
NESDA/NTR: Whole blood eQTL analyses were performed in samples from the
Netherlands Study of Depression and Anxiety (NESDA)46 and the Netherlands Twin
Registry (NTR)47 studies. RNA expression analysis was performed in the statistical software
R. The residuals resulting from the linear regression analysis of the probe set intensity
values onto the covariates sex, age, body mass index (kg/m2), smoking status coded as a
categorical covariate, several technical covariates, and three principal components were used. The eQTL effects were detected using a linear mixed model approach, including for each probe set the expression level (normalized, residualized and without the first 50 expression PCs) as dependent variable; the SNP genotype values as fixed effects; and family identifier and zygosity (in the case of twins) as random effects to account for family and
twin relations48.
The eQTL effects were defined as cis when probe set–SNP pairs were at distance < 1M base pairs. At a FDR of 0.01 applied genome-wide, not just for candidate SNPs, the P value
threshold was 1×10⁻⁴ for the cis-eQTL analysis. For each probe set that displayed a
statistically significant association with at least one SNP located within its cis region, we identified the most significantly associated SNP and denoted this as the top cis-eQTL SNP. See Supplementary Note for details.
eQTL analysis: Selected published eQTL datasets
Lead BP SNP and proxies (r2 > 0.8) were searched against a collected database of
expression SNP (eSNP) results. The reported eSNP results met criteria for statistical thresholds for association with gene transcript levels as described in the original papers. The
non-blood cell tissue eQTLs searched included aortic endothelial cells49, left ventricle of the
heart 50, cd14+ monocytes 51 and the brain 52. The results are presented in Supplementary
Tables 14-15.
Enrichment analyses: Analysis of cell-specific DNase hypersensitivity sites (DHSs) using an OR method
The overlap of Cardio-MetaboChip SNPs with DHSs was examined using publicly available data from the Epigenomics Roadmap Project and ENCODE, choosing different cutoffs of Cardio-MetaboChip P values. The DHS mappings were available for 123 mostly adult cells
and tissues 53 (downloaded from The DHS mappings were specified as both “narrow” and
“broad” peaks, referring to reduction of the experimental data to peak calls at 0.1% and 1.0% FDR thresholds, respectively. Thus, the “narrow” peaks are largely nested within the “broad” peaks. Experimental replicates of the DHS mappings (typically duplicates) were also available for the majority of cells and tissues.
A
uthor Man
uscr
ipt
A
uthor Man
uscr
ipt
A
uthor Man
uscr
ipt
A
uthor Man
uscr
SNPs from the Cardio-MetaboChip genome-wide scan were first clumped in PLINK in
windows of 100kb and maximum r2 = 0.1 among LD relationships from the 1000 Genomes
European data. Then, the resulting index SNPs at each P value threshold were tagged with r2
= 0.8 in windows of 100kb, again using LD relationships in the 1000 Genomes, restricted to SNPs with MAF > 1% and also present in the HapMap2 CEU population. A reference set of SNPs was constructed using the same clumping and tagging procedures applied to GWAS
catalog SNPs (available at http://www.genome.gov/gwastudies/, accessed 3/13/2013)54 with
discovery P < 5×10⁻⁸ in European populations. A small number of reference SNPs or their
proxies overlapping the BP SNPs or their proxies were excluded. After LD pruning and exclusions, there were a total of 1,196 reference SNPs. For each cell type and P value threshold, the enrichment of SBP or DBP SNPs (or their LD proxies) mapping to DHSs was expressed as an odds ratio (OR) relative to the GWAS catalog reference SNPs (or their LD proxies), using logistic mixed effect models treating the replicate peak determinations as random effects (glmer package in R). The significance of the enrichment ORs was derived from the significance of beta coefficients for the main effects in the mixed models (Figure 2, Supplementary Table 16).
Enrichment analyses: Analysis of tissue-specific enrichment of BP variants and H3K4me3 sites
An analysis to test for significant cell-specific enrichment in the overlap of BP SNPs (or
their proxies) with H3K4me3 sites was performed as described in Trynka et al, 201355. The
measure of overlap is a “score” that is constructed by dividing the height of an H3K4me3 ChIP signal in a particular cell by the distance between the nearest test SNP. The
significance of the scores (i.e. P value) for all SNPs was determined by a permutation approach that compares the observed scores to scores of SNPs with similar properties to the test SNPs, essentially in terms of LD and proximity to genes (Supplementary Note). The number of permutations determined the number of significant digits in the P values and we conducted 10,000 iterations. Results are shown in Supplementary Table 19.
Enrichment analyses: Analysis of tissue-specific DHSs and chromatin states using GREGOR
The DNase-seq ENCODE data for all available cell types were downloaded in the processed “narrowPeak” format. The local maxima of the tag density in broad, variable-sized “hotspot” regions of chromatin accessibility were thresholded at FDR 1% with peaks set to a fixed width of 150bp. Individual cell types were further grouped into 41 broad tissue categories by taking the union of DHSs for all related cell types and replicates. For each GWAS locus, a set of matched control SNPs was selected based on three criteria: 1) number of variants in
LD (r2 > 0.7; ± 8 variants), 2) MAF (± 1%), and 3) distance to nearest gene (± 11,655 bp).
To calculate the distance to the nearest gene, the distance to the 5’ flanking gene (start and end position) and to the 3’ flanking gene was calculated and the minimum of these 4 values was used. If the SNP fell within the transcribed region of a gene, the distance was 0. The probability that a set of GWAS loci overlap with a regulatory feature more often than we expect by chance was estimated.
A
uthor Man
uscr
ipt
A
uthor Man
uscr
ipt
A
uthor Man
uscr
ipt
A
uthor Man
uscr
Enrichment analyses: FAIRE analysis of BP variants in fine-mapping regions in lymphoblastoid cell lines
FAIRE analysis was performed on a sample of 20 lymphoblastoid cell lines of European origin. All samples were genotyped using the Cardio-MetaboChip genotyping array, and BP
SNPs and LD proxies (r2 > 0.8) at the fine mapping loci (N = 24, see Supplementary Table
23) were assessed to identify heterozygous imbalance between non-treated and FAIRE-treated chromatin. A paired t-test was used to compare the B allele frequency (BAF) arising from formaldehyde-fixed chromatin sheared by sonication and DNA purified to the BAF when the same chromatin sample underwent FAIRE to enrich for open chromatin. Three hundred and fifty-seven Cardio-MetaboChip BP SNPs were directly genotyped across the fine mapping regions. The Bonferroni-corrected threshold of significance is P < 0.0001 (0.05/357). The results for SNPs with P < 0.05 are reported in (Supplementary Table 23). FAIRE results were not available for some SNPs with missing data due to genotype failure or not having >3 heterozygous individuals for statistical analysis. Therefore there are no results for three lower frequency BP loci (SLC39A8, CYP17A1-NT5C2 and GNAS-EDN3) and for the second signal at the following loci: MTHFR-NPPB (rs2272803), MECOM (rs2242338) and HFE rs1800562).
Pathway analyses: MAGENTA
MAGENTA tests for enrichment of gene sets from a precompiled library derived from GO, KEGG, PATHTER, REACTOME, INGENUITY, and BIOCARTA was performed as
described by Segré et al, 201056. Enrichment of significant gene-wide P values in gene sets
is assessed by 1) using LD and distance criteria to define the span of each gene, 2) selecting the smallest P value among SNPs mapping to the gene span, and 3) adjusting this P value using a regression method that accounts for the number of SNPs, the LD, etc. In the second step, MAGENTA examines the distribution of these adjusted P values and defines thresholds for the 75%ile and the 95%ile. In the third step, MAGENTA calculates an enrichment for each gene set by comparing the number of genes in the gene set with P value less than either the 75th or 95th %ile to the number of genes in the gene set with P value greater than either the 75th or 95th %ile, and then comparing this quotient to the same quotient among genes not in the gene set. This gene-set quotient is assigned a P value based on reference to a hypergeometric distribution. The results based on our analyses are indicated in Supplementary Table 21.
Pathway analyses: DEPICT
We applied the DEPICT 57 analysis separately on genome-wide significant loci from the
overall blood pressure (BP) Cardio-MetaboChip analysis including published blood pressure loci (see Supplementary Table 22). SNPs at the HFE and BAT2-BAT5 loci (rs1799945, rs1800562, rs2187668, rs805303, rs9268977) could not be mapped. As a secondary analysis,
we additionally included associated loci (P < 1×10⁻⁵) from the Cardio-MetaboChip stage 4
combined meta-analyses of SBP and the DBP. DEPICT assigned genes to associated regions
if they overlapped or resided within associated LD blocks with r2 > 0.5 to a given associated
SNP.
A
uthor Man
uscr
ipt
A
uthor Man
uscr
ipt
A
uthor Man
uscr
ipt
A
uthor Man
uscr
Literature review for genes at the newly discovered loci
Recognizing that the most significantly associated SNP at a locus may not be located in the causal gene and that the functional consequences of a SNP often extends beyond 100kb, we conducted a literature review of genes in extended regions around newly discovered BP index SNPs. The genes for this extensive review were identified by DEPICT
(Supplementary Table 22).
Non-European meta-analysis
To assess the association of the 66 significant loci from the European ancestry meta-analysis in non-European ethnicities, we obtained lookup results for the 66 index SNPs for
participants of South-Asian ancestry (8 datasets, total N = 20,875), East-Asian ancestry (5 datasets, total N = 9,637), and African- and African-American ancestry (6 datasets, total N =
33,909). The association analyses were all conducted with the same covariates (age, age2,
sex, BMI) and treatment correction (+15/10 mm Hg in the presence of any hypertensive medication) as the association analyses for the discovery effort in Europeans. Tests for heterogeneity across effect estimates in European, South Asian, East Asian and African
derived samples were performed using GWAMA58.
Genetic risk score and cardiovascular outcomes
The gtx package for the R statistical programming language was used to estimate the effect
of the SNP-risk score on the response variable in a regression model59.
Supplementary Material
Refer to Web version on PubMed Central for supplementary material.
Authors
Georg B. Ehret#1,2, Teresa Ferreira#3, Daniel I. Chasman4,5, Anne U. Jackson6,7, Ellen M. Schmidt8, Toby Johnson9,10, Gudmar Thorleifsson11, Jian'an Luan12, Lousie A. Donnelly13, Stavroula Kanoni14, Ann-Kristin Petersen15, Vasyl Pihur1, Rona J. Strawbridge16,17, Dmitry Shungin18,19,20, Maria F. Hughes21, Osorio Meirelles22, Marika Kaakinen23, Nabila Bouatia-Naji24,25, Kati Kristiansson26,27, Sonia Shah28, Marcus E. Kleber29, Xiuqing Guo30, Leo-Pekka Lyytikäinen31,32, Cristiano Fava33,34, Niclas Eriksson35, Ilja M. Nolte36, Patrik K. Magnusson37, Elias L. Salfati38, Loukianos S. Rallidis39, Elizabeth Theusch40, Andrew J.P. Smith41, Lasse Folkersen16, Kate Witkowska9,42, Tune H. Pers43,44,45,46,47, Roby Joehanes48, Stuart K. Kim49, Lazaros Lataniotis14, Rick Jansen50, Andrew D. Johnson48,51, Helen Warren9,42, Young Jin Kim52, Wei Zhao53, Ying Wu54, Bamidele O. Tayo55, Murielle Bochud56, CHARGE-EchoGen consortium57, CHARGE-HF consortium57, Wellcome Trust Case Control Consortium57, Devin Absher58, Linda S. Adair59, Najaf Amin60, Dan E. Arking1, Tomas Axelsson61, Damiano Baldassarre62,63, Beverley Balkau64, Stefania Bandinelli65, Michael R. Barnes14,42, Inês Barroso66,67,68, Stephen Bevan69, Joshua C. Bis70, Gyda
Bjornsdottir11, Michael Boehnke6,7, Eric Boerwinkle71, Lori L. Bonnycastle72, Dorret
A
uthor Man
uscr
ipt
A
uthor Man
uscr
ipt
A
uthor Man
uscr
ipt
A
uthor Man
uscr
I. Boomsma73, Stefan R. Bornstein74, Morris J. Brown75, Michel Burnier76, Claudia P. Cabrera9,42, John C. Chambers77,78,79, I-Shou Chang80, Ching-Yu Cheng81,82,83, Peter S. Chines72, Ren-Hua Chung84, Francis S. Collins72, John M. Connell85, Angela Döring86,87, Jean Dallongeville88, John Danesh89,66,90, Ulf de Faire91, Graciela Delgado29, Anna F. Dominiczak92, Alex S.F. Doney13, Fotios Drenos41, Sarah Edkins66, John D. Eicher48,51, Roberto Elosua93, Stefan Enroth94,95, Jeanette Erdmann96,97, Per Eriksson16, Tonu Esko98,99,100, Evangelos
Evangelou77,101, Alun Evans21, Tove Fall102, Martin Farrall3,103, Janine F. Felix104, Jean Ferrières105, Luigi Ferrucci106, Myriam Fornage107, Terrence Forrester108, Nora Franceschini109, Oscar H. Franco Duran104, Anders Franco-Cereceda101, Ross M. Fraser111,112, Santhi K. Ganesh113, He Gao77, Karl Gertow16,17,
Francesco Gianfagna114,115, Bruna Gigante91, Franco Giulianini4, Anuj Goel3,103, Alison H. Goodall116,117, Mark O. Goodarzi118, Mathias Gorski119,120, Jürgen Gräßler121, Christopher Groves122, Vilmundur Gudnason123,124, Ulf Gyllensten94,95, Göran Hallmans18, Anna-Liisa Hartikainen125,126, Maija Hassinen127, Aki S.
Havulinna26, Caroline Hayward128, Serge Hercberg129, Karl-Heinz Herzig130,131,132, Andrew A. Hicks133, Aroon D. Hingorani28, Joel N. Hirschhorn43,44,45,134, Albert Hofman104,135, Jostein Holmen136, Oddgeir Lingaas Holmen136,137, Jouke-Jan Hottenga73, Phil Howard41, Chao A. Hsiung84, Steven C. Hunt138,139, M. Arfan Ikram104,140,141, Thomas Illig142,143,144, Carlos Iribarren145, Richard A.
Jensen71,146, Mika Kähönen147, Hyun Kang6,7, Sekar Kathiresan148,149,150,45,151, Brendan J. Keating152,153, Kay-Tee Khaw154, Yun Kyoung Kim52, Eric Kim155, Mika Kivimaki28, Norman Klopp142,143, Genovefa Kolovou156, Pirjo Komulainen127, Jaspal S. Kooner157,78,79, Gulum Kosova149,148,100, Ronald M. Krauss158, Diana Kuh159, Zoltan Kutalik160,161, Johanna Kuusisto162, Kirsti Kvaløy136, Timo A Lakka163,127,164, Nanette R. Lee165,166, I-Te Lee167,168, Wen-Jane Lee169, Daniel Levy48,170, Xiaohui Li30, Kae-Woei Liang171,172, Honghuang Lin173,48, Li Lin2, Jaana Lindström26, Stéphane Lobbens174,175,176, Satu Männistö26, Gabriele Müller177, Martina Müller-Nurasyid15,178,179, François Mach2, Hugh S. Markus180, Eirini Marouli14,181, Mark I. McCarthy122, Colin A. McKenzie108, Pierre Meneton182, Cristina Menni183, Andres Metspalu98, Vladan Mijatovic184, Leena Moilanen185,186, May E. Montasser187, Andrew D. Morris13, Alanna C. Morrison188, Antonella Mulas189, Ramaiah Nagaraja22, Narisu Narisu72, Kjell Nikus190,191, Christopher J. O'Donnell192,48,151, Paul F. O'Reilly193, Ken K. Ong12, Fred Paccaud56, Cameron D. Palmer194,195,45, Afshin Parsa187, Nancy L. Pedersen37, Brenda W.
Penninx196,197,198, Markus Perola26,27,98, Annette Peters87, Neil Poulter199, Peter P. Pramstaller133,200,201, Bruce M. Psaty70,202,203,204, Thomas Quertermous38, Dabeeru C. Rao205, Asif Rasheed206, N William N.W.R. Rayner122,3,66, Frida Renström19,207,18, Rainer Rettig208, Kenneth M. Rice209, Robert Roberts210,211, Lynda M. Rose4, Jacques Rossouw212, Nilesh J. Samani116,213, Serena Sanna189, Jouko Saramies214, Heribert Schunkert215,216,217,218, Sylvain Sebert219,131,164, Wayne H.-H. Sheu167,168,220, Young-Ah Shin52, Xueling Sim6,7,221, Johannes H. Smit196, Albert V. Smith123,124, Maria X. Sosa1, Tim D. Spector183, Alena Stančáková222, Alice Stanton223, Kathleen E. Stirrups14,224, Heather M. Stringham6,7, Johan Sundstrom61, Amy J. Swift72, Ann-Christine Syvänen61,
E-A
uthor Man
uscr
ipt
A
uthor Man
uscr
ipt
A
uthor Man
uscr
ipt
A
uthor Man
uscr
Shyong Tai225,82,221, Toshiko Tanaka106, Kirill V. Tarasov226, Alexander Teumer227, Unnur Thorsteinsdottir11,124, Martin D. Tobin228, Elena Tremoli62,63, Andre G. Uitterlinden104,229, Matti Uusitupa230,231, Ahmad Vaez36,232, Dhananjay Vaidya233, Cornelia M. van Duijn104,234, Erik P.A. van Iperen235,236, Ramachandran S.
Vasan48,237,238, Germaine C. Verwoert104, Jarmo Virtamo26, Veronique Vitart128, Benjamin F. Voight45,239, Peter Vollenweider240, Aline Wagner241, Louise V. Wain228, Nicholas J. Wareham12, Hugh Watkins3,103, Alan B. Weder242, Harm-Jan Westra243, Rainford Wilks244, Tom Wilsgaard245,246, James F. Wilson111,128, Tien Y. Wong81,82,83, Tsun-Po Yang14,247, Jie Yao30, Loic Yengo174,175,176, Weihua
Zhang77,78, Jing Hua Zhao12, Xiaofeng Zhu248, Pascal Bovet249,56, Richard S. Cooper55, Karen L. Mohlke54, Danish Saleheen250,206, Jong-Young Lee52, Paul Elliott77,251, Hinco J. Gierman49,252, Cristen J. Willer8,253,254, Lude Franke255, G Kees Hovingh256, Kent D. Taylor30, George Dedoussis181, Peter Sever199, Andrew Wong159, Lars Lind61, Themistocles L. Assimes38, Inger Njølstad245,246, Peter EH. Schwarz74, Claudia Langenberg12, Harold Snieder36, Mark J. Caulfield9,42, Olle Melander33, Markku Laakso162, Juha Saltevo257, Rainer Rauramaa127,164, Jaakko Tuomilehto26,258,259,260, Erik Ingelsson102,3, Terho Lehtimäki31,32, Kristian
Hveem136, Walter Palmas261, Winfried März262,263, Meena Kumari28, Veikko Salomaa26, Yii-Der I. Chen30, Jerome I. Rotter30, Philippe Froguel174,175,176,23, Marjo-Riitta Jarvelin219,131,264,251, Edward G. Lakatta226, Kari Kuulasmaa26, Paul W. Franks19,207,18, Anders Hamsten16,17, H.-Erich Wichmann86,179,265, Colin N.A. Palmer13, Kari Stefansson11,124, Paul M Ridker4,5, Ruth J.F. Loos12,266,267, Aravinda Chakravarti1, Panos Deloukas14,268, Andrew P. Morris269,3,#, Christopher Newton-Cheh148,149,45,100,#, and Patricia B. Munroe9,42,#
Affiliations
1 Center for Complex Disease Genomics, McKusick-Nathans Institute of Genetic
Medicine, Johns Hopkins University School of Medicine, Baltimore, MD 21205, USA 2 Cardiology, Department of Medicine, Geneva University Hospital, Rue
Gabrielle-Perret-Gentil 4, 1211 Geneva 14, Switzerland 3 Wellcome Trust Centre for Human Genetics, University of Oxford, Oxford, OX3 7BN, UK 4 Division of Preventive Medicine, Brigham and Women's Hospital, 900 Commonwealth Ave. East, Boston, MA 02215, USA 5 Harvard Medical School, Boston, MA 02115, USA 6 Department of Biostatistics, University of Michigan, Ann Arbor, MI 48109, USA 7 Center for Statistical Genetics, University of Michigan, Ann Arbor, MI 48109, USA 8
Department of Computational Medicine and Bioinformatics, University of Michigan, Ann Arbor, MI 48109, USA 9 Clinical Pharmacology, William Harvey Research Institute, Queen Mary University of London, London, EC1M 6BQ, UK 10 GlaxoSmithKline, Gunnels Wood Road, Stevenage SG1 2NY, UK 11 deCODE Genetics/Amgen, Inc., Reykjavik, Iceland 12 MRC Epidemiology Unit, University of Cambridge School of Clinical Medicine, Institute of Metabolic Science, Cambridge Biomedical Campus, Cambridge, CB2 0QQ, UK 13 Medical Research Institute, University of Dundee, Ninewells Hospital and Medical School, Dundee, DD1 9SY, UK 14 William Harvey Research Institute, Barts and The London School of Medicine and Dentistry, Queen Mary University of London, London, UK 15 Institute of Genetic
A
uthor Man
uscr
ipt
A
uthor Man
uscr
ipt
A
uthor Man
uscr
ipt
A
uthor Man
uscr
Epidemiology, Helmholtz Zentrum München, Neuherberg 85764, Germany 16 Cardiovascular Research Unit, Center for Molecular Medicine L8:03, Department of Medicine, Karolinska Institutet, 171 76 Stockholm, Sweden 17 Center for Molecular Medicine, Karolinska University Hospital Solna, Stockholm, Sweden 18 Department of Public Health and Clinical Medicine, Umeå University, Sweden 19 Department of Clinical Sciences, Genetic and Molecular Epidemiology Unit, Skåne University Hospital Malmö, SE-205 02 Malmö, Sweden 20 Department of Odontology, Umeå University, Sweden 21 Centre of Excellence for Public Health, Queens University Belfast, Grosvenor Road, Belfast BT126JP, UK 22 Laboratory of Genetics, Intramural Research Program, National Institute on Aging, National Institutes of Health,
Baltimore, Maryland 21224, USA 23 Department of Genomics of Common Disease, School of Public Health, Imperial College London, Hammersmith Hospital, London, UK 24 INSERM UMR970, Paris Cardiovascular Research Center PARCC, 56 rue Leblanc, 75015 Paris, France 25 University Paris-Descartes, Sorbonne Paris Cité, 12 rue de l'Ecole de medicine, F-75006 Paris, France 26 National Institute for Health and Welfare, FI-00271 Helsinki, Finland 27 Institute for Molecular Medicine Finland FIMM, University of Helsinki, 00290 Helsinki, Finland 28 Genetic Epidemiology Group, Dept. Epidemiology and Public Health, UCL, London, WC1E 6BT, UK 29 Vth Department of Medicine, Medical Faculty Mannheim, Heidelberg University,
Theodor-Kutzer-Ufer 1-3, 68167 Mannheim, Germany 30 Institute for Translational Genomics and Population Sciences, Los Angeles Biomedical Research Institute at Harbor-UCLA Medical Center, 1124 W. Carson Street, Torrance, CA 90502, USA 31 Department of Clinical Chemistry, Fimlab Laboratories, Tampere 33520, Finland 32 Department of Clinical Chemistry, University of Tampere School of Medicine, Tampere 33014, Finland 33 University of Lund, Dept Internal Medicine, Malmo, SE 20502, Sweden 34 University of Verona, Dept of Internal Medicine, Verona, Italy 37134 35 Uppsala University, Uppsala Clinical Research Center, SE-75185 Uppsala, Sweden 36 Department of Epidemiology, University of Groningen, University Medical Center Groningen, Hanzeplein 1, 9713 GZ Groningen, The Netherlands 37 Dept of Medical Epidemiology and Biostatistics, Karolinska Institutet, Box 281, SE-171 77 Stockholm, Sweden 38 Department of Medicine, Stanford University School of Medicine, Stanford, CA 94305, USA 39 Second Department of Cardiology, Attikon Hospital, School of Medicine, University of Athens, Athens, Greece 40 Children's Hospital Oakland Research Institute, Oakland, CA 94609, USA 41 Department of Cardiovascular Genetics, Institute of Cardiovascular Sciences, University College London, London WC1E 6JF, UK 42 NIHR Barts Cardiovascular Biomedical Research Unit, Queen Mary University of London, London, EC1M 6BQ, UK 43 Division of Endocrinology, Boston Children's Hospital, Boston, MA 02115, USA 44 Center for Basic and Translational Obesity Research, Boston Children's Hospital, Boston, MA 02115, USA 45 Program in Medical and Population Genetics, Broad Institute, 7 Cambridge Center, Cambridge, MA 02142, USA 46 Novo Nordisk Foundation Centre for Basic Metabolic Research, Section of Metabolic, Genetics, Faculty of Health and Medical Sciences, University of Copenhagen, Copenhagen, 2100, Denmark 47 Department of Epidemiology Research, Statens Serum Institut, 2300, Copenhagen,
A
uthor Man
uscr
ipt
A
uthor Man
uscr
ipt
A
uthor Man
uscr
ipt
A
uthor Man
uscr
Denmark 48 National Heart, Lung and Blood Institute's Framingham Heart Study, Framingham, MA 01702, USA 49 Dept. Dev. Bio. And Genetics, Stanford University Medical Center, Stanford, CA 94305, USA 50 Department of Psychiatry, VU University Medical Center, Amsterdam, The Netherlands 51 National Heart, Lung and Blood Institute, Cardiovascular Epidemiology and Human Genomics Branch, Bethesda, MD 20814, USA 52 Center for Genome Science, National Institute of Health, Osong Health Technology Administration Complex, Chungcheongbuk-do, Republic of Korea 53 Division of Translational Medicine and Human Genetics, Department of Medicine, University of Pennyslvania, USA 54 Department of Genetics, University of North Carolina, Chapel Hill, NC 27599, USA 55 Department of Preventive Medicine and Epidemiology, Loyola University Chicago Stritch School of Medicine, Maywood, IL, 60153, USA 56 Institute of Social and Preventive
Medicine (IUMSP), Centre Hospitalier Universitaire Vaudois and University of Lausanne, Route de la Corniche 10, 1010 Lausanne, Switzerland 58 HudsonAlpha Institute for Biotechnology, Huntsville, AL 35086, USA 59 Department of Nutrition, University of North Carolina, Chapel Hill, NC 27599, USA 60 Genetic Epidemiology Unit, Department of Epidemiology, Erasmus MC, Rotterdam, 3015CN, The
Netherlands 61 Uppsala University, Department of Medical Sciences, SE-75185 Uppsala, Sweden 62 Dipartimento di Scienze Farmacologiche e Biomolecolari, Università di Milano, Milan, Italy 63 Centro Cardiologico Monzino, IRCCS, Milan, Italy 64 INSERM Centre for Research in Epidemiology and Population Health, U1018,
Villejuif, France University Paris-Sud, URMS 1018, Villejuif, France 65 Geriatric Unit, Azienda Sanitaria Firenze (ASF), Florence, Italy 66 Wellcome Trust Sanger Institute, Wellcome Trust Genome Campus, CB10 1SA, Hinxton, UK 67 University of
Cambridge Metabolic Research Laboratories, Level 4, Institute of Metabolic Science Box 289 Addenbrookes Hospital Cambridge CB2 OQQ, UK 68 NIHR Cambridge Biomedical Research Centre, Level 4, Institute of Metabolic Science Box 289 Addenbrookes Hospital Cambridge CB2 OQQ, UK 69 School of Life Science, University of Lincoln, Joseph Banks Laboratories, Lincoln LN6 7DL, UK 70 Cardiovascular Health Research Unit, Department of Medicine, University of Washington, Seattle, WA 98101, USA 71 Human Genetics Center, School of Public Health, University of Texas Health Science Center at Houston, 1200 Pressler St., Suite 453E, Houston, TX 77030, USA 72 Medical Genomics and Metabolic Genetics Branch, National Human Genome Research Institute, NIH, Bethesda, MD 20892, USA 73 Department of Biological Psychology, VU University, Amsterdam, The Netherlands 74 Dept of Medicine III, University of Dresden, Medical Faculty Carl Gustav Carus, Fetscherstrasse 74, 01307 Dresden, Germany 75 The Barts Heart Centre, William Harvey Research Institute, Queen Mary University of London, London EC1M 6BQ, UK 76 Nephrology, Centre Hospitalier Universitaire Vaudois and University of Lausanne, Bugnon 17, 1005 Lausanne, Switzerland 77 Department of Epidemiology and Biostatistics, School of Public Health, Imperial College London, Norfolk Place, London W2 1PG, UK 78 Department of Cardiology, Ealing Hospital NHS Trust, Uxbridge Road, Southall, Middlesex UB1 3EU, UK 79 Imperial College Healthcare NHS Trust, London, UK 80 National Institute of Cancer Research,
A
uthor Man
uscr
ipt
A
uthor Man
uscr
ipt
A
uthor Man
uscr
ipt
A
uthor Man
uscr
National Health Research Institutes. 35 Keyan Rd., Zhunan Town, Miaoli County 350, Taiwan 81 Singapore Eye Research Institute, Singapore National Eye Centre, Singapore 168751, Singapore 82 Duke-NUS Graduate Medical School Singapore, Singapore 169857, Singapore 83 Department of Ophthalmology, National University of Singapore and National University Health System, Singapore 119228 84 Division of Biostatistics and Bioinformatics, Institute of Population Health Sciences, National Health Research Institutes. 35 Keyan Rd., Zhunan Town, Miaoli County 350, Taiwan 85 University of Dundee, Ninewells Hospital and Medical School, Dundee, DD1 9SY,
UK 86 Institute of Epidemiology I, Helmholtz Zentrum München, Neuherberg 85764, Germany 87 Institute of Epidemiology II, Helmholtz Zentrum München, Neuherberg 85764, Germany 88 UMR744 Inserm-Lille2-Institut Pasteur Lille, France 89
Department of Public Health and Primary Care, University of Cambridge, Cambridge CB1 8RN, UK 90 NIHR Blood and Transplant Research Unit in Donor Health and Genomics, Department of Public Health and Primary Care, University of Cambridge, Cambridge CB1 8RN, UK 91 Division of Cardiovascular Epidemiology, Institute of Environmental Medicine, Karolinska Institutet, Stockholm, Sweden 92 BHF Glasgow Cardiovascular Research Centre, Institute of Cardiovascular and Medical Sciences, University of Glasgow, 126 University Place, Glasgow, G12 8QT, UK 93 Cardiovascular Epidemiology and Genetics. IMIM (Institut Hospital del Mar d'Investigacions Mèdiques), Barcelona, Spain 94 Department of Immunology, Genetics and Pathology, University of Uppsala, Box 815, Biomerical center, 751 08 Uppsala, Sweden 95 Science for Life Laboratory, University of Uppsala, Box 815, Biomerical center, 751 08 Uppsala, Sweden 96 Institut für Integrative und
Experimentelle Genomik, Universiät zu Lübeck, RatzeburgerAllee 160, 23538 Lübeck, Germany 97 Deutsches Zentrum für Herz-Kreislauf-Forschung (DZHK), partner site Hamburg, Kiel, Lübeck, Universität zu Lübeck, Lübeck, Germany 98 Estonian Genome Center, University of Tartu, Tartu, 51010, Estonia 99 Divisions of Endocrinology/Children's Hospital, Boston, MA 02115, USA 100 Broad Institute of Harvard and MIT, Cambridge, MA 02139 USA 101 Department of Hygiene and Epidemiology, University of Ioannina Medical School, Ioannina, 45110, Greece 102 Department of Medical Sciences, Molecular Epidemiology and Science for Life Laboratory, Uppsala University, Uppsala, Sweden 103 Division of Cardiovascular Medicine, Radcliffe Department of Medicine, University of Oxford, Oxford, OX3 9DU, UK 104 Department of Epidemiology, Erasmus MC, University Medical Center Rotterdam, P.O.Box 2040, 3000 CA Rotterdam, The Netherlands 105 Toulouse University School of Medicine, Rangueil University Hospital, INSERM UMR1027, Toulouse, France 106 Translational Gerontology Branch, National Institute on Aging, Baltimore MD, USA 107 Institute of Molecular Medicine, University of Texas Health Science Center at Houston, TX, USA 108 Tropical Metabolism Research Unit, Tropical Medicine Research Institute, University of the West Indies, Mona, Kingston 7, Jamaica 109 Department of Epidemiology, University of North Carolina, Chapel Hill, NC 27599, USA 110 Cardiothoracic Surgery Unit, Department of Molecular Medicine and Surgery, Karolinska Institutet, 171 76 Stockholm, Sweden 111 Institute for Population Health Sciences and Informatics, University of Edinburgh, Teviot