On Orchestrating Virtual Network Functions
Md. Faizul Bari, Shihabur Rahman Chowdhury, Reaz Ahmed, and Raouf Boutaba
David R. Cheriton School of Computer Science, University of Waterloo[mfbari | sr2chowdhury | r5ahmed | rboutaba]@uwaterloo.ca
Abstract—Middleboxes or network appliances like firewalls, proxies, and WAN optimizers have become an integral part of today’s ISP and enterprise networks. Middlebox functionalities are usually deployed on expensive and proprietary hardware that require trained personnel for deployment and maintenance. Middleboxes contribute significantly to a network’s capital and operational costs. In addition, organizations often require their traffic to pass through a specific sequence of middleboxes for compliance with security and performance policies. This makes the middlebox deployment and maintenance tasks even more complicated. Network Function Virtualization (NFV) is an emerg-ing and promisemerg-ing technology that is envisioned to overcome these challenges. It proposes to move packet processing from dedi-cated hardware middleboxes to software running on commodity servers. In NFV terminology, software middleboxes are referred to as Virtual Network Functions (VNFs). It is a challenging problem to determine the required number and placement of VNFs that optimize network operational costs and utilization, without violating service level agreements. We call this the VNF Orchestration Problem (VNF-OP) and provide an Integer Linear Programming (ILP) formulation with implementation in CPLEX. We also provide a dynamic programming based heuristic to solve larger instances of VNF-OP. Trace driven simulations on real-world network topologies demonstrate that the heuristic can provide solutions that are within 1.3 times of the optimal solution. Our experiments suggest that a VNF based approach can provide more than4×reduction in the operational cost of a network.
I. INTRODUCTION
Today’s enterprise networks ubiquitously deploy vertically integrated proprietary middleboxes to offer various network services. Examples of such middleboxes include firewalls, proxies, WAN optimizers, Intrusion Detection Systems (IDSs), and Intrusion Prevention Systems (IPSs). A recent study shows that the number of middleboxes is comparable to that of routers in an enterprise network [29]. However, middleboxes come with high Capital Expenditures (CAPEX) and Oper-ational Expenditures (OPEX). They are expensive, vendor-specific, and require specially trained personnel for configura-tion and maintenance. Moreover, it is often impossible to add new functionalities to an existing middlebox, which makes it very difficult for network operators to deploy new services.
Another problem arises from the fact that most often a traffic is required to pass through multiple stages of middle-box processing in a particular order, e.g., a traffic may be required to go through a firewall, then an IDS, and finally through a proxy [26]. This phenomenon is typically referred to as Service Function Chaining (SFC) [27]. Several IETF drafts demonstrate middlebox chaining use-cases in operator networks [19], mobile networks [17], and data center net-works [31]. Currently, this task is performed by manually crafting the routing table entries. It is a cumbersome and
error-prone process. Moreover, a fixed placement cannot be optimal for all possible traffic patterns in the long run.
An emerging and promising technology that can ad-dress these limitations is Network Function Virtualization (NFV) [13]. It proposes to move packet processing from hard-ware middleboxes to softhard-ware middleboxes or Virtual Network Functions (VNFs). Instead of running hardware middleboxes, the same packet processing tasks are performed by software running on commodity servers. This approach does not hamper performance as many state-of-the-art software middleboxes have already achieved near-hardware performance [22], [18]. NFV provides ample opportunities for network optimization and cost reduction. Previously, middleboxes were hardware appliances placed at fixed locations, but we can deploy a VNF virtually anywhere in the network.
VNF chains can be orchestrated by dynamically deploying a composition of VNFs either on a single server or a cluster of servers. This approach can significantly reduce the OPEX of a network. However, several issues must be considered during VNF provisioning: (i) the cost of deploying a new VNF, (ii) energy cost for running a VNF, and (iii) the cost of forwarding traffic to and from a VNF. An optimal VNF orchestration strategy must address these issues during the cost minimization process. Moreover, it must avoid penalties for Service Level Objective (SLO) violations and satisfy the capacity constraints of the physical servers and physical links. We refer to this problem as the Virtual Network Function Orchestration Problem (VNF-OP).
Our key contributions can be summarized as follows:
• We identify the VNF orchestration problem and provide the first quantifiable results showing that dynamic VNF orchestration can have more than4×reduction in OPEX.
• The problem is formulated as an Integer Liner Program (ILP) and implemented in CPLEX to find optimal solu-tions for small scale networks.
• Finally, we propose a fast heuristic algorithm that finds
solutions within 1.3 times of the optimal for real-world topologies and traffic traces.
The rest of the paper is organized as follows: we start by explaining the mathematical model used for our system and by formally defining the VNF Orchestration Problem (Section II). Then the problem formulation is presented (Section III). Next, a heuristic is proposed to obtain near-optimal solutions (Section IV). We validate our solution through trace driven simulations on real-world network topologies (Section V). Then, we provide a literature review (Section VI). Finally, we conclude in Section VII.
II. MATHEMATICALMODEL ANDPROBLEMDEFINITION A. Physical Network
We represent the physical network as an undirected graph ¯
G = ( ¯S,L¯), where S¯ and L¯ denote the set of switches and links, respectively. We assume that VNFs can be deployed on commodity servers located within the network. The setN¯
represents these servers, and the binary variable ¯hn¯¯s∈ {0,1} indicates whether server ¯n∈N¯ is attached to switchs¯∈S¯.
¯
h¯ns¯=
1 if servern¯∈N¯ is attached to switch ¯s∈S,¯ 0 otherwise.
Let,Rdenote the set of resources (CPU, memory, disk,etc.) offered by each server. The resource capacity of server n¯ is denoted by crn¯ ∈R+, ∀ r∈R. The bandwidth capacity and
propagation delay of a physical link(¯u,v¯)∈L¯ is represented by βu¯¯v ∈R+ andδu¯v¯ ∈R+, respectively. We also define a
functionη(¯u)that returns the neighbors of switchu¯.
η(¯u) ={¯v |(¯u,¯v)∈L¯ or (¯v,u¯)∈L¯}, u,¯ v¯∈S¯
B. Virtual Network Functions (VNFs)
Different types of VNFs (e.g., firewall, IDS, IPS, proxy, etc.) can be provisioned in a network. Set P represents the possible VNF types. VNF type p ∈ P has a specific deployment cost, resource requirement, processing capacity, and processing delay represented by D+
p,κrp∈R+(∀r∈R),
cp(in Mbps), andδp(in ms), respectively. Each VNF type has a set of servers on which it can be provisioned. The following binary variable represents this relationship:
d¯np=
1 if VNF typep∈P can be provisioned onn,¯ 0 otherwise.
C. Traffic Request
We assume that the network operator is receiving path setup requests for different kinds of traffic. A traffic request is represented by a 5-tuple t = hu¯t,v¯t,Ψt, βt, δti, where ¯
ut,¯vt∈S¯denote the ingress and egress switches, respectively.
βt ∈
R+ is the bandwidth demand of the traffic. δt is
the expected propagation delay according to Service Level Agreement (SLA). Ψt represents the ordered VNF sequence the traffic must pass through (e.g., FirewallIDSProxy) andlΨt denotes the length of the VNF sequenceΨt.
Ingress
Firewall IDS Proxy Egress Fig. 1. Traffic Model
We represent a traffic request t by a directed graph
Gt = (Nt, Lt), where Nt represents the set of traffic nodes (switches or VNFs) and Lt denotes the links between them. Fig. 1 represents a traffic that requires to pass through the VNF sequence: Firewall IDS Proxy. Modeling the traffic in this way makes it easy for the provisioning process to ensure that it passes though the correct sequence of VNFs. We also defineηt(n
1)to represent the neighbors ofn1∈Nt:
ηt(n1) ={n2 |(n1, n2)∈Lt}, n1, n2∈Nt
Next, we define a binary variablegnp ∈ {0,1} to indicate the type of a noden∈Nt
gtnp=
1 if node n∈Nt is of typep∈P, 0 otherwise.
D. VNF Orchestration Problem (VNF-OP)
Here, we are given a physical network topology, VNF specifications, network status, and a set of traffic requests. Our objective is to minimize the overall network OPEX by (i) provisioning optimal number of VNFs, (ii) placing them at optimal locations, and (ii) finding optimal routing paths, while respecting the capacity constraints (e.g., physical servers, links, VNFs), delay constraints, and ensuring proper VNF sequence.
III. INTEGERLINEARPROGRAMMING(ILP) FORMULATION
VNF-OP is a considerably harder problem to solve than traditional Virtual Network (VN) embedding problems [11], [12], [5], as virtual resources are shared between multiple requests. In this work, we address these challenges by judi-ciously augmenting the physical network as explained in the rest of the section.
A. Physical Network Transformation
We transform the physical network to generate an aug-mented pseudo-network that reduces the complexity involved in solving the VNF-OP. The transformation process is per-formed in two steps:
1) VNF Enumeration: A part of the original physical net-work topology is shown in Fig. 2(a). Here, we have three switches (s1, s2, ands3) and a servern2connected to switch
s2. The first transformation is called VNF enumeration, as we enumerate all possible VNFs in this step. The modified network after the first transformation is shown in Fig. 2(b). In this step, we find the maximum number for each VNF type that can be deployed on each server. We calculate this number based on the resource capacities of the server and the resource requirements of a VNF type. In Fig. 2(b) we show enumerated VNFs for servern2.
We denote the set of these VNFs (called pseudo-VNFs) by
M. Each VNF m ∈ M is implicitly attached to a server ¯
n∈N¯. We use the functionζ(m)to denote this mapping.
ζ(m) = ¯nif VNFm is attached to servern¯
We also define a function Ω(¯n) to represent the pseudo-VNFs attached to servern¯:
Ω(¯n) ={m| ζ(m) = ¯n}, m∈ M,n¯∈N¯
Next, we defineqmp∈ {0,1}to indicate the type of a VNF:
qmp=
1 if VNF mis of typep∈P,
0 otherwise.
As discussed earlier, a given type of VNF can be deployed on a specific set of servers. To ensure this we must have:
qmp=dζ(m)p (1)
We should note that pseudo-VNFs simply represent where a particular type of VNF can be provisioned. ym ∈ {0,1} indicates whether a pseudo-VNF is active or not.
ym=
1 if pseudo-VNFm∈ Mis active,
s1 s2 s3
n2
Switch Server
(a) Original Network
s1 s2 s3 n2 Firewall Proxy IDS (b) VNF Enumeration s1 s2 s3 Pseudo Switch (c) Adding pseudo-switches Fig. 2. Network Transformation
2) Adding Pseudo-Switches: Next, we augment the physi-cal topology again by adding a pseudo-switch between each pseudo-VNF and the original switch to which it was attached. This process is shown in Fig. 2(c). We perform this step to simplify the expressions of the network flow conservation constraint in the ILP formulation presented next. This process does not increase the size of the solution space as we consider them only for the flow conservation constraint.
B. ILP Formulation
We define the decision variablextnm to represent the map-ping of a traffic node to a pseudo-VNF:
xtnm=
1 if node n∈Ntis provisioned onm∈ M, 0 otherwise.
Next, we define another variable to represent the mapping between a traffic node and a switch in the physical network.
znts¯=
1 if noden∈Nt is attached to switchs,¯ 0 otherwise.
zt
n¯sis not a decision variable as it can be derived fromxtnm:
znt¯s= 1 ifxtnm= 1 and¯hζ(m)¯s= 1
We can also derive the variable ym fromxtnm as follows:
ym= 1 if X t∈T X n∈Nt xtnm>0
We assume that xˆtnm represents the value of xtnm at the last traffic provisioning event. To ensure that resources for previously provisioned traffic are not deallocated we must have
xtnm ≥ xˆtnm, ∀ t ∈ T , nˆ ∈ Nt, m ∈ M. Now, we define
ˆ
ym∈ {0,1} that represents the value ofym at the last traffic provisioning event as follows:
ˆ ym= 1 if X t∈T X n∈Nt ˆ xtnm>0
Again, to ensure that resources for previously provisioned traffics are not deallocated we must have ym≥yˆm, ∀ m∈
M. Next, we need to ensure that VNF capacities are not over-committed. The processing capacity of an active VNF must be greater than or equal to the total amount of traffic passing through it. We express this constraint as follows:
X
t∈T X
n∈Nt
xtnm×βt≤cm, ∀m∈ M|ym= 1 (2)
We also need to make sure that physical server capacity con-straints are not violated by the deployed VNFs. We represent this constraint as follows:
X m∈Ω(¯n) ym×κrm≤c r ¯ n, ∀n¯∈N , r¯ ∈R (3)
Each node of a traffic must be mapped to a proper VNF type. This constraint is represented as follows:
xtnm×gtnp=qmp, ∀ t∈T, n∈Nt, m∈ M, p∈P (4)
Next, we need to ensure that every traffic node is provi-sioned and to exactly one VNF.
X
t∈T X
n∈Nt
xtnm= 1, ∀m∈ M (5)
Now, we define our second decision variable to represent the mapping between links in the traffic model (Fig. 1) to the links in the physical network.
wtn1n2
¯
u¯v =
1 if(n1, n2)∈Ltuses physical link (¯u,¯v), 0 otherwise.
We also assume thatwˆtn1n2
¯
u¯v represents the value ofwutn¯¯v1n2 at the last traffic provisioning event. To ensure that resources for previously provisioned traffics are not deallocated in the current iteration we must have
wtn1n2 ¯ uv¯ ≥wˆ tn1n2 ¯ u¯v ,∀ t∈T , nˆ 1, n2∈Nt|n2∈ηt(n1) andn2> n1,u,¯ ¯v∈S¯ (6)
To ensure that each directed link in a traffic request is not mapped to both directions of a physical link, we must have:
wtn1n2 ¯ uv¯ +w tn1n2 ¯ vu¯ ≤1,∀ t∈T, n1, n2∈Nt|n2∈ηt(n1)andn2> n1,u,¯ ¯v∈S¯ (7)
Now, we present the capacity constraint for physical links:
X ¯ u∈S¯ X ¯ v∈S¯ (wtn1n2 ¯ uv¯ +w tn1n2 ¯ vu¯ )×βt≤βu¯v¯, ∀t∈T, n1, n2∈Nt|n2∈ηt(n1)andn2> n1 (8)
Next, we present the flow constraint that makes sure that the in-flow and out-flow of each switch in the physical network is equal except at the ingress and egress switches:
X ¯ v∈η(¯u) wtn1n2 ¯ uv¯ −wvtn¯u¯1n2 =znt 1¯u−z t n2u¯, ∀ t∈T, n1, n2∈Nt|n2∈ηt(n1)andn2> n1,u¯∈S¯ (9)
To meet SLOs, the total propagation delay experienced by traffic tmust be within the expected propagation delayδt:
X n1∈Nt X n2∈ηt(n1) andn2>n1 X ¯ u∈S¯ X ¯ v∈η(¯u) wtn1n2 ¯ u¯v δu¯v¯≤δt (10)
Finally, we need to ensure that every link in a traffic request is provisioned on one or more physical links in the network:
X ¯ u∈S¯ X ¯ v∈S¯ (wtn1n2 ¯ u¯v +w tn1n2 ¯ vu¯ )≥0, ∀ t∈T, n1, n2∈Nt|n2∈ηt(n1)andn2> n1 (11)
Our objective is to find the optimal number and placement of VNFs that minimizes OPEX for the network. We formulate them in detail below:
– OPEX: We consider three cost components to contribute
to OPEX. These are as follows:
1. VNF Deployment Cost:the VNF deployment cost can be expressed as follows:
D=
X
m∈M|ym=1
D+p ×qmp×(ym−yˆm) (12) 2. Energy Cost:Without loss of generality we assume that the energy consumption of a server is proportional to the amount of resources being used. However, a server usually consumes power even in the idle state. So, we compute the power consumption of a server as follows:
En¯ = X m∈Ω¯n ym×qmp×er(crn¯, κ r p) where er(rt, rc) = (ermax−e r idle)× rc rt +eridle
Here, rt and rc denote the total and consumed resource, respectively.er
idle andermaxdenote the energy cost in the idle and peak consumption state forr, respectively.
E= X ¯ n∈N¯ X m∈Ω¯n ym×qmp×er(crn¯, κ r p) (13) 3. Cost of Forwarding Traffic: Let us assume that the cost of forwarding 1 Mbit data through one link in the network is
σ (in dollars). So, cost of traffic forwarding:
F= X t∈T n1∈Nt X n2∈ηt(n1) andn2>n1 X ¯ u∈S¯ ¯ v∈η(¯u) (wtn1n2 ¯ u¯v −wˆ tn1n2 ¯ u¯v )×β t×σ (14) Our objective is to minimize the weighted sum of the aforementioned costs.
minimize αD+βE+γF
(15) Here, α, β, and γ are weighting factors that are used to adjust the relative importance of the cost components. We can reduce the Multi-Commodity, Multi-Plant, Capacitated Facility Location Problem (MCMP-CFLP)[25], [10]) to VNF-OP, which is known to be NP-Hard. Hence, VNF-OP is also NP-Hard [8]. Next, we propose a heuristic algorithm.
IV. HEURISTICSOLUTION
Given a network topology, a set of middlebox specifications, and a batch of traffic requests, the heuristic finds the number and locations of different VNF types required to operate the network with minimal OPEX. The heuristic runs in two steps: (i) we model the VNF-OP as a multi-stage directed graph with associated costs, (ii) we find a near-optimal solution from the multi-stage graph by running the Viterbi algorithm [14]. A. Modeling with Multi-Stage Graph
For a given traffic request, t = hu¯t,¯vt,Ψt, βt, δti, we represent t as a multi-stage graph with lΨt + 2 stages.
The first and the last (lΨt + 2) stages represent the ingress
and egresses switches, respectively. These two stages contain only one node representing u¯t and v¯t, respectively. Stage i
(∀i∈ {2, . . .(lΨt+ 1)}), represents the(i−1)-th VNF and the
node(s) within this stage represent the possible server locations where a VNF can be placed. Each node is associated with a
VNF deployment cost (Eq. 12) and an energy cost (Eq. 13), as described in Section III-B.
An edge (¯vi,¯vj) in this multi-stage graph represents the placement of a VNF at a server attached to switch v¯j, given that the previous VNF in the sequence is deployed on a server attached to switch ¯vi. We put a directed edge between all pairs of nodes in stage i and i+ 1 (∀i ∈ {1,2, . . .(lΨt +
1)}). We associate the traffic forwarding cost (Eq. 14) with each edge. This cost is proportional to the weighted shortest path (in terms of latency) between the switches. The total cost of a transition between two successive stages in the multi-stage graph is calculated by summing the node and edge costs following Eq. 15. Finally, a path from the node in the first stage to the node in the last stage represents a placement of the VNFs. Our goal is to find a path in the multi-stage graph that yields minimal OPEX.
B. Finding a Near-Optimal Solution
The Viterbi algorithm is a widely used method for finding the most likely sequence of states from a set of observed states. To find such a sequence, Viterbi algorithm first models the states and their relationships as a multi-stage graph and then computes a per node cumulative cost,costu, recursively defined as the minimum ofcostv+transition cost(v, u), for all v in the previous stage as of u’s stage. This computation proceeds in increasing order of the stages. The most likely sequence of states is constructed by tracing back a path from the final stage back to the first that yields the minimum cost. We borrow the idea of how costs are computed from Viterbi Algorithm and propose a traffic provisioning algorithm,
P rovisionT raf f ic(Algorithm 1). It takes a traffic requestt
and a network topologyG¯ as input and returns a placement of ΨtinG¯. For each nodeuin each stagei, we find a nodevin stagei−1that yields the minimum total costcostv,u (defined according to Section IV-A). We keep track of the minimum cost path using the table π. The desired VNF placement is constructed by back tracing pointers from the final stage to the first stage using π. For each traffic request, the heuristic
Algorithm 1 ProvisionTraffic(t,G¯)
1: ∀(i, j)∈ {1. . .|Ψt|} × {1. . .|S¯|}:costi,j← ∞,πi,j←N IL
2: ∀i∈ |S¯|: 3: ifIsResourceAvailable(ut, i,Ψt1, t)then 4: cost1,n←GetCost(ut, i,Ψt1, t),π1,n←n 5: end if 6: ∀(i, j, k)∈ {2. . .|Ψt|} × {1. . .|S¯| × {1. . .|S¯|}: 7: ifIsResourceAvailable(k, j,Ψti, t)then
8: costi,j←min{costi,j, costi−1,k+GetCost(k, j,Ψti, t)}
9: πi,j←iyielding minimumcosti,j
10: end if
11: Π←N IL,C← ∞,ψ←<>
12: ∀i∈ |S¯|:
13: C←min{C, cost|Ψt|,i+F orwardingCost(i, vt)+ SLOV iolationCost(i, vt, t)}
14: Π←iyielding minimumcost|Ψt|,i
15: ∀i∈<|Ψt|,|Ψt| −1. . .1>
: AppendΠto ψ,Π←πi,Π
0 0.25 0.5 0.75 1 0 2000 4000 6000 8000 10000
Fraction of Peak Traffic
Time (min) (a) Internet2 0 0.25 0.5 0.75 1 0 5 10 15 20 25 30 35 40
Fraction of Peak Traffic
Time (min)
(b) Data Center Fig. 4. Traffic Distribution over Time for Different Scenarios
TABLE I
SERVER ANDMIDDLEBOXDATAUSED INEVALUATION Server Data [1]
Physical CPU Cores Idle Energy Peak Energy
16 80.5W 2735W
Hardware Middlebox Data
Idle Energy Peak Energy Processing Capacity 1100W 1700W 40Gbps
VNF Data [4], [22]
Network Function CPU Required Processing Capacity
Firewall 4 900Mbps
Proxy 4 900Mbps
Nat 2 900Mbps
IDS 8 600Mbps
runs in Θ(n2m) time, where nis the number of switches in the network and mis the VNF sequence length.
V. PERFORMANCEEVALUATION
We perform trace driven simulations on real-world network topologies to gain a deeper insight, and to evaluate the effec-tiveness of the proposed solutions. Our simulation is focused on the following aspects: (i) demonstrating the benefits of dynamic VNF orchestration over hardware middleboxes (Sec-tion V-C), (ii) comparing the performance of the heuristic solution with that of the optimal solution (Section V-D), and (iii) comparing the performance of our heuristic with state-of-the-art (Section V-E). Before presenting the results, we briefly describe the simulation setup (Section V-A) and the evaluation metrics (Section V-B). Source code is available at http://goo.gl/Da7EZu.
A. Simulation Setup
1) Topology Dataset: We used two types of networks: (i) Internet2 research network (12nodes,15links) [3], and (ii) A university data center network (23nodes,42links) [9].
2) Traffic Dataset: We use real traffic traces for the eval-uation. We use traffic matrix traces from [3] to generate time varying traffic for the Internet2 topology. This trace contains a snapshot of a 12 ×12 traffic matrix and demonstrates significant variability in traffic volume. For the data center network, we use the traces available from [9], and replay the traffic between random source-destination pairs.
3) Middlebox and Cost Data: We have generated a3-length middlebox sequence for each traffic based on the data provided in [2], [26]. We have used publicly available data sheets from manufacturers and service providers to select and infer values for server energy cost and resource requirements for software middleboxes and their processing capacities. We also obtained energy consumption data for hardware middleboxes from a popular network equipment manufacturer. Table I lists the parameters used for servers, VNFs, and middleboxes.
B. Evaluation Metrics
1) Operational Expenditure (OPEX): We measure OPEX according to Eq. 15, and compare CPLEX and heuristic by plotting the ratio of OPEX and its components.
2) Execution Time: It is the time required to find middlebox placement for a given traffic batch and network topology. C. VNFs vs. Hardware Middleboxes
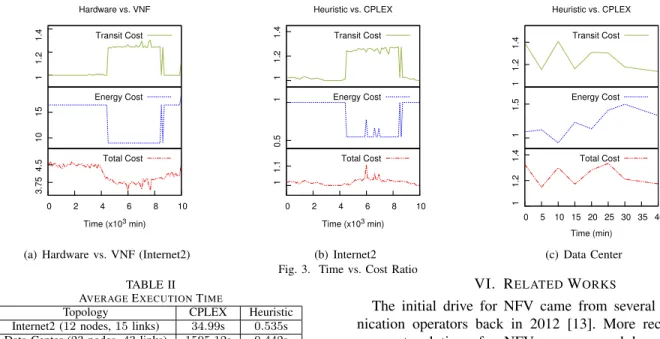
One of the driving forces behind NFV is that VNFs can significantly reduce a network’s OPEX. Here, we provide quantifiable results to validate this claim. Fig. 3(a) shows the ratio of OPEX for hardware middleboxes to VNFs for incoming traffic provisioning requests (about132requests per batch) over a period of10000minutes. We show two compo-nents of OPEX: energy and transit cost. There is no publicly available data that can be used to estimate the deployment cost of hardware middleboxes. So, for this experiment, we do not consider deployment cost as a component of OPEX to make the comparison fair. We implemented a separate CPLEX program that finds the optimal number and location of hardware middleboxes for the same traffic. This program finds the optimal values over all time-instances. VNFs are provisioned at each time-instance by the CPLEX program corresponding to the formulation provided in Section III.
The bottom part of Fig. 3(a) shows that VNFs provide more than 4× reduction in OPEX. The individual reductions in energy and transit costs are also shown in the same figure. The reduction in energy cost is much higher than that of the transit cost. This is due to the fact that hardware middleboxes consume considerably higher energy than commodity servers. From Fig. 3(a) and Fig. 4(a), we can also see that with the increase in traffic volume (after time-instance 4000) the total cost ratio decreases. Interestingly, the energy cost ratio decreases, but the transit cost ratio increases. Handling higher traffic volume requires higher number of VNFs to be de-ployed, which increases the energy consumption of commodity servers, thus decreasing the energy cost ratio. However, VNFs are provisioned at optimal locations, which causes the transit cost to decrease and increases the transit cost ratio.
D. Performance Comparison Between CPLEX and Heuristic Now, we compare the performance of our heuristic with that of the optimal solution. Fig. 3(b) and Fig. 3(c) show the cost ratios for Internet2 and data center networks, respectively. The traffic patterns for these two topologies are shown in Fig. 4(a) and Fig. 4(b), respectively. The deployment cost is not shown as it is equal in both cases. From Fig. 3(b), we can see that the heuristic finds solutions that are within 1.1 times of the optimal solution. During peak traffic periods, the ratio of energy cost goes below 1, but the ratio of transit cost increases. The optimal solution adapts to high traffic volumes by deploying more VNFs (increasing energy cost) and placing them at locations that decrease the transit cost. As a result, the ratio of energy cost decreases and the ratio of transit cost increases. However, the total cost ratio stays almost the same (varying between1 and1.1). Similar results are obtained for
3.75 4.5 0 2 4 6 8 10 Time (x103 min) Total Cost 10 15 Energy Cost 1 1.2 1.4 Transit Cost
(a) Hardware vs. VNF (Internet2)
1 1.1 0 2 4 6 8 10 Time (x103 min) Total Cost 0.5 1 Energy Cost 1 1.2 1.4 Transit Cost (b) Internet2 1 1.2 1.4 0 5 10 15 20 25 30 35 40 Time (min) Total Cost 1 1.5 Energy Cost 1 1.2 1.4 Transit Cost (c) Data Center Fig. 3. Time vs. Cost Ratio
TABLE II AVERAGEEXECUTIONTIME
Topology CPLEX Heuristic
Internet2 (12nodes,15links) 34.99s 0.535s Data Center (23nodes,43links) 1595.12s 0.442s
the data center network (Fig. 3(c)) as well. Here, the cost ratio is also very close to1 and varies between1.1 and1.3.
The average execution times of the heuristic and CPLEX are shown in Table II. They were run on a machine with10×16 -Core 2.40GHz Intel Xeon E7-8870 CPUs and1TB memory. As we can see, our heuristic provides solutions that are very close to the optimal one and its execution time is several order of magnitude faster than CPLEX.
E. Performance Comparison with Previous Work
0 10 20 30 40 50 60 70 80 0 50 100 150 200 250 300 Deployed VNFs Requested VNFs NFO-DP NFO-BS (a) VNFs Deployed 0.1 1 10 100 1000 10000 10 20 30 40 50 60 70 80 90 100
Execution Time (s) [Log Scale]
Number of Chaining Requests NFO-DP NFO-BS
(b) Execution Time Fig. 5. Performance comparison with [21]
We demonstrate the effectiveness of our proposed heuristic (NFO-DP) over prior work by comparing with a very recent and relevant one. We implemented the binary search based heuristic proposed in [21] (NFO-BS) and ran it on a ma-chine with similar configurations. We adjusted the heuristic parameters according to the provided guideline in the paper. We experimented with a moderate sized ISP network topology with 79 nodes and 147 links (AS3967 from RocketFuel ISP topologies [30]). We varied the number of VNF chaining requests from10to100and measured the execution time along with the number of deployed VNFs. The results are reported in Fig. 5. The binary search based approach could not find a feasible solutions within the set time limits for more than 60 chains. Our findings show that, on a similar problem instance our proposed heuristic outperforms the state-of-the art in both solution quality and execution time.
VI. RELATEDWORKS
The initial drive for NFV came from several telecommu-nication operators back in 2012 [13]. More recently, Man-agement solutions for NFV are proposed by projects like Stratos [15], OpenNF [16]. Stratos proposes an architecture for orchestrating VNFs to a remote cloud with focus on traffic engineering and horizontal scaling of VNFs. OpenNF proposes a converged control plane for VNFs and network forwarding plane by extending the centralized SDN paradigm. An OpenStack based VNF orchestration system is presented in [20]. It proposes to modify the compute and networking engine of OpenStack to support intelligent placement of VNFs in VMs and transparently deploy service chains. Initial studies on placement of VNFs and VNF chains in both IP and optical networks is presented in [23], [24], [21], [32], [28], [7], [6]. However, none of the aforementioned research works address the issue of dynamically adjusting the placement of VNFs to balance between network operating cost and performance.
VII. CONCLUSION
Virtualized network functions provide a flexible way to deploy, operate, and orchestrate network services with much less capital and operational expenses. Our model can be used to determine the optimal number of VNFs and to place them at the optimal locations to optimize network operational cost and resource utilization. Our trace driven simulations on the Internet2 research network demonstrate that network OPEX can be reduced by a factor of 4 over hardware middleboxes through proper VNF orchestration. In this paper, we presented two solutions to the VNF orchestration problem: CPLEX based optimal solution for small networks and a heuristic for larger networks. We found that the heuristic produces solutions that are within 1.3 times of the optimal solution, yet the execution-time is about 65 to 3500 times faster than that of the CPLEX solution.
VIII. ACKNOWLEDGMENTS
This work was supported by the Natural Science and Engineering Council of Canada (NSERC) under the Smart Applications on Virtual Infrastructure (SAVI) Research Network. We utilized the CrySP RIP-PLE Facility at the University of Waterloo to run our experiments.
REFERENCES
[1] Comparison of enterprise class power enclosure. http://www.dell.com/downloads/global/products/pedge/en/bladepower-studywhitepaper 08112010 final.pdf.
[2] https://datatracker.ietf.org/doc/draft-ietf-sfc-dc-use-cases/.
[3] Internet2 Research Network Topology and Traffic Matrix. http://www.cs.utexas.edu/˜yzhang/research/AbileneTM/.
[4] pfSense Hardware Sizing Guide. https://www.pfsense.org/hardware/#sizing. [5] M. Bari, R. Boutaba, R. Esteves, L. Z. Granville, M. Podlesny, M. G.
Rabbani, Q. Zhang, and M. F. Zhani. Data center network virtualization: A survey. Communications Surveys Tutorials, IEEE, 15(2):909–928, 2013.
[6] M. Bari, M. Zhani, Q. Zhang, R. Ahmed, and R. Boutaba. Cqncr: Optimal vm migration planning in cloud data centers. InNetworking Conference, 2014 IFIP, pages 1–9, June 2014.
[7] M. F. Bari, S. R. Chowdhury, R. Ahmed, and R. Boutaba. nf. io: A file system abstraction for nfv orchestration. InProceedings of ACM SIGCOMM 2015, pages 361–362, 2015.
[8] M. F. Bari, S. R. Chowdhury, R. Ahmed, and R. Boutaba. On orchestrating virtual network functions in NFV.CoRR, abs/1503.06377, 2015.
[9] T. Benson, A. Akella, and D. A. Maltz. Network traffic characteristics of data centers in the wild. InProc. of ACM IMC ’10, pages 267–280. [10] C.-C. Chiou. Transshipment problems in supply chain systems: review
and extensions.Supply Chain, pages 427–448, 2008.
[11] N. M. K. Chowdhury and R. Boutaba. A survey of network virtualiza-tion.Computer Networks, 54(5):862 – 876, 2010.
[12] N. M. M. K. Chowdhury and R. Boutaba. Network virtualization: state of the art and research challenges.Comm. Mag., 47:20–26, July 2009. [13] ETSI. Network Functions Virtualisation – Introductory White Paper.
https://portal.etsi.org/NFV/NFV White Paper.pdf, 2012.
[14] G. D. Forney Jr. The Viterbi Algorithm. Proc. of the IEEE, 61(3):268– 278, 1973.
[15] A. Gember, A. Krishnamurthy, S. S. John, R. Grandl, X. Gao, A. Anand, T. Benson, V. Sekar, and A. Akella. Stratos: A Network-Aware Orchestration Layer for Virtual Middleboxes in Clouds.arXiv preprint arXiv:1305.0209, 2013.
[16] A. Gember-Jacobson, R. Viswanathan, C. Prakash, R. Grandl, J. Khalid, S. Das, and A. Akella. OpenNF: enabling innovation in network function control. InProc. of ACM SIGCOMM ’14, pages 163–174.
[17] W. Haeffner, J. Napper, M. Stiemerling, D. Lopez, and J. Uttaro. Service Function Chaining Use Cases in Mobile Networks, 2014.
[18] J. Hwang, K. K. Ramakrishnan, and T. Wood. NetVM: High Perfor-mance and Flexible Networking Using Virtualization on Commodity Platforms. InProc. of USENIX NSDI ’14, pages 445–458.
[19] W. Liu, H. Li, O. Huang, M. Boucadair, N. Leymann, Q. Fu, Q. Sun, C. Pham, C. Huang, J. Zhu, and P. He. Service Function Chaining Problem Statement.draft-liu-sfc-use-cases-08 (work in progress), 2014. [20] F. Lucrezia, G. Marchetto, F. G. O. Risso, and V. Vercellone. Introducing network-aware scheduling capabilities in openstack. InProc. of NetSoft ’15. IEEE, 2015.
[21] M. C. Luizelli, L. R. Bays, L. S. Buriol, M. P. Barcellos, and L. P. Gas-pary. Piecing together the nfv provisioning puzzle: Efficient placement and chaining of virtual network functions. InIFIP/IEEE IM. IFIP/IEEE, 2015.
[22] J. Martins, M. Ahmed, C. Raiciu, V. Olteanu, M. Honda, R. Bifulco, and F. Huici. ClickOS and the art of network function virtualization. In Proc. of USENIX NSDI ’14, pages 459–473.
[23] S. Mehraghdam, M. Keller, and H. Karl. Specifying and placing chains of virtual network functions. In Cloud Networking (CloudNet), 2014 IEEE 3rd International Conference on, pages 7–13. IEEE, 2014. [24] H. Moens and F. De Turck. VNF-P: A Model for Efficient Placement
of Virtualized Network Functions. InProc. of ManSDN/NFV ’14. [25] H. Pirkul and V. Jayaraman. A Multi-commodity, Multi-plant,
Capac-itated Facility Location Problem: Formulation and Efficient Heuristic Solution.Comput. Oper. Res., 25(10):869–878, Oct. 1998.
[26] Z. A. Qazi, C.-C. Tu, L. Chiang, R. Miao, V. Sekar, and M. Yu. SIMPLE-fying middlebox policy enforcement using SDN. In Proc. of ACM SIGCOMM ’13, pages 27–38.
[27] P. Quinn and T. Nadeau. Service Function Chaining Problem Statement. draft-quinn-sfc-problem-statement-10 (work in progress), 2014.
[28] S. Sahhaf, W. Tavernier, D. Colle, and M. Pickavet. Network service chaining with efficient network function mapping based on service decompositions. InProc. of NetSoft ’15. IEEE, 2015.
[29] J. Sherry and S. Ratnasamy. A Survey of Enterprise Middlebox De-ployments. Technical Report UCB/EECS-2012-24, EECS Department, University of California, Berkeley, Feb 2012.
[30] N. Spring, R. Mahajan, and D. Wetherall. Measuring ISP topologies with Rocketfuel. 32(4):133–145, 2002.
[31] S. Surendra, M. Tufail, S. Majee, C. Captari, and S. Homma. Service Function Chaining Use Cases in Mobile Networks, 2014.
[32] M. Xia, M. Shirazipour, Y. Zhang, H. Green, and A. Takacs. Network function placement for nfv chaining in packet/optical datacenters. Light-wave Technology, Journal of, 33(8):1565–1570, April 2015.